Rep:StudentWiki:tw2115MgOExperiment2017
Introduction
Computational methods offer a powerful method of solving difficult problems. By defining a lattice as a structural input, computational simulations are able to make a number of predictions pertaining to a infinite crystal system. In this case we look at a magnesium oxide system and briefly a calcium oxide. To probe data from the system (energy, volume and thermal volume expansion) we make use of the Quasi-harmonic and Molecular Dynamic calculation methods.
Magnesium Oxide Crystal Structure.
Magnesium Oxide crystal has a face centred cubic Bravais Lattice type. To describe the lattice a set of parameters a,b and c are defined to describe the dimensions of the cell. Values α,β,γ are used for the internal angles. For this exercise we make use of the primitive cell (the smallest possible representation of the system, with lattice points on each vertex) used by GULP for quasi-harmonic calculations , Supercell (contains a collection of primitive cells in this case 4x4x4 giving 32 unit cells.) used for molecular dynamics. By thinking about the lattice in this way it allows consideration into what happens to the lattice when the particles are given energy to move. In this investigation we manipulate the temperature of the system using computational methods to investigate the resulting changes in the lattice and its free energy. The input primitive lattice structure describes a rhombohedron of length 2.9783 Å and internal angle 60 degrees.
Single bond Vibrations
Upon heating a molecule bonds between nuclei become excited and begin to vibrate around a equilibrium distance which can be thought of as a harmonic parabolic energy surface. The size of the perturbations are therefore a result of the temperature populating higher energy states or "phonons" in the curve. In reality the curve is not a simple harmonic oscillator and we must consider repulsion between nuclei at small inter nuclei distances and breaking of the bond at long extension (high energy).
Multiple bond Vibrations forming Normal Modes.
when we consider more than two atoms or primitive cells oscillating together, there must be consideration as to how the vibrations combine. To combine these vibrations we consider how neighbouring groups of atoms vibrations combine to form waves with different wavelengths. we can imagine a sine wave over the nuclei with + as one direction and - in the reverse direction. For the lowest energy mode there are no nodes i.e all atoms travel together in phase. For a sine wave such as this there is no atom in an opposing motion and therefore the wavelength is infinite, or in reality much larger than the lattice parameter a. Looking at equations 1 and 2 this corresponds to a wavelength of infinity, a k value of 0 and therefore sin(0) = 0 and a frequency of 0. At the opposite end of the scale if each atom has a change of direction the wavelength of the phonon becomes the distance between the atoms a. By considering equations 1 and 2 again the value of sin(1) = 1 and this marks the maximum frequency and the end of the first broullin zone.
Equation 1. Expression for the wave vector (k vector) in terms of the wavelength.
Each wave vector K has a frequency ω associated with it given by the equation below
Equation 2. Expression for the frequency as a function of the force constant (J), the reduced mass (M) and the wave vector (K).
The Reciprocal Lattice
The reciprocal lattice is a lattice with lattice constant defined by the k value that marks the end of the first broullin zone (the maxima of frequency). This can be stated mathematically as below where a* is the lattice parameter of the reciprocal lattice.
Equation 3. Lattice parameter a* as a function of the original lattice parameter a.
the reciprocal nature of the lattice can be observed when changes are made to the lattice parameter of the original lattice. If the original lattice is increased by a scale factor 2 then the new lattice parameter a' = 2 a however using equation 3 this corresponds to a halving of the reciprocal lattice.

Quasi-Harmonic approximation
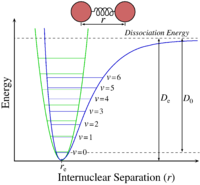
A phonon is a excited vibrational mode or state of a molecule with a quantized frequency and energy. By considering a 1D representation, the lattice can be simplified to a linear lattice. By considering sections of the linear lattice such as two atoms connected by a bond a simple exactly harmonic energy surface can be constructed with quantized phonon states. When the temperature of the system is changed there as resultant changes to the populations of the phonon states, this however fails to describe the temperature dependence on the volume of the system. The symmetry of the harmonic parabola mean that the bonds are both extended and compressed equally meaning there is no change in average bond length. In the harmonic model the bond length is therefore independent of temperature. We need a better model to consider the effects of temperature on bond length in order to calculate α - the thermal expansion coefficient.
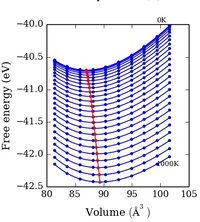
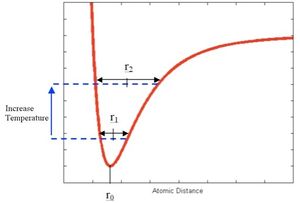
The Quasi-harmonic approximation can be thought of as a point between being exactly harmonic and the real system. Figure 1.1 shows the exactly harmonic potential energy surface. The figure shows that even at higher energy (temperature) the average bond length (inter nuclear separation) remains constant. At the other extreme the real system has a complicated potential energy surface that is anharmonic. How close we can get to this ideal system depends on the assumptions and approximations employed. The quasi-harmonic uses a potential energy curve that gives a change in average bond length temperature. Figure 1.3 is a representation of the quasi-harmonic energy surface. At first this figure appears different to 1.1 and 1.2 however if a modulus of the Free energy is taken then it can be imagined as the temperature goes up the equilibrium bond length shifts to the right, this point is further expanded on and plotted later.
The Quasi-Harmonic approximation is still only an approximation and will become less accurate as the system moves from ideal behaviour towards real behaviour. In this system this occurs near the melting point. When the temperature of the system increases anharmonic effects reduce the accuracy of using a simple harmonic energy well. This model does not account for repulsion between atoms nor dissociation of atoms when bonds are extended. This approximation is therefore most valid at low temperatures where the behaviour of the bonds is close to harmonic. The Free energy surface calculation for this approximation is shown below:
Equation 4. General expression for the free energy.
Equation 5. Energy term in equation in 4 as a sum of U (internal energy) and Eo (zero point energy).
Equation 6. Internal Energy of the system in terms of the frequency times plancks constant, summed over all k points and branches (j).
Equation 2.
Equation 7. Entropy as a function of frequency.
Equation 8. Combined expression for the free energy.
Equation 9. Thermal volume expansion coefficient as a function of the volume and temperature.
**Important** h is the reduced the plancks constant ħ (the HTML gives an error when ħ is used)
Molecular Dynamics Model
The other model used in this investigation into the properties of MgO is molecular dynamics. One of the differences in input between the Quasi-Harmonic approximation and the molecular dynamics model is the size of lattice input. For the Quasi-harmonic approximation it is sufficient to work in the primitive cell as the bond vibrations can be expended to the whole system without need for multiple atoms. For molecular dynamics a ensemble of atoms is a more appropriate system to capture a better representation of the motion of the atoms. By choosing 32 atoms in the ensemble a compromise is made between accuracy and efficiency of the simulation. The larger the ensemble the more effective representation of how the atoms interact, however this involves extra forces on each atom and can take significant amounts of time. The other condition set in the simulation is that the conditions are NPT meaning that N atoms T temperature and P pressure are all kept constant.
To run the simulation the computer first chooses a set of random velocities for each atoms roughly equal to the expected thermal motion at the set temperature T. Next the computer must calculate the forces acting on each atom to do this the computer considers anharmonic potentials. Using the calculated forces acceleration can be calculated using Newtonian laws. Once the acceleration is found the computer can predict the velocity and position of the atoms at time t +dt (1 time step). By repeatedly running this algorithm the software is able to equilibrate the atom motion until the correct temperature is found.
This simulation works well at high temperature due to the anharmonic potential surface used to calculated the forces between atoms, however due to the dynamic nature of the simulation and random initial velocities runs of the same experiment will give fluctuations in the values of volume. A larger supercell would correct this but take too long for the purposes of the investigation. Outer atoms of the lattice also behave differently to atoms in the bulk due to the different forces they feel. A large enough average must be used to minimise these effects.
Experimental
The simulations referred to above were run using DLVisualise and GULP (general lattice utility program) in a Linux environment. For the input files for the software a .str and .lib file were used. The .str file contained the structural information of the lattice cell. The .lib file contains the Buckingham potential information. For all calculations the pressure was set to 0 Pa (isobaric system).
Quasi-Harmonic Computation
The first calculation ran was calculating the phonon dispersion for the MgO crystal system. This gave a plot of K (the wave vector of the phonons) against energy. N points were set to 50 meaning 50 k points were considered along the conventional k path in the 3 dimensions of the lattice. Once the phonon dispersion was mapped the densities of states were tested using various shrinking factors to alter the resolution. Shrinking factors of 1x1x1, 2x2x2, 4x4x4, 8x8x8, 16x16x16, 32x32x32 were tested. The same set of shrinking factors were then used to investigate the change in precision of a Helmholtz free energy calculation at 300 K. Finally the quasi-harmonic approximation allowed calculation of cell volume at varying temperatures between 0 - 2750 K. By plotting the volumes of the lattice at the temperatures tested it was possible to use equation 9 to calculate the thermal volume expansion coefficient.
Molecular Dynamic Computation
For the molecular dynamic reaction the lattice structure size was increased to 32 unit cells. Next the condition parameters were set to NPT (isothermal and isobaric conditions) this told the computer that the volume was the parameter allowed to change with temperature. The steps for the simulation had to then be chosen, the steps chosen are below.
| Step | |
|---|---|
| Time step | 0.5 (fs) |
| equilibrium step | 500 |
| Production step | 500 |
| sample step | 5 |
| trajectory step | 5 |
The output of this calculation gave an instantaneous set of data and averaged set of data over all the steps ran previously. These steps where suitable as the final averaged temperature matched the temperature set initially meaning the system had sufficient time to equilibrate at the desired temperature and thus could predict averaged distance between atoms at this temperature. The temperatures and associated volumes could be plotted in the same way as the qausi-harmonic approximation and from the plot the thermal expansion coefficient could be calculated.
Extension on CaO
By altering the structure and library files of the magnesium oxide it was possible to run the quasi-harmonic approximation on calcium oxide. To do this we make use of the identical symmetry of the two molecules MgO and CaO, this means the only parameters that require changing are the lattice parameters and atomic charge. To change the lattice parameters a ratio was calculated between the x-ray diffraction data of CaO and MgO giving a scale factor that would increase the lattice parameter of MgO to CaO. For the library file the GULP software website contains the relevant buckingham[4] potentials. By using these files it was possible to find the phonon dispersion for CaO, the density of states of the dispersion and the thermal expansion coefficient.
Results & Discussion
Phonon Dispersion
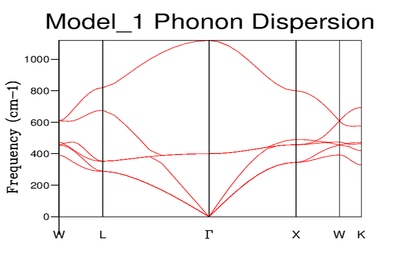
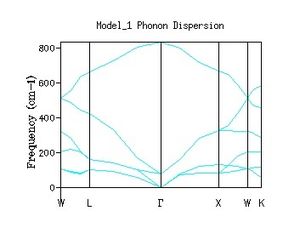
In the introduction the K vector (wave vector) was described by equation 1 where it is a function of the wavelength of the oscillation. For each value of k (each wavelength) there is an associated frequency. Although the curve appears continuous it is made up of discrete values of K. However it has the appearance of a band due to the large number of K values corresponding to the large number of phonons. The values along the x axis correspond to the path chosen through k space. By labelling the dispersion in this way, the result is a 3 dimensional of frequencies through the lattice. The graph is made up of 3 overall branches split into 3 acoustic branches (low frequency) and 3 optical (high frequency). Acoustic branches are characterised by ω = 0 at k = 0. This is because the wavelength is infinite thus k = 0 and ω = 0 (eq2).
Phonon Dispersion (Density of State)
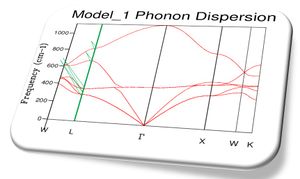
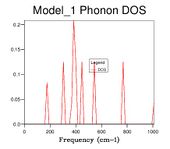
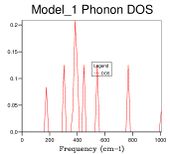
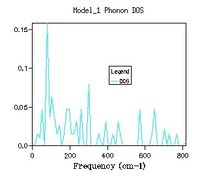
Phonon density of state graphs are created by forming a grid of test k points. Figure 3.1 shows a plot using a shrinking factor of 1x1x1 corresponding to 1 K point bisecting the cell parameter in all 3 directions in half, corresponding to the centre of the lattice. This K value corresponds to L on figure 2 the phonon dispersion. The first observation we make is that for the k value probed there are only 4 distinct peaks this means there must be some overlap in the branches. Due to the fact there is only a single k value the density of states is essentially a cross section through the single value of k. When the frequencies are compared to the dispersion its clear that the K value is corresponding to a point on or near L which also has 4 branches and the same frequencies. Position L must be be the centre of the lattice.
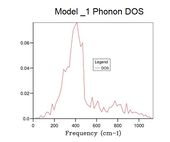
The next size grid uses shrink factors 2x2x2. This grid size samples 8 points and it is therefore no longer possible to represent it as a single cross section. The 2x2x2 grid size gives a better resolution of the density of states by using more samples, but it is still a poor representation of the density of states. This is further seen through the large fluctuation in the zero point energy. The 8x8x8 grid size begins to appear to be a more appropriate resolution for observing the density of states. At this point there are 512 K points (512 cross sections along k superimposed). When the zero point energy is compared to the next resolution (16x16x16 4,096 k points) there is no change meaning the energy has converged to 0.0000001 eV. It is interesting however that although the energy has converged, changes are still observable in the plot. The minimum shrinking factor to get the correct data from the system is 8x8x8, this grid size has sufficient samples to probe a lattice of this size.
The shape of the density of state curve is derived from the dispersion of phonons plot, figure 2. The density of states plot originates from the fact that for a single frequency there are multiple values of k (one to many mapping). The phonon dispersion shows large areas of linear regions where many k values share similar frequencies around 300,400 cm-1 this corresponds to regions in the density of states with a large area. At higher frequencies the mapping is closer to one to one between frequency and k points. Consequently the density of states is much lower at the higher frequencies. This represents the number of states available to the lattice at a set energy in the band structure.
Speculation on the effect of unit cell size on optimal grid size
The number of k points (grid size) required to describe the density of states is proportional to the size of the reciprical lattice that is being probed. The lattice parameter for the reciprocal lattice a* was given previously in equation 3.
To illustrate the effect of this it was considered that doubling by a factor of 2 halved the size of the reciprocal lattice. Therefore a lattice with a larger lattice parameter a produces a smaller reciprocal lattice with parameter a* and therefore requires a smaller grid to get a good representation. Calcium oxide is a similar lattice size but slightly larger it would be expected that a slightly smaller grid size is required evidence of this is presented below. The zeolite faujasite has a lattice parameter of roughly 24 angstrom. The much larger lattice has a much smaller reciprical lattice and can therefore be actually represented, one would speculate, by a smaller grid size than that used for MgO. Lithium crystals are an example of the opposite effect. The unit cell of lithium metal is much smaller than MgO calculated and therefore a greater grid size is required to accurately represent the lithium unit cell.
Density Dispersion & Density of states of CaO
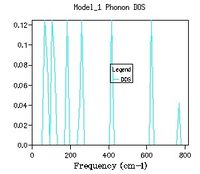
CaO has its own phonon dispersion which is different to that of MgO. For the dispersion of CaO phonons the same method was used to find the optimum resolution for the new lattice size. The first observation that can be made is the first peaks from a 1x1x1 set of shrinking parameters is also the cross section at K = L this is because the same k space path is used as MgO and 1x1x1 corresponds to the centre of the cell. A difference between these two lattices is that we observe that the energy of CaO converges earlier than in MgO, this was mentioned previously and is related to the size of the reciprocal lattice. In CaO the zero point energy is the same for 4x4x4 and 8x8x8 meaning a smaller grid size is required. The bigger the lattice the smaller the reciprocal lattice of the crystal. By using equation 2 the frequency of the phonons in MgO can be related to CaO. The easiest phonon to consider is when K = π/a (the maxima).In this case sin(1) = 1 and the frequency is equal to the square root of the bond strength over the reduced mass. By considering the ratio of reduced mass there should be a roughly 0.92x decrease in frequency. The true value is approximately 0.72 therefore there must be an effect from the force constant J.
Quasi-Harmonic Calculation of Free Energy
Next the Helmholtz free energy was calculated using the quasi-harmonic approximation. To calculate the free energy equation 8 was used which sums terms from all the k points on all the bands j, this represents the infinite crystal. The best calculation would use an infinite grid of infinite k points to get a perfect representation of the free energy (perfect to the approximation used). Similar to density of states by increasing the k points a better picture of the free energy is obtained. Equation 8 also shows that the more k values the more terms in the taylor expansion and a more accurate value of the Helmholtz energy is found. By calculating the Helmholtz energy at varying grid sizes it is possible to find the smallest number of k terms over all bands j required to get a accurate approximation of the free energy.
| Shrinking Factors | 1x1x1 | 2x2x2 | 3x3x3 | 4x4x4 | 5x5x5 | 8x8x8 | 16x16x16 | 32x32x32 |
|---|---|---|---|---|---|---|---|---|
| Helmholtz Free energy (eV) (300K) | -40.930301 eV | -40.926609 eV | -40.926432 eV | -40.926450 eV | -40.926463 eV | -40.926478 eV | -40.926482 eV | -40.926483 eV |
The data above shows that 8 k points is sufficient to approximate the free energy to 0.001 eV (1 meV), 27 points gives a representation to 0.0001 eV (0.1 meV), for 0.000001 eV a 16x16x16 grid size is sufficient (0.001 meV). For a 0.5 meV accuracy the best grid size to use for MgO would be 4x4x4. For the same reasons as the density of states plot the larger the lattice parameter the smaller the minimum grid size needed to make an approximation of the free energy.
Quasi-Harmonic thermal volume expansion coefficient
By using the results of the previous calculation a grid size of 16x16x16 was used as the grid size to calculate the thermal expansion coefficient.
As previously commented using the quasi-harmonic approximation allows calculation of the variation in volume dv with temperature change dt. The table below shows the data collected from the system by varying the temperature between 0 K and 2750 K. The melting point of magnesium oxide is reported to be 2,852 °C or 3,125 K this is significant for the quasi-harmonic approximation. The quasi-harmonic approximation does not consider effects such as melting or bond dissociation (anharmonic effects associated with the real system) it is therefore unable to accurately calculate the behaviour of the unit cell at high temperatures particularly around or beyond the melting point. The calculations given here did not go to 3000 K as it was near the melting point meaning there would be significant anharmonic effects reducing the accuracy, calculations at high temperatures also take longer time scales to calculate.
| Temp 0 - 1000 K | 0 K | 100K | 200 K | 300 K | 400 K | 500 K | 600 K | 700 K | 800 K | 900 K | 1000 K |
|---|---|---|---|---|---|---|---|---|---|---|---|
| free energy (eV) | -40.90097 | -40.90241 | -40.90935 | -40.92807 | -40.95852 | -40.99934 | -41.04921 | -41.10700 | -41.17182 | -41.24289 | -41.31971 |
| Cell Parameters (Å) | 2.986565 | 2.986564 | 2.987613 | 2.989403 | 2.991646 | 2.994156 | 2.996846 | 2.999674 | 3.002623 | 3.005674 | 3.008827 |
| Volume (Å3) | 18.836497 | 18.836494 | 18.856215 | 18.890044 | 18.932533 | 18.980142 | 19.031257 | 19.085097 | 19.141359 | 19.199683 | 19.260088 |
| Temp 1250-2750 K | 1250 K | 1500 K | 1750 K | 2000 K | 2250 K | 2500 K | 2750 K |
|---|---|---|---|---|---|---|---|
| Free energy (eV) | -41.53383 | -41.77487 | -42.03904 | -42.32364 | -42.62675 | -42.94712 | -43.28424 |
| Cell parameters (Å) | 3.017162 | 3.026202 | 3.036090 | 3.047071 | 3.059580 | 3.074485 | 3.094151 |
| Volume (Å3) | 19.420364 | 19.595207 | 19.787656 | 20.002891 | 20.249969 | 20.547081 | 20.943653 |
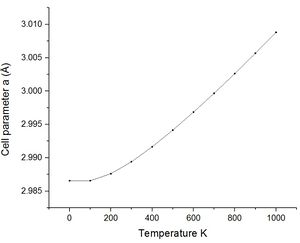
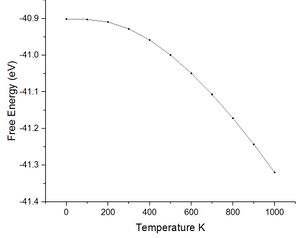
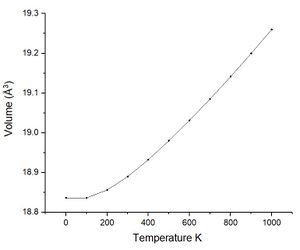
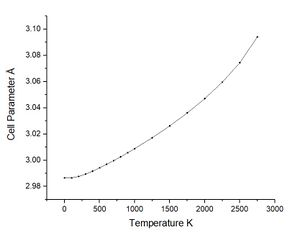
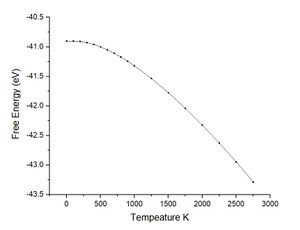
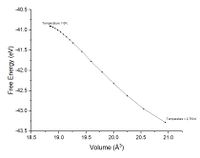
The figures below show plots of the cell parameter, free energy and volume against temperature for low temperatures and a large range of temperatures.
Looking at the lower temperature curves (top row) the curves start with a flatter linear region before reaching a linear region with a greater gradient. Physically this means when first heated from 0 K there is little to no expansion according to the approximation used. To explain this the way free energy is calculated must once again be considered for this approximation. Using equation 4 the linear region can be rationalised from the size of the entropic contribution contribution -TS relative to the internal and zero point energies. At lower temperature the entropic contribution is small and the free energy is dominated by the zero point energy and the internal energy the change in free energy is therefore small and undergoes little change. As the temperature is increased there comes a greater contribution from the entropic terms of the free energy and the entropic / temperature term dominates the free energy. At this point the volume of the system begins to change to minimise the free energy of the system.
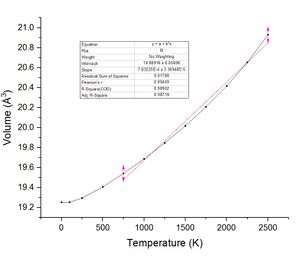
The most important of these graphs for finding the thermal expansion is the plot of volume against temperature. By calculation of the gradient of the graph in the linear region, using the more accurate lower temperature set, and recording the initial volume at the lowest temperature used. The figure below shows this plot with the fit and fitting parameters.

| Temperature Range | 300 - 1000 K | 300K - 2500K | 300 K - 2000 K | Literature (298 K)[5] |
| Initial Volume (Å3) | 19.890044 | 19.890044 | 19.890044 | N/A |
| Thermal expansion | α = 2.6715 x 10⁻⁵ K−1 | α = 3.8252 x 10⁻⁵ K−1 | α = 3.1833 x 10⁻⁵ K−1 | α = 3.11 x 10⁻⁵ K−1 |
The value of α calculated here has been calculated theoretically. By comparing the value calculated with an experimental value the error within the computation can be assessed. The literature reports a value of the thermal expansion coefficient of α = 3.11 x 10⁻⁵ K−1 on comparison of the literature data with theoretical calculations the values are reasonably close in the range 300 - 2000 K. The temperature difference may also be responsible for some error between calculation and experimental most likely a overestimation. When the temperature is increased past 2000 K the approximation becomes less accurate and the value calculated for the thermal expansion differs from the literature to a larger extent.
To compare the literature experimental values and theoretical calculations the limitations of the approximation must be considered. When the simulations are run the only force considered on that atoms is the buckingham ionic potential (+2/-2) between atoms. In reality there are other forces that aren't Coulomb which despite being a much smaller scale should be considered for a more accurate description. The calculation also ignores the electron shells of the atoms and considers the atoms as a single charged ball. The most important approximation as previously mentioned is the neglect of anharmonicity in the energy surface. Fortunately the literature value and theoretical temperature range were found at lower temperatures where the quasi-harmonic is close to the real value. To find the thermal expansion coefficient we must assume the expansion is isotropic (expands in all directions uniformly).
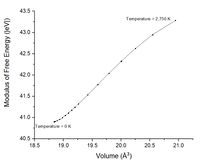
The exact harmonic approximation is a parabola with the equilibrium bond length in the centre of a symmetric well (Figure 1.1). As mentioned prior when the temperature is increased in this model the bond is extended and compressed but the average bond length and therefore volume remains constant. The quasi harmonic approximation therefore requires a volume dependence in the free energy. This dependence comes from the frequency which is proportional to the wavelength of the phonons. By using this approximation which is closer to the real behaviour of the lattice and enables volume dependence on temperature like the real system Figure 10 could be plotted. Similar to figure 1.3 this graph shows that at high temperatures the energy surface has an average bond length displaced from the equilibrium. To make this more recognisable like figure 1.1 the modulus has also been plotted figure 10.1. Comparing figure 1.1 and figure 10.1 the dotted line that represents average bond length is equivalent to the plot in 10.1. Figure 10.1 is missing the energy surface and energy states but it is sufficient to show the volume changing as if the surface were there. To help imagine this figure 10.2 Shows a rough energy surface, this neatly shows a rough representation of the quasi-harmonic energy surface.

The origin of thermal expansion is from the increase in kinetic energy in the system as heat energy is increased. Figure 11. shows the real energy surface (anharmonic surface) as a function of temperature. As the temperature of the system increases the kinetic energy increase means the atoms vibrate over larger distances due to greater population in higher energy phonons. Due to the real system being anharmonic the bonds will expand about the equilibrium distance more than they contract. This shifts the average bond length to a greater atomic distance as shown in figure 11. Figure 11 and the energy surface roughly represented in figure 10.2 will be close for low temperatures but different at high temperatures.
Thermal Expansion of CaO
The data below was collected by using the CaO.str file referenced earlier. The method used was exactly the same as MgO.
| Temp | 0 K | 100 K | 250 K | 500 K | 750 K | 1000 K | 1250 K | 1500 K | 1750 K | 2000 K | 2250 K | 2500 K |
|---|---|---|---|---|---|---|---|---|---|---|---|---|
| Free Energy (eV) | -40.72831 | -40.72922 | -40.74888 | -40.84442 | -40.99871 | -41.19542 | -41.42509 | -41.6818 | -41.96163 | -42.26176 | -42.58023 | -42.91537 |
| Cell Parameter (Å) | 3.00820 | 3.008420 | 3.010569 | 3.016395 | 3.023324 | 3.030896 | 3.039053 | 3.047849 | 3.0574703 | 3.067911 | 3.079701 | 3.093414 |
| Volume (Å3) | 19.253070 | 19.253065 | 19.294186 | 19.406219 | 19.540044 | 19.687002 | 19.846164 | 20.018748 | 20.207331 | 20.416131 | 20.652134 | 20.928945 |
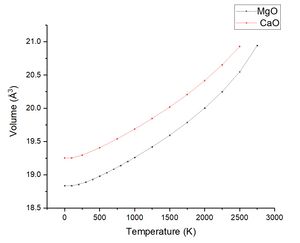
Like MgO the data was plotted volume against the temperature as seen in figure 12 and figure 13 (a comparison with MgO).
 |
 |
|---|
| Temperature Range | 250 - 2500 K | lit 300K-1250 K[7] |
| Initial Volume (Å3) | Vo = 19.294186 | N/A |
| Thermal Volume Expansion | α = 3.7126 x 10⁻⁵ K−1 | α = 4 x 10⁻⁵ K−1 |
The lack of significant figures in the literature mean that this source is only a rough guide, the literature aim was to find the linear thermal expansion coefficient a more common value investigated due to its useful applications in solids.
Molecular Dynamics
After using the quasi-harmonic molecular dynamics was used as an alternative to finding the thermal volume expansion coefficient. The table below shows how the volume of the supercell and primitive cell change, according to the dynamic model, with change in temperature.
| MD | 100 K | 250 K | 500 K | 750 K | 1000 K | 1250 K | 1500 | 1750 K | 2000 K | 2250 K | 2500 K | 2750 K | 3000 K | 3500 K |
|---|---|---|---|---|---|---|---|---|---|---|---|---|---|---|
| Volume (4x4x4) (Å3) | 599.625777 | 602.248972 | 606.110934 | 610.22030 | 614.295991 | 618.894734 | 625.464047 | 631.414527 | 635.479712 | 638.833016 | 640.414849 | 648.538598 | 659.887840 | 664.244518 |
| Primative volume (Å3) | 18.7383055 | 18.82028037 | 18.9409666 | 19.0693843 | 19.19674971 | 19.340460 | 19.54543896 | 19.7317039 | 19.858741 | 19.963531 | 20.01296403 | 20.2668431 | 20.621495 | 20.7576411810 |
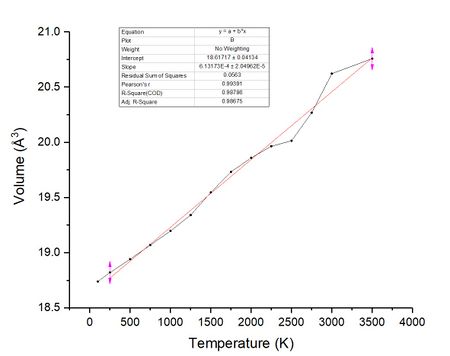
Figure 14 below shows the plot similar to figures 7.3 and 8.3 of volume against temperature. By the same method of using the gradient of the plot into equation 9 the thermal expansion volume coefficient can be calculated for the molecular dynamics calculation.
| Temperature Range | 250 K - 3500 K | 100 K - 1000 K | 1500 K - 3000 K | Literature (298 K)[5] |
| Initial Volume (Å3) | Vo = 18.82028 | Vo = 18.78305 | Vo = 19.54543 | N/A |
| Thermal expansion coefficient | α = 3.2580 x 10⁻⁵ K−1 | α = 2.7617 x 10⁻⁵ K−1 | α = 3.2238 x 10⁻⁵ K−1 | α = 3.11 x 10⁻⁵ K−1 |
The table above shows the thermal volume expansion coefficient for a variety of temperature ranges. The most striking difference between this set of thermal expansion coefficients and the quasi-harmonic approximation is the high temperature thermal expansion coefficient. When using the quasi-harmonic approximation it was found that using the highest temperatures measured resulted in a large variation in α when compared to the literature value. It appears from the data that when using molecular dynamics the most accurate approximation of the thermal volume expansion coefficient comes from using a higher range of temperatures. The data shows molecular dynamics is a better approximation at higher temperature. This is likely to be a result of the way that molecular dynamic model is calculated. Unlike the quasi-harmonic approximation the molecular dynamic simulation does not account for the zero point energy of a molecule (hence why there is no 0 K data). Considering the equation for free energy ignoring the free energy is reasonable at high temperatures as the TS terms (temperature x entropic contribution) become much larger than the constant zero point energy. However at low temperatures to get a more accurate picture the zero point energy must be considered. This corresponding under estimation of the energy in the molecular dynamic calculation is clearly seen in figure 15 a plot of the quasi-harmonic approximation against the molecular dynamics data.
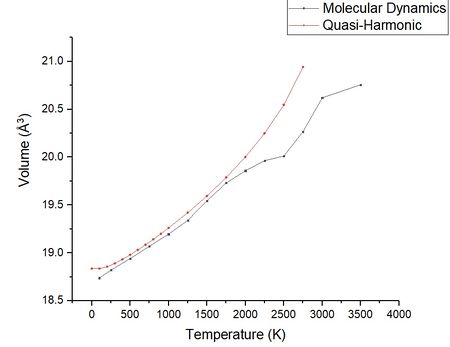
Molecular dynamics is better equipped to calculate the volume across phase boundaries than the quasi-harmonic approximation. The behaviour shown by the MD plot a change in gradient around and leading up to the melting point. When the solid starts to melt the bonds increase and the volume sharply increases consistent with the volume change going from a solid to a liquid. This behaviour is further observed by animating the molecular dynamics at various temperatures.
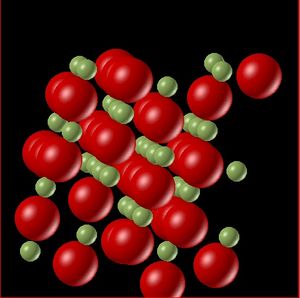
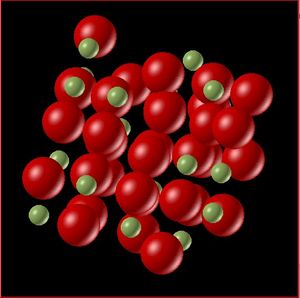
The above figures show snapshots of the lattice at temperature 300 K and 3000 K. In the first snapshot the temperature is well below the melting point of the solid, and the lattice is generally well ordered with the exception of the edge atoms which are less accurate due to their positions feeling different forces. The second snapshot shows the lattice above the melting point. There is a clear difference in the ordering of the lattice, there is far less order (more entropy in the system), this is further evidence that the molecular dynamics model is better equipped to represent the changes in phase.
What figures 16.1 and 16.2 also shows is that the atoms on the outside of the lattice feel different forces to the rest of the lattice. By increasing the lattice size the magnitude of this effect is decreased. Using a bigger supercell reduces these effects in the average. In the quasi harmonic approximation data is taken from k points in the lattice it was found previously that a 16x16x16 gridsize giving 4,096 data points was accurate to a 1000th of a meV. In the MD model the atoms themselves are probed to retrieve data and the more atoms in the cell the more accurate the results. It is possible that using a 16x16x16 supercell would produce a similar accuracy by probing the same number of data points. However simulating the dynamics of a supercell this large would take a large amount of time due to the number of individual calculations required to calculated the forces, velocities and positions.
When the phase changes from a solid to a liquid there is should be an increase in the gradient of volume to temperature (an increased thermal expansion coefficient). This is because the atoms are more free to move and held together by weaker interactions. Figure 15 shows a great increase in volume around 3000 K this could be explained by the start of a phase change, the literature states the melting point of 3098 K , although the MD shows the melting at a lower temperature it should be remembered that melting is a dynamic process and it is likely the bonds begin to extend and start to dissociate at temperatures slightly lower than the literature, we also have to remember the assumptions made in the model. It would be expected if the temperature was tested to higher temperatures then a steeper curve would be exhibited. Although the MD model can show near the melting point the atoms move freely as if a liquid the plot in figure 15 shows less linear behaviour. This is likely due to the simulation measuring bonds between specific atoms rather than average bond lengths between atoms in close proximity.
In the case of the quasi-harmonic approximation the lattice cell volume is over estimated likely due to anharmonic effects, over estimation of the lattice volume is commonly reported in the literature as a feature of using the quasi-harmonic approximation at high temperature although it should be noted the literature also reports in some systems the quasi-harmonic approximation is accurate to the melting point where it fails[8]. The overestimation is most likely from over estimating the entropy of the system a flaw discussed in the literature. As the temperature increase the overestimation becomes more prominent and results in overestimation of the volume.
Conclusion
The first conclusion to be made about both theoretical calculations is that they both give thermal volume expansions strikingly close to the literature value, both techniques are effective methods for making predictions about the properties of materials. However this investigation also highlights the failings of both these methods. For the Quasi-Harmonic approximation the use of temperature dependent phonon frequencies on the free energies allows consideration of the volume in the free energy figure 10.2. The quasi-harmonic uses an adapted harmonic energy surface that is no longer independent on temperature this surface is hinted at by figure 10.2. This approximation has been shown to be accurate at low temperature with the thermal expansion coefficient being close to the literature value. If the real energy surface was drawn the equivalent to 10.2 the resulting line would expect to overlap at low temperatures and deviate at high temperatures as the quasi-harmonic curve becomes a poorer approximation. It should be noted the effectiveness of the quasi approximation to describe a real energy surface varies between systems and is more effective in some than others.
The Molecular dynamic calculation is also limited by assumptions made in the model. The assumption of no zero point energy is responsible for a under estimation of the free energy of the molecules and a small lowering of the volume. As the temperature increases equation 4 shows that this inaccuracy becomes less of a factor as the size of the temperature entropic contribution becomes the main contribution to the free energy. Another issue with the MD model is that outer atoms on the lattice feel different forces to those inside the lattice and in order to gain an accurate representation of the bulk of the lattice the size of the lattice is important. Finally the consideration of phase transition in the molecular dynamics model mean that it is a useful method for predicting properties of materials at higher temperatures.
References
- ↑ Nave, R. (n.d.). Quantum Harmonic Oscillator: Schrodinger Equation. Retrieved from http://hyperphysics.phy-astr.gsu.edu/hbase/quaref.html
- ↑ Shay, H., & Holmes, A. (2016). 13.5: Vibrational Overtones. Retrieved from https://chem.libretexts.org/Textbook_Maps/Physical_and_Theoretical_Chemistry_Textbook_Maps/Map%3A_Physical_Chemistry_(McQuarrie_and_Simon)/13%3A_Molecular_Spectroscopy/13-05._Overtones_Are_Observed_in_Vibrational_Spectra
- ↑ S. P. Ong, S. Cholia, A. Jain, M. Brafman, D. Gunter, G. Ceder, and K. A. Persson The Materials Application Programming Interface (API): A simple, flexible and efficient API for materials data based on REpresentational State Transfer (REST) principles. Computational Materials Science, 2015, 97, 209–215. doi:10.1016/j.commatsci.2014.10.037
- ↑ GULP. (n.d.). Home Downloads Help FAQ Examples Running GULP GULP manuals Overview of GULP capabilities Potential Models GULP News GULP Bugs next up previous contents Next: Defects Up: Guide to input Previous: Species / libraries Contents Input of potentials. Retrieved from https://nanochemistry.curtin.edu.au/gulp/help/gulp_30_manual/gulpnode49.html
- ↑ 5.0 5.1 A.Chopelas, Phys Chem Minerals, 1990, 17, 142-148.
- ↑ Oliver, M., & Cranford, S. (n.d.). Thermal Expansion. Retrieved from http://web.mit.edu/mbuehler/www/SIMS/Thermal Expansion.html
- ↑ A. S. Madhusudhan Rao and K. Narender, “Studies on Thermophysical Properties of CaO and MgO by -Ray Attenuation,” Journal of Thermodynamics, vol. 2014, Article ID 123478, 8 pages, 2014. doi:10.1155/2014/123478
- ↑ (Janine George, 1 Volker L. Deringer, 1, 1 Paul Müller, 1 Ulli Englert, 1, & Richard Dronskowski1, n.d.)


