Rep:St3515MgO
The Thermal Expansion of MgO using Computational Methods
Abstract
Calculations using the quasi harmonic approximation and molecular dynamics were used to investigate the thermal expansion of MgO. Calculations were carried out using GULP (General Utility Lattice Programme) on the visualisation package DLVisualize. The data obtained were used to plot the conventional cell lattice against temperature from which the thermal expansion coefficient of MgO was determined. The thermal expansion coefficient determined using the quasi harmonic approximation and MD calculations were 9.683521 x 10⁻⁶ K-1 and 10.230521 x 10⁻⁶ K-1 respectively, differing from the literature value of 12.11 x 10⁻⁶ K-1 by approximately 20 %, suggesting that both methods model the motion of the ions reasonably well.1
Introduction
The thermal expansion of materials describes how the system changes as the temperature changes. For a solid material, an increase in temperature results in an increase in the vibrational kinetic energy of the atoms and hence the volume. The coefficient of thermal expansion α describes how the volume of the system changes when the temperature of the system increases by 1 K and can be calculated using eq. 1,
α = ∆V/(Vi∆T) eq. 1
where Vi is the initial volume and ∆V and ∆T are the change in volume and temperature respectively.
The thermal expansion of MgO, a face centred cubic lattice where the lattice parameters a, b and c are equal, was investigated using the quasi harmonic approximation (QHA) and molecular dynamics (MD).

In the harmonic approximation, the equilibrium bond length for a diatomic remains the same with increasing temperature. QHA is different to the harmonic approximation in that it includes some anharmonicity and therefore the equilibrium position increases with temperature. The primitive cell of MgO, the smallest unit to describe the system, was used in the QHA calculations because periodic wavefunctions are studied (Figure 1a). The programme predicts the structure of MgO at different temperatures by finding the structure in which the Helmholtz free energy F is minimised. The Helmholtz free energy is given by,
F = Eo + 1/2∑k,jħwk,j + KbT∑k,jln[1-e-ħwk,j/KbT] eq. 2
where Eo is the internal energy which includes the volume factor, the second term is the zero point energy and the last term is the entropic contribution.
The particle nature of vibrational modes is known as phonons. Phonons have a wavelength λ that is related to the wavevector k by,
λ = (2π)/k eq. 3
Different values of k give rise to different frequencies of vibration w, and a plot of w against k is known as the phonon dispersion curve. The vibrational band structure observed in this plot is known as a branch and the number of branches observed in the plot is given by,
Number of Branches = N x s eq. 4
where N is the number of atoms in a unit cell and s is the dimension. For QHA, the programme computes the free energy by summing over the k-points or vibrational energy levels.
MD does not use the harmonic approximation but instead simulates the motion of the atoms at a particular temperature in accordance with Newton’s second law. Calculations are repeated and averages of properties such as energy and temperature are recorded when they start to settle. Rather than a primitive cell, a supercell consisting of 32 MgO units was used (Figure 1c). The primitive cell cannot be used because periodic wavefunctions are not studied; instead ions are studied. If a primitive cell was used then vibrations cannot be studied, as all the cells will be moving in phase.
Experimental
Single point GULP was executed on a primitive MgO cell from which a phonon dispersion curve was computed. Npoints was set to 50 under Phonon Dispersion and Calculate Phonon EIgenvectors was selected.
Single point GULP was executed on a primitive MgO cell using grid sizes 1x1x1, 2x2x2, 3x3x3, 4x4x4, 8x8x8, 16x16x16, 20x20x20, 25x25x25, 30x30x30 and 40x40x40 at a temperature of 300 K. A density of states plot was obtained for each grid size. A grid size of 20x20x20 was then used to execute optimisation GULP at 0 GPa at temperatures from 0 K to 1000 K in increments of 100 K, from 1300 K to 2700 K in increments of 300 K, and at 2900 K. Optimise Gibbs free energy was selected under Optimisation opts.
MD GULP was executed on a 32 unit MgO cell using ensemble NPT at temperatures 100 K, 300 K, 500 K, 800K, 1000 K, 1300 K, 1500 K, 1800 K, 2100 K, 2400 K, 2700 K and 2900 K at 0 GPa. Time step was set to 1 fs. Equilibration steps and production steps were set to 500 and sampling steps and trajectory write steps were set to 5.
For all calculations, ionic.lib was selected and Include Shells was not selected under General opts.
Results and Discussion
The Phonon Dispersion Curve and Density of States
The phonon dispersion curve shows six branches, as expected using eq. 4, where N and s are 2 and 3 respectively (Figure 2). There are three acoustic branches, one for each x y z direction in three dimensions. These branches correspond to the atoms vibrating in phase in the long wavelength limit (centre of Brillouin zone). The other three branches are optical branches, corresponding to adjacent atoms vibrating out of phase in the long wavelength limit.
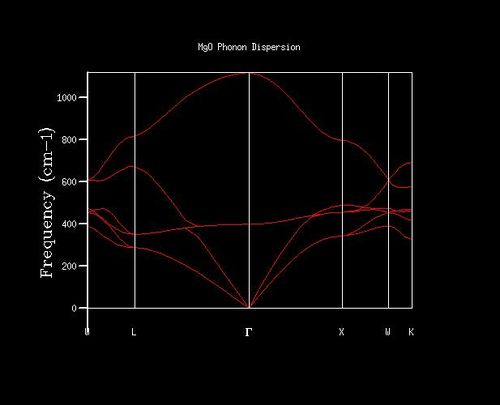
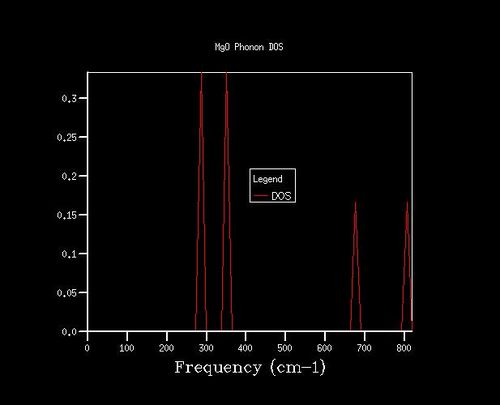
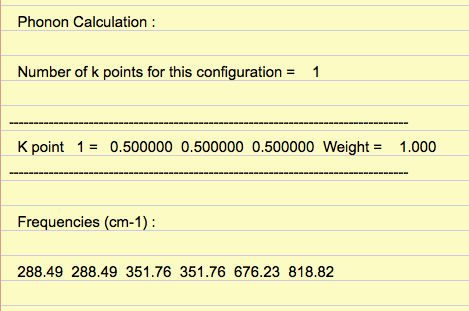
Density of states (DoS) plot shows the number of vibrational states at a particular frequency and was computed for ten grid sizes from 1x1x1 to 40x40x40. The larger the grid size, the more k-points are sampled in the reciprocal space to compute the DoS. For a 1x1x1 grid size, the DoS was computed for one k-point, in which four peaks are observed (Figure 3). L on the phonon dispersion curve is the k-point sampled for the 1x1x1 grid size, as the phonon dispersion curve shows that L has two degenerate bands at around 300 cm-1 and 350 cm-1, and two bands at around 700 cm-1 and 800 cm-1, which match those in the DoS (Figure 2 and 3). From the out file, the frequencies at a = 0.5, corresponding to point L, further confirm this, as it shows two degenerate frequencies and two non-degenerate frequencies (Figure 4).
Quasi Harmonic Approximation Calculations
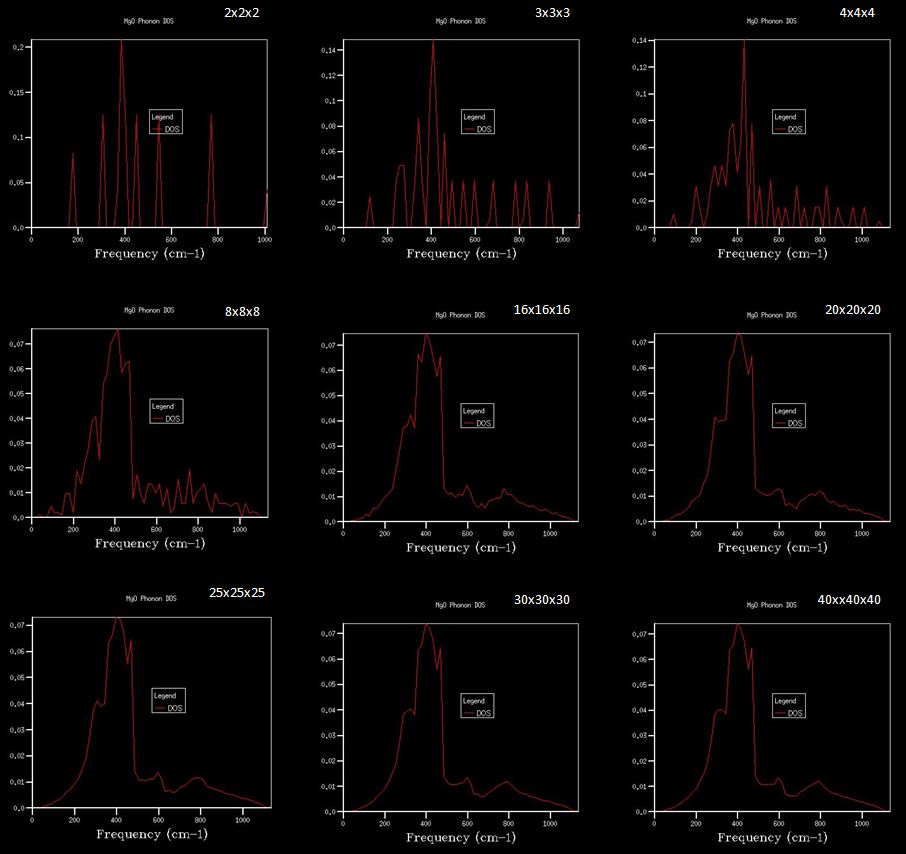
For the QHA calculations on the MgO primitive cell, the optimal grid size was determined by observing how the Helmholtz free energy changes with grid size at 300 K (Table 1). A grid size of 3x3x3, 4x4x4 and 4x4x4 gave a free energy accurate to 1 meV, 0.5 meV and 0.1 meV respectively. The free energy converges to -40.926483 eV at a grid size of 20x20x20 and hence this grid size was used for the QHA calculations as a larger grid size would not give more accurate data and will also take longer to run. The DoS plots obtained using different grid sizes also reflects this; the plots change from distinct peaks to smoother curves as the grid size increases from 1x1x1 to 20x20x20, and little change is observed when the grid size increases from 20x20x20 to 40x40x40 (Figure 5).
| Grid Size | Helmholtz Free Energy/ eV |
|---|---|
| 1x1x1 | -40.930301 |
| 2x2x2 | -40.926609 |
| 3x3x3 | -40.926432 |
| 4x4x4 | -40.926450 |
| 8x8x8 | -40.926478 |
| 16x16x16 | -40.926480 |
| 20x20x20 | -40.926483 |
| 25x25x25 | -40.926483 |
| 30x30x30 | -40.926483 |
| 40x40x40 | -40.926483 |
The optimal grid size is dependent on the size of the unit, so the same grid size as for MgO would be suitable for a similar oxide such as CaO. However for a smaller unit such as a metal, a bigger grid size would be needed. The reciprocal lattice is the region where 0 ≥ k ≤ π/a, and the reciprocal lattice parameter a* is related to the lattice parameter a by,
a* = 2π/a eq. 5
For a smaller unit, the lattice constant a is smaller and hence the reciprocal lattice parameter a* will increase. A larger number of k-points would therefore be required to compute an accurate free energy. The opposite is true for a larger unit hence a smaller grid size is suitable.
Using a grid size of 20x20x20, the Helmholtz free energies obtained from the QHA calculations from 0 K to 1000 K were plotted against temperature (Figure 6).
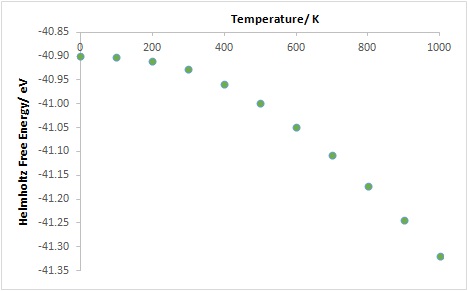
At temperatures below 200 K, the graph plateaus. This is because at low temperatures the entropy is close to zero. Furthermore the internal energy does not increase much with temperature and the zero point energy is constant, meaning that the free energy does not increase much as the temperature increases. At high temperatures there is a significant contribution to the free energy from the entropy due to increased vibration of the ions, and the free energy decreases (becomes more negative) as entropy increases with temperature. The same is reflected in the plots of conventional lattice constant and conventional cell volume against temperature (Figure 7 and 8). The conventional lattice constant ac and the conventional cell volume Vc were obtained from the primitive lattice constant ap and the primitive cell volume Vp using eq. 6 and eq. 7 respectively.
ac = (2ap)/21/2 eq. 6
Vc = 4Vp eq. 7

| Temperature/ K | Primitive Cell Volume/ Å3 | Conventional Cell Volume/ Å3 |
|---|---|---|
| 0 | 18.836496 | 75.345984 |
| 100 | 18.836494 | 75.345976 |
| 200 | 18.856202 | 75.424808 |
| 300 | 18.890025 | 75.560100 |
| 400 | 18.932508 | 75.730030 |
| 500 | 18.980112 | 75.920448 |
| 600 | 19.031223 | 76.124892 |
| 700 | 19.085059 | 76.340236 |
| 800 | 19.141318 | 76.565272 |
| 900 | 19.199640 | 76.798560 |
| 1000 | 19.260044 | 77.040176 |

From the linear region of the plot of conventional cell volume against temperature, the volumetric thermal expansion coefficient was calculated to be 29.050562 x 10⁻⁶ K-1 using eq. 1, where Vi, the initial volume, is taken to be 75.730030 Å3 (Table 2; Figure 8). This is divided by 3 to give the linear thermal expansion coefficient value of 9.683521 x 10⁻⁶ K-1. This differs from the literature value of 12.11 x 10⁻⁶ K-1 measured at 400 K by 20.0 %, suggesting that the QHA calculation is reasonably reliable.1
Molecular Dynamics Simulation
MD simulations were carried out at temperatures from 100 K to 2900 K using a supercell consisting of 32 MgO units. Although a 32 MgO unit cell was used, the optimal cell size can be decided by running calculations at increasing cell size until the total energy converges. The cell size at which the energy converges would be suitable to use to obtain reliable results. A cell size of 32 was used to compromise between obtaining reliable results and running reasonable time calculations.
| Temperature/ K | Supercell Volume/ Å3 | Conventional Cell Volume/ Å3 |
|---|---|---|
| 100 | 599.513295 | 74.939162 |
| 300 | 602.899441 | 75.362430 |
| 500 | 606.322864 | 75.790358 |
| 800 | 612.102518 | 76.512815 |
| 1000 | 615.635320 | 76.954415 |
| 1300 | 621.486358 | 77.685795 |
| 1500 | 625.156025 | 78.144503 |
| 1800 | 629.245026 | 78.655628 |
| 2100 | 634.020778 | 79.252597 |
| 2400 | 644.233446 | 80.529181 |
| 2700 | 647.949319 | 80.993665 |
| 2900 | 650.763352 | 81.345419 |
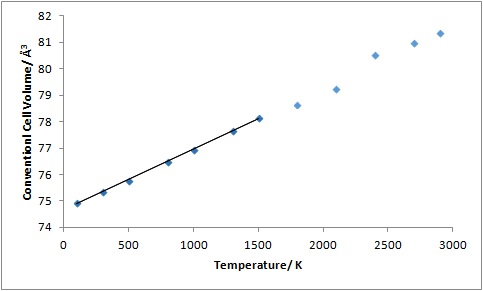
The supercell volumes obtained from the MD calculations were converted to the conventional cell volumes using eq. 8 and were plotted against temperature (Table 3; Figure 9). Using this plot, the volumetric thermal expansion coefficient was calculated to be 30.691563 x 10⁻⁶ K-1 using eq. 1, where Vi is taken to be 74.939162 Å3. This value was converted to the linear thermal expansion coefficient to give 10.230521 x 10⁻⁶ K-1. This value differs from the literature value of 12.11 x 10⁻⁶ K-1, measured at 400 K, by 15.5 %, suggesting that the calculation is reasonably reliable.1
Vc = Vsupercell/8 eq. 8
Comparison between QHA and MD
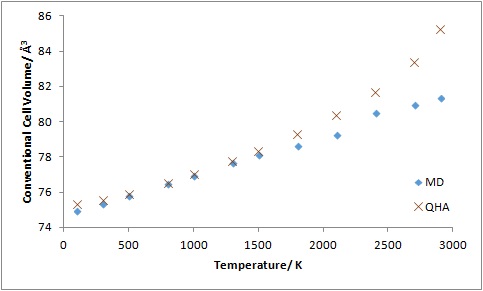
At temperatures between 400K and 1500 K, both QHA and MD calculations produce similar results with a linear relationship between the conventional cell volume and temperature (Figure 10). At low temperatures experimental results show that the cell volume is independent of the temperature.2 This is shown in the plot of cell volume against temperature using QHA but the same plot using MD shows a linear relationship in this region. This is because MD does not take into account quantum effects that are especially significant at low temperatures.2
At high temperatures, MD fits the experimental data more than QHA as quantum effects become less significant and anharmonicity becomes more important.2 Near the melting point of MgO (3250 K) it is expected that some bonds will break and the cell volume will start to increase much more as the ions vibrate more.3 The cell volume should therefore increase away from linearity near the melting point and this is observed in the plot using MD. The cell volume also increases away from linearity in the plot with QHA, but it starts to increase away from linearity much earlier at 1800 K, 1450 K below the melting point of MgO. The increase in cell volume above 1800 K is also much larger with QHA compared to that with MD. Although QHA includes some anharmonicity, it does not predict the breaking of bonds. Therefore it does not represent the actual motion of ions well at high temperatures. With MD, charged ions are studied and the distance between the ions are not restricted like in QHA.
There is not a large difference between the linear thermal expansion coefficients obtained using MD and QHA. However the MD value is slightly closer to the literature value. The thermal expansion coefficient is obtained from the gradient of the linear region, and this linear region is at higher temperatures where the anharmonicity becomes more important and quantum effects become less significant.2 Hence MD models the ions better in this region and gives a value closer to the literature value.
Conclusion
The linear thermal expansion coefficient of MgO obtained using QHA and MD are 9.683521 x 10⁻⁶ K-1 and 10.230521 x 10⁻⁶ K-1 respectively. These values differ from the literature value of by 20.0 % and 15.5 % respectively, suggesting that both methods model the actual motion of the ions reasonably well. Both anharmonicity and quantum effects are important in modelling the motion of the ions, but MD does not take into account quantum effects and QHA only includes some anharmonicity.2 This can explain the difference between the literature value and the thermal expansion coefficients obtained. The value obtained using MD is slightly closer to the literature value compared to the value obtained using QHA. This is because the thermal expansion coefficient was obtained from the gradient of the conventional cell volume against temperature plot at higher temperatures, and in this region MD models the ions better than QHA.
References
1. A. S. Madhusudhan Rao, K. Narender, J. Chem. Thermodyn., 2014, 2014, 1-8.
2. R. G. Della Valle, E. Venuti, Phys. Rev. B, 1998, 58, 206-212.
3. C. Ronchi, M. Sheindlin, J. Appl. Phys., 2001, 90, 3325-3331.
