Rep:Schlosskat
Report By Melissa Chan, 00554846
Introduction
In this module, the transition states of 2 specific reactions, the Cope rearrangement and Diels-Alder reaction are optimised using various methods (e.g. Hartree Fock/3-21G and Semi-Empirical/AM1) are employed to located the transition state for optimisation. The Schrodinger equation is numerically solved using these computational methods, which is then expected to lead to the structure of a transition state based on the shape of a potential energy curve.
Cope Rearrangement
Optimisation of Reactants and Products
The Cope Rearrangement of 1,5 hexadiene is studied here, where the [3+3] sigmatropic pericyclic reaction causes the migration of one group from a certain point of attachment to another. Here, a σ bond is formed and broken at the same time. where the transition state structure of the diene is located on the potential surface of the diene, allowing for the proposal of a reaction mechanism.
Optimisation Using Hartree-Fock, 3-21G
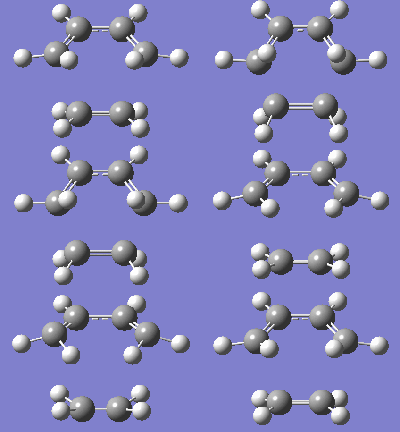
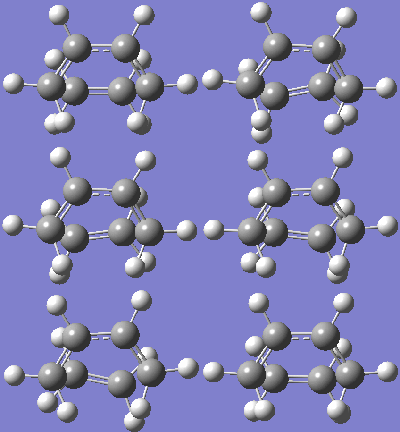
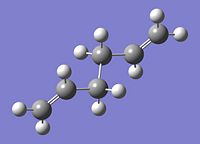
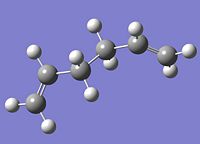
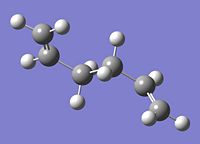
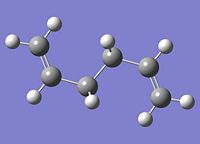
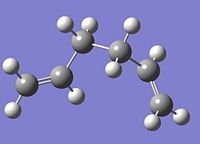
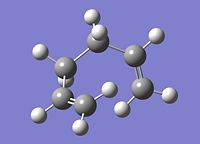
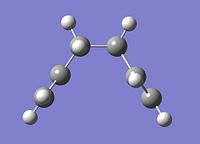
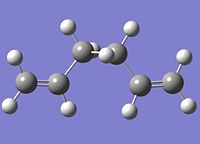
In the following exercise, the anti conformation of 1,5-hexadiene was first optimised using the HF/3-21G method. Following the instructions, the symmetry of the conformation was found using the symmetrize function found on GaussView5. The energies and point group were then recorded. This was also carried out on the gauche conformers, and the relevant values recorded.
| Entry | Name | Diagram | .Mol file | Energy/a.u. | Point Group | Log File | |||
|---|---|---|---|---|---|---|---|---|---|
 |
|
||||||||
 |
|
||||||||
 |
|
||||||||
 |
|
||||||||
 |
|
||||||||
 |
|
||||||||
 |
|
||||||||
 |
|
From the table above, it can be observed that some of the gauche conformers are actually more stable than the anti conformers. This observation is contrary to the general experimental observation that gauche conformers are more unstable than anti conformers due to the higher occurence of steric repulsions present in the gauche conformer. From table 1, the gauche conformer in entry 5 is the most stable, and this stability can be accounted for by the presence of a stereoelectronic effect due to a C-H π interaction, which consists of a donation of electrons from the C=C π orbital to the C-H σ* orbital. This leads to the conclusion that steric repulsion is definitely not the only contributing factor to the stability of a conformer.
Comparison of the HF and DFT methods (Anti-1)
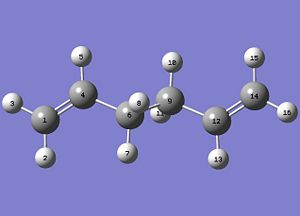
Two different methods were run for the anti conformer seen in table 1. In table 3, the comparison of the both the HF and DFT methods show that there is a small difference in the geometries of the molecules from the two methods, however, the total energies obtained from the two methods proved to be very different. This could be due to the longer C=C bond length found using the DFT method, which indicates a lower bond order and also an increased dihedral angle between the indicated carbon atoms. This could contribute to the lowered final energy of the observed conformer in that a higher accuracy in the geometry of the diene could have been obtained with the DFT method, which is a higher optimisation method. The advantage of using the higher optimisation method is a longer and more costly computational time as compared to using the HF/3-21G method.
| Method | Energy | C=C bond length/Å | C1-C4 Dihedral Angle*/o | Literature[1] | Diagram |
|---|---|---|---|---|---|
 | |||||
Comparison of the Thermochemistry for HF and DFT Methods (Anti-1)
The thermochemistry of the HF and DFT methods at different temperatures were calculated for the anti conformer found in table 1. The four particular sums of energies consist of the particular components:
- Sum of electronic and zero-point energies: E = Eelec + ZPE (Potential Energy at 0K, including the zero-point vibrational energy)
- Sum of electronic and thermal energies: E = E + Evib + Erot + E trans (energy at 298.150K and 1.0 atm)
- Sum of electronic and thermal enthalpies: H = E + RT (where RT is an additional correction term necessary for the analysis of dissociation reactions)
- Sum of electronic and thermal free energies: G = H - TS (entropic contribution to free energy)
At 0K, all energies should be similar as due to the lack of thermal contribution and hence the values obtained for the energy consists mainly of the zero-point energy and electronic energies. The energies at 0K are much lower than those at 298.15K, which is as expected as an increase in temperature would result in a greater energetical contribution from the translational, rotational and vibrational modes.
| Type of Energy | DFT/B3LYP (6-31G) at 0K | DFT/B3LYP (6-31G) at 298.15K | HF (3-21G) at 0K | HF 3-21G at 298.15K |
|---|---|---|---|---|
Optimisation of the Transition States
In this section, different methods were utilised to construct the chair and boat transition states. For the chair transition state, two different methods were used; namely the usage of redundant coordinates (TS/Berny) and the use of TS/Berny only. For the boat transition state, the QST2 method was used.
Chair Transition State
Optimising the Chair Transition State
The chair transition state was first constructed as instructed in the directions provided. An allyl fragment was initially optimised as half the chair transition state is expected to possess one allyl fragment. Two allyl fragments were then conbined to form the initial chair transition state.
Table 4 shows the comparison of values obtained from the utilisation of the two different methods for the optimisation of the chair transition state. The force constant was initially calculated with the TS/Berny method, whilst for the TS/Berny method using the redundant coordinates, the frozen coordinates function was first used (frozen at a bond distance of 2.2Å) and optimised to a minimisation, followed by a derivative of the bond using the same redundant coordinates function to optimise to a transition state. Both these methods used the HF/3-21G method-basis set.
| TS (Berny) | TS (Berny) with Redundant Coordinate | |||||||
|---|---|---|---|---|---|---|---|---|
|
| |||||||
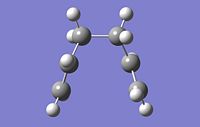
From table 4, both values obtained through different calculations gave highly similar values, and the final optimised energy. These differences can be assumed to be trivial as the Gaussian calculations are not highly accurate and most of the final decimal places on the values shown above can be rounded up to give a small or negligible energy difference. Additionally, the imaginary frequencies obtained for both methods are also very similar at 818cm-1. This motion is shown in the diagram below:
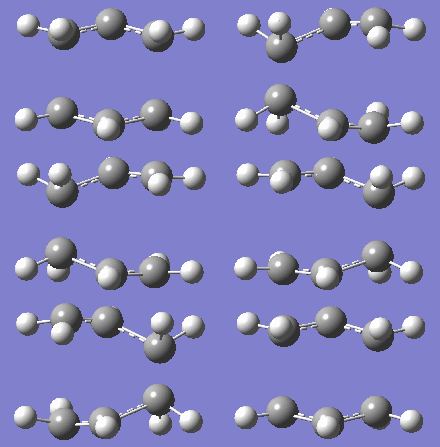
This motion demonstrates the asynchronous movement causing the breaking and formation of the bonds in the concerted [3+3] sigmatropic pericyclic reaction Cope rearrangement.
Following the reaction pathway (IRC)
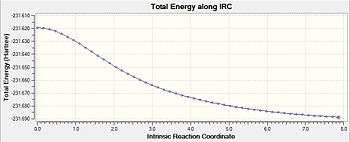
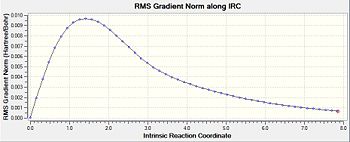
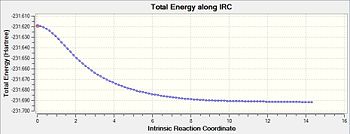
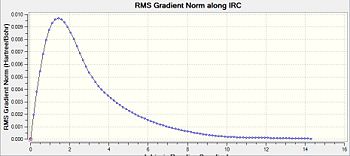
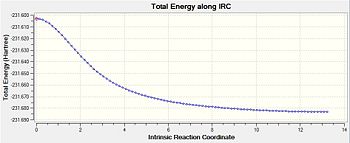
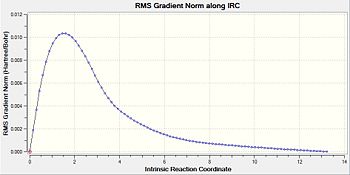
Following the optimisation, the reaction pathway was followed using the IRC calculation. In this calculation, different conformers of the 1,5-hexadiene, some of which are found in table 1, are connected to the transition structure optimised in the section above. This particular IRC calculation was carried out in the forward direction with 50 steps for calculation number 1. In the second calculation, the number of steps was increased to 150 in order to see whether the minimum geometry had been reached in the first calculation. From table 5, the second calculation did serve to find a minimum geometry that was much more optimised compared to that seen in the first geometry.
| Calculation Number | Energy/a.u. | Diag for IRC Path | Diag for RMS | Structure after IRC Run |
|---|---|---|---|---|
 |
 |
 | ||
 |
 |
 |
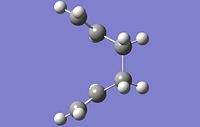
For an IRC to have reached the minimum geometry, the path would have to undergo a plateau which means that it has reached an RMS gradient of zero. From entry 2, it can be observed that the IRC has indeed reached a minimum close to zero, which allows for the use of the IRC calculations to draw a link between the transition state and a conformer whose energy and geometry highly resembles that calculated by the IRC. In this case, the conformer that the calculations from the IRC has obtained resembles gauche-3, found in table 1. Comparing their energies, the energy obtained from the IRC calculation, -231.69166a.u. is very close to the optimised conformer gauche-3, at -231.69167a.u..
Boat Transition State
Optimising the Boat Transition State
The boat transition state is now optimised using the QST2 method. This method requires the reactant and product to be specified because in this method Gaussian interpolates between the reactant and product structure to locate a transition structure that has a geometry in between the structures of the reactant and product. In the first run, the calculation failed and this led to the need for a change in the geometry of the reactant and product. In addition, it must be noted that the numbering of the atoms were highly important, leading to the success or failure of the job run.
| TS (QST2) | ||||
|---|---|---|---|---|
| ||||
On a cursory observation, the total energy of the boat transition is higher than that of the chair transition structure. This is in line with the general observation that this will indeed happen due to an increased occurrence of steric hindrance. This also leads to a higher activation energy for the boat transition state compared to the chair transition state. Further elaboration will be given in later sections. The imaginary frequency seen for this frequency at 840cm-1 shows the concerted formation and breaking of the bond, like that of the Cope rearrangement.
Following the Reaction Pathway (IRC)
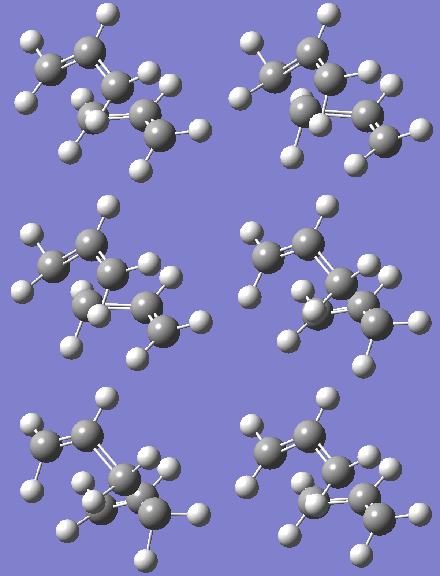
Like that for the chair transition structure, the reaction pathway was also followed using 150 steps, with the force constants always being calculated. The geometry seen in the diagram provided resembles gauche-3 (table1 1) but the energy found from this IRC calculation is at -231.68302a.u. whilst for the original gauche-3 conformation it has a minimum energy of -231.69166a.u.. This disparity could be due to a slight difference in the starting transition structure, which lead to this final energy.
| Calculation Number | Energy/a.u. | Diag for IRC Path | Diag for RMS | Structure after IRC Run |
|---|---|---|---|---|
 |
 |
 |
Optimising using DFT/B3LYP for Activation Energies
Following this, the chair and boat transition structures were optimised again using a different method and basis set. The activation energy was calculated by subtracting the sum of electronic and thermal free energies for the chair and boat transition structures with the anti-1 structure obtained. These values were then compared to literature values.
| Method and Basis Set | B3LYP/6-31G | HF/3-21G | Literature | Log Files | |
|---|---|---|---|---|---|
From the values obtained, it can be seen that the values obtained computationally are closer to the calculations from the DFT/B3LYP level of theory. The activation energy for the DFT/B3LYP has been underestimated for the boat transition, whilst it is well within the range of values for the chair transition. Additionally, the activation energy values obtained for the boat transition state is higher than the chair transition state. This is in line with theoretical conclusions, as the chair transition is more stable as it has lesser steric repulsions due to its staggered conformations. For the boat transition state, it experiences greater steric repulsions and hence there are more strains in the system, leading to a less stabilised system.
Diels-Alder Cycloaddition
In this section, a prototypical reaction between butadiene and ethylene is first studied, and then the reaction between 1,5-hexadiene and maleic anhydride is subsequently studied. The Diels-Alder reaction is a concerted reaction between the terminal C=C of a diene and a C=C double bond, also known as a dienophile. The following computational calculations are carried out to observe the transition structures, which will lead to the most stable major product.
Optimisation of Cis-Butadiene and Ethylene
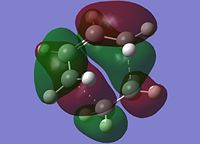
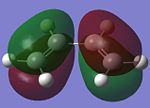
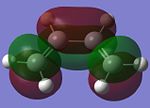
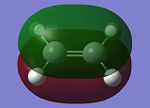
Butadiene and ethylene are individually optimised in order to attain its HOMO and LUMO with the use of a semi-empirical/AM1 method. They are shown in the table below.
| Molecular Orbital (MO) | Cis-Butadiene HOMO | Cis-Butadiene LUMO | Ethylene HOMO | Ethylene LUMO |
|---|---|---|---|---|
 |
 |
 |
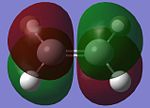 | |
The symmetry of the MOs can be ascertained by observing whether a plane of reflection is valid in the diagrams above. From the table above, the symmetry of the MOs are appropriately shown according to the method that has just been mentioned. Observing the energy differences between the MOs will lead to the conclusion that the LUMO of the butadiene and HOMO of ethylene are the closest in energy. However, it is the HOMO of the butadiene and LUMO of the ethylene that leads to the HOMO of the transition state.
Optimisation of the Transition State
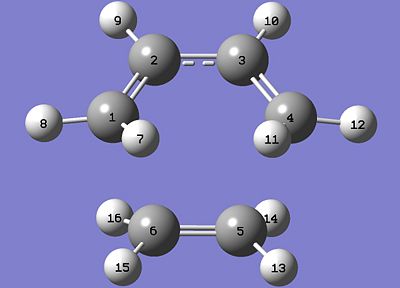
The transition states were optimised using the TS/Berny with an initial guess. The guess structure was constructed by building a bicyclosystem, and then optimising this structure using the semi-empirical/AM1 level of theory. The two desired reactants were then formed using only the redundant coordinates method to give the following results seen in the table below.
| Optimisation Method | Using Frozen Coordinates | Using Derivatives |
|---|---|---|
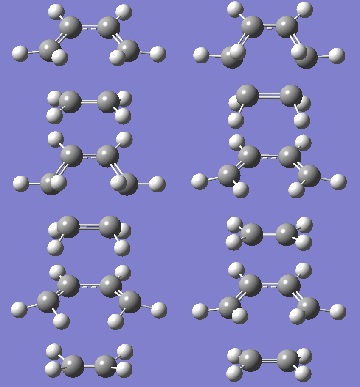 | ||
The vibrational mode of the final structure obtained is synchronous with reference to the ends of the diene and dienophile. This implies that there is concerted bond formation between the ends of the terminal carbons, forming the desired product.
The geometry of the transition state was then examined and compared to literature[3]. A common sp3 hybridised C-C has a bond length of 1.54Å whilst a sp2 hybridised C-C has a length of 1.34Å. In comparison, the length of the C-C bond in the transition state (C5-C6) is at 2.12Å. This is significantly longer than a common C-C bond of 1.54Å but it should be noted that this length is shorter than a comparison to the VDW radius of a carbon atom, at 1.70Å[4]. Therefore, this intermediate bond can be said to be in the process of formation.
Molecular Orbital Analysis
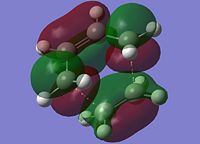
Following this, the MOs of the transition state was analysed and presented in the table below. A cursory observation of the shape of the MOs leads to the conclusion that the HOMO of the transition state is not symmetrical as compared to its LUMO, which is symmetrical. The HOMO also exhibits significant bonding between the terminal carbons which suggests that a bond is indeed being formed between these specific carbons.
The HOMO of the transition state reflects the movement of electrons in the Diels-Alder reaction. In this system, this reaction is allowed as the conditions and number of electrons gives the final product, cyclohexene. The conditions fulfilled are that there are a total of 6π electrons, a supposed themral conditions (due to a change in temperature from 0K to 298.15K), which leads to the reaction proceeding under Huckel topology, leading to a product with suprafacial components. The orbitals involved, which can be seen in the optimisation of the reactants at the beginning of the Diels-Alder section of this report, causes the formation of bonds over the similar faces of the π systems of both starting materials.
Vibrational Analysis
The vibrational analysis of the transition state shows clearly the concerted formation of bonds in the Diels-Alder cycloaddition reaction.
Activation Energies of the Reaction
The following table shows the calculated activation energies have been found using the same method as mentioned in section 3.2.2.2. The transition state was then optimised at a higher level of theory at DFT/B3LYP(6-31G). It is useful to note, as is observed in section 3.2.2.2 that the energies obtained for the different level of theories are quite different, but these energy values are not definite, but the difference between these values are useful because it allows for the analysis of the types of method used. From where it can be deduced which levels of theories are more accurate, as compared between the AM1 and B3LYP methods here.
| Method/Level of Theory | Butadiene and Ethylene | Transition State | Log Files | |
|---|---|---|---|---|
| DFT.log | ||||
The Reaction between Maleic Anhydride and Cyclohexa-1,3-diene
Optimisation of the reactants
In this section, the reaction between maleic anhydride and 1,5-hexadiene is studied, and this study begins with the optimisation of the two starting reactants.
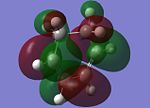
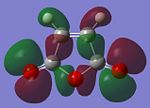
| Molecular Orbital (MO) | 1,5-hexadiene HOMO | 1,5-hexadiene LUMO | Maleic Anhydride HOMO | Maleic Anhydrode LUMO |
|---|---|---|---|---|
 |
 |
 |
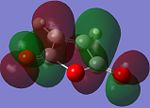 | |
The optimisation of the reactants resulted in the MOs seen in the table above, and all of them are asymmetric with respect to a plane perpendicular to the screen of the computer.
Optimisation of the exo and endo transition state
The exo and endo transition states were optimised using 3 different methods: the first using the TS(Berny) at the semi-empirical AM1 level of theory, the second using the TS(Berny) with the redundant coordinates function at the semi-empirical AM1 level of theory, and the third optimising using TS(Berny) at the DFT/B3LYP(6-31G) level of theory. These three methods resulted in highly similar results, shown in the table below.
| Energies | Semi-Empirical/AM1 (TS Berny) | Semi-Empirical/AM1 (TS Berny/Redundant Coord) | B3LYP/6-31G | |||
|---|---|---|---|---|---|---|
From the table above, the general observation that the endo transition state is more stable than the exo transition state. This stability indicates the favouring of the endo transition state due to its extra stability and hence making it the endo product the major product.
Vibrational Analysis of the 2 transition states
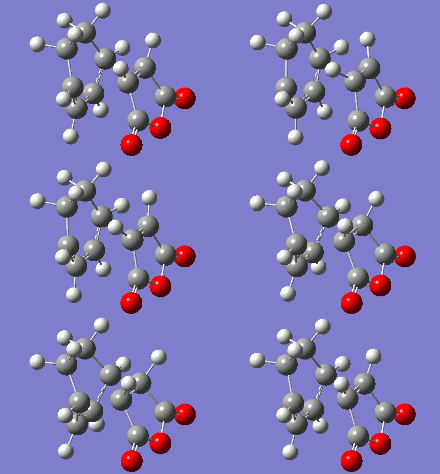
The vibrational analysis of the imaginary frequencies of the transition state optimisations have resulted in the following vibrations observed in the following table:
| Conformer | Endo | Exo |
|---|---|---|
 |
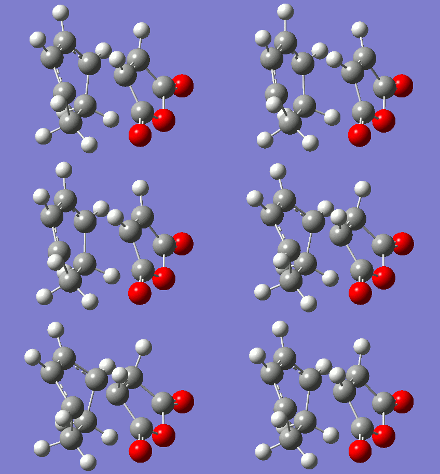 |
Both these vibrational modes, which look highly similar, demonstrate the concerted formation of σ bonds in the Diels-Alder reaction, which is a synchronous process.
The geometry of the transition state
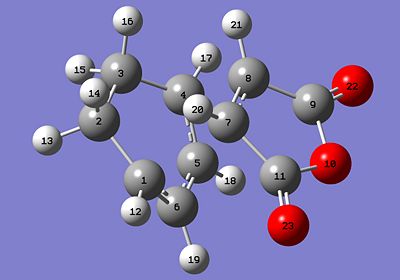
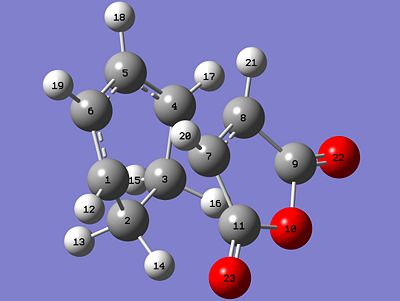
From the table above, it can be observed that the bond forming and breaking lengths are similar at a length of 2.16Å. This means that the bonds form at the same lengths, leading to the concertedness of its bond formation. Additionally, for the endo state the C=C bonds involved in the Diels-Alder reacton measure at 1.40Å, consistent with the concerted formation of bonds, as the C=C bonds in maleic anhydride and 1,5-hexadiene break simultaneously to form the bonds also at the same time.
Now, for the endo transition state the through-space distance between the C6 to C11 atoms is much smaller at 2.89Å compared to the through-space distance found for the exo transition, 2.95Å between C2 to C11. This implies that there should be a greater steric repulsion found in the endo transition state, but this is not the case as seen in the energy levels of the endo transition state. There could therefore be other interactions such as secondary orbital interactions that lead to increased stability.
Molecular Orbital Analysis of the endo and exo transition state
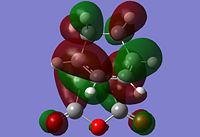
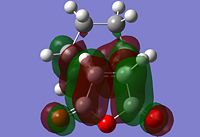
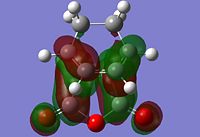
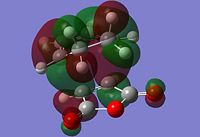
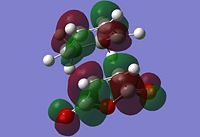
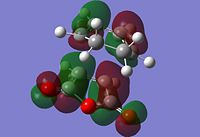
The table below shows the MOs of the HOMO and LUMO diagrams of the two conformers.
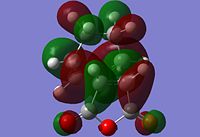
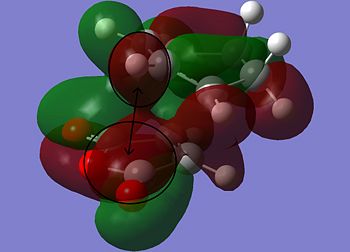
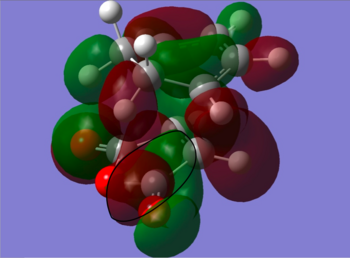
The information shown in the table above depicts the bonding on the HOMO and LUMO levels for both conformers, but do not give a conclusive reason for the extra stability found in the endo conformer. As a result, a search of the HOMOs for the endo product reveals that a secondary orbital interaction exists for the C-H σ* orbital and the orbitals on the side groups of the alkene in the HOMO-12 of the endo conformer. This leads to an orbital mixing which causes its increased stability. The diagram below demonstrates the orbital interaction as described. In contrast, the HOMO-12 orbital of the exo conformer does not have the other secondary interaction with the forming C-C σ bond, compared to the interaction found on the endo conformer. The first image containing the endo conformer has circles drawn and an arrow connecting them to emphasize the secondary interaction which leads to extra stability. The second image containing the exo conformer has a circle drawn to emphasize the lack of interaction within the maleic anhydride ring for enhanced stability. Additionally, from section 3.3.3.4 the distance between both reactants, atom C6 to C11 for the endo and C2 to C11 for the exo conformer, the smaller distance observed in the endo conformer suggests that the secondary interaction is much stronger than the interaction observed in the exo conformer.
The stabilisation between the C-H σ* orbital on the diene and orbitals of the side groups of the alkene has been described in literature[5]. This description of the interaction could be applied to the Diels-Alder reaction studied in this section. Imade and co-workers described the orbital interaction of the orbitals of the diene not directly involved in the bond formation with the sidearms belonging to the alkene. In the particular study, the alkene of interest was cyclopropene. This secondary orbital interaction was only found in the endo transition state, but not the exo transition state. The other interaction as mentioned in the previous paragraph was described also in literature by Salvatella and co-workers[6]. The diagram below describes the extra orbital stabilisation found in the endo conformer, and the third diagram from the left depicts the description reported by Imade and co-workers[5].
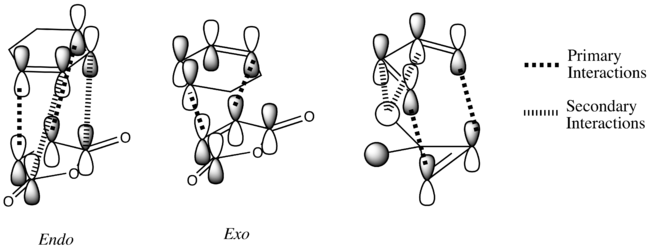
The reactivity in the Diels-Alder reaction varies according to several factors like stereoelectronics, steric strain in the system and transition state, and regioselectivity in the reaction. In the calculations carried out for the location of the transition state, the results obtained were very much dependent on how the initial transition state was drawn. As a result, the steric strain that are found in the calculations may or may not be true to experimental findings.
Conclusion
The use of Gaussian for computational experiments allows for a variety of calculations for different purposes. In the above exercises the focus of the Gaussian calculations are on the prediction of transition state structures. These calculations allows for the prediction of a major product of a particular reaction (e.g. Diels-Alder reaction) from the analysis of the molecular orbitals, energy levels, geometry of the transition state structure and vibrational modes. Additionally, if the reaction has different major products under different conditions like thermodynamic and kinetic, the computational calculations could allow for the rationalisation of why these products are synthesised in larger excess under the specific conditions. These calculations can be validated against literature values to ensure that the conclusions drawn from the computational exercises are logical and corresponds to experimental findings. For these calculations, the experimental values correspond well to the calculated values and can therefore be considered to be valid. In addition, the use of the Intrinsic Reaction Coordinate (IRC) allows the path of the reaction to be monitored, and from here the reactions studied - concerted pericyclic reactions - could be better understood.
References
- ↑ G. Schultz, I. Hargitta, J. Mol. Struc., 1995, 346, 63-69 DOI:10.1016/0022-2860(94)09007-C
- ↑ 2.0 2.1 M.J. Goldstein, M.S. Benzon, J. Am. Chem. Soc., 1972, 94, 7147 DOI:10.1021/ja00775a046
- ↑ M. J. S. Dewar and H. N. Schmeising, Tetrahedron, 1960, 11 DOI:10.1016/0040-4020(60)89012-6
- ↑ A. Bondi, J. Phys. Chem., 1964, 68, 441 DOI:10.1021/j100785a001
- ↑ 5.0 5.1 5.2 M. Imade, H. Hirao, K. Omoto and H. Fujimoto, J. Org. Chem., 1999, 64, 6697-6701 DOI:10.1021/jo990440c
- ↑ . I. Garcia, J. A. Mayoral, L. Salvatella, Acc. Chem. Res., 2000, 33, 658 - 664 DOI:10.1021/ar0000152

