Rep:Sb6014 TS 2017
For a given molecule, each geometry of said molecule will have an associated potential energy. Since geometry changes in a continuous fashion, the potential energy is also expected to change smoothly. This is the origin of a potential energy surface (PES). Wale (ref) states that the PES represents the potential energy of a given system as a function of all the relevant atomic or molecular coordinates. In larger, more complicated molecules where we have several degrees of freedom, all but one or two reaction coordinates are assumed to be held constant or unaffected during the course of measurement.
Minima on the PES are stationary points and represent the positions of reactants and products of the system; they represent the lowest energy of the system, and hence, the system spends most of it's time in these locations. Small displacements from the minima always lead to an increase in energy of the system. When fluctuations are significant, we find the energy of the system can increase to a maximum. Also a stationary point, we find these positions correspond to transition states. The second derivative here is negative; as a consequence we find the frequency calculated at this geometry will appear negative or as an imaginary number, as the force constant used to calculate the frequency is negative. We can use this information to locate and characterise transition states in the following exercises.
How many dimensions are you working in? THE PES in guassian is 3N-6 dimensions. Therefore you answer doe not adequately explain what a TS is.
Exercise 1: Reaction of Butadiene with Ethylene
The [4+2] cycloaddition of butadiene with ethene was investigated. Method 2 was used to locate the transition state and determine the IRC. A frequency calculation on the TS found one negative frequency, corresponding to the energy maxima and transition state. A further IRC confirmed this was the transition structure. Figure 1 shows the reaction scheme, with the concerted formation of two sigma bonds.

Molecular Orbital Diagram
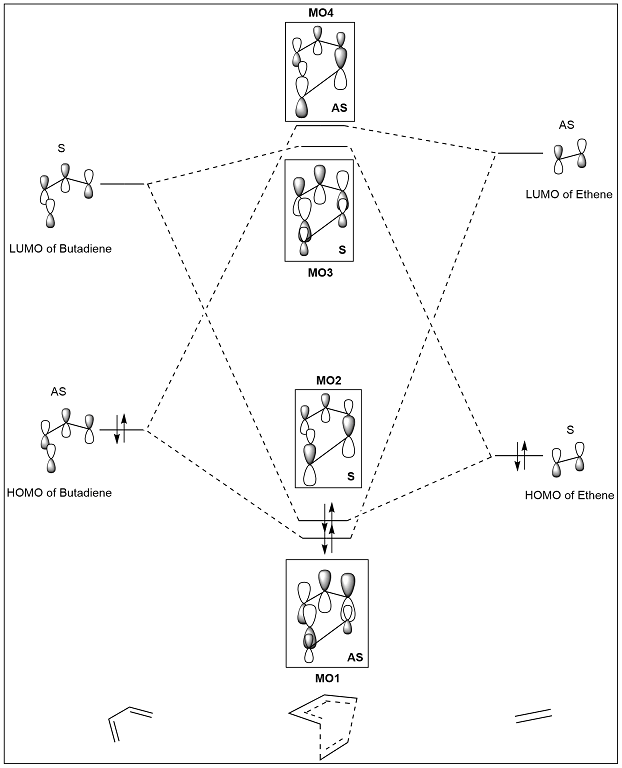
For the molecular orbital (MO) diagram shown in figure 2, the energies of the fragment orbitals (FOs) of butadiene and ethene can be explained qualitatively by considering the number of nodes in the FO; the greater the number of nodes the greater the energy of the FO. Gaussian can also be used to confirm the energies of these FOs. Due to conjugation within butadiene, we expect the HOMO-LUMO gap to be smaller, as is illustrated. The gap in the reacting FOs results in a small splitting between the FOs and MOs. A greater contribution of each FO to the corresponding MO is expected when they are close in energy, as is illustrated.
The MO diagram shows that the FOs involved in a reaction must be of the same symmetry for a reaction to be allowed. The resulting MOs are also symmetric (S) or asymmetric (AS). Therefore a reaction is allowed when the MOs are a) of the same symmetry label b) of similar energies. The orbital overlap integral is zero for symmetric-antisymmetric interactions, due to the presence of equal amounts of constructive and destructive overlap. The orbital overlap integral is non-zero for symmetric-symmetric and antisymmetric-antisymmetric interactions.
|
|

|

| ||||||||||||
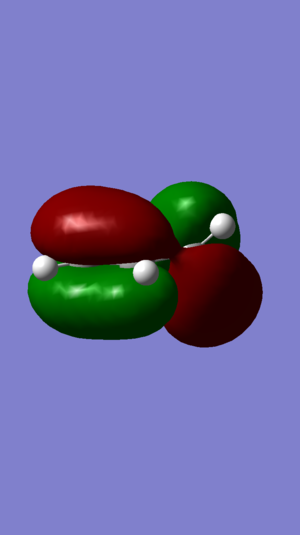
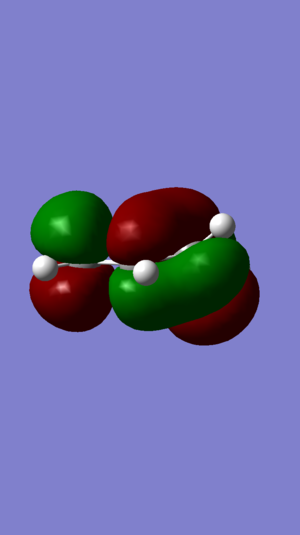
| Figure 3: DIENE HOMO | Figure 4: DIENE LUMO | Figure 5: ALKENE HOMO | Figure 6: ALKENE LUMO | ||||||||||||
|
|
|
| ||||||||||||
|---|---|---|---|---|---|---|---|---|---|---|---|---|---|---|---|
| Figure 7: MO1 | Figure 8: MO2 | Figure 9: MO3 | Figure 10: MO4 |
(Fv611 (talk) The main mistake here comes from your optimisation of the TS. You left the frozen coordinates, which meant you didn't obtain the true TS, and therefore didn't obtain the right MOs. You should have picked up that something was wrong, because MO4 is symmetric when you expected it to be antisymmetric. Additionall, you drew the diagram representation of HOMO-1 as an out-of-phase linear combination, whereas it is the in-phase combination that results in the most stable TS MO.)
Bond Lengths
As the reaction progresses, two sigma bonds are formed, one double bond is formed, and two double bonds are broken. We can observe the change in bond lengths using Gaussian; the bond lengths are tabulated in Table 1 below. Please refer to figure 1 for atom labels.
The typical sp3 C-C bond length is 1.54 A and sp2 C=C bond length is 1.33 A. In the reactants, we find the single bond C2-C3 of butadiene is shorter than expected, due to the conjugation of the molecules. All other bonds are of expected length.
C6-C1 and C4-C5 correspond to the two new sigma bonds to be formed; as the bond lengths match the expected figure of 1.33A for a C-C bond, and we can conclude that these bonds are successfully formed. The corresponding double bonds C1-C2 and C3-C4 elongate from 1.33 A to 1.54 A signifying the change from a double to a single bond.
In the transition state, we expect bond lengths to be of intermediate value between the the Van der Waals diameter and products, showing that geometry is gradually changing towards the products. The Van der Waals radius of carbon is 1.70 A, which means the length of the new sigma bonds must be between 3.4 A and 1.54 A in the transition state; C6-C1 and C4-C5 both have bond lengths of 2.11 A in the transition state, indicating the reactants are close enough for a bond to form.
| Reactant | Transition State | Products | |
|---|---|---|---|
| C1-C2 | 1.335 | 1.380 | 1.541 |
| C2-C3 | 1.468 | 1.411 | 1.338 |
| C3-C4 | 1.335 | 1.380 | 1.541 |
| C4-C5 | n/a | 2.115 | 1.540 |
| C5-C6 | 1.327 | 1.382 | 1.541 |
| C6-C1 | n/a | 2.115 | 1.540 |
Vibration corresponding to reactive path at transition state
Figure 11: Vibration corresponding to reactive path for the Diels-Alder reactive |
Figure 11 shows the vibration corresponding to the reactive path. The frequency shown here is the negative frequency calculated at energy maxima, as explained in the introduction. The stretch is symmetrical and the terminal carbons of both reactants move towards each other at the same time. Therefore, the formation of the two bonds is synchronous.
Exercise 2: Reaction of Cyclohexadiene and 1,3-Dioxole
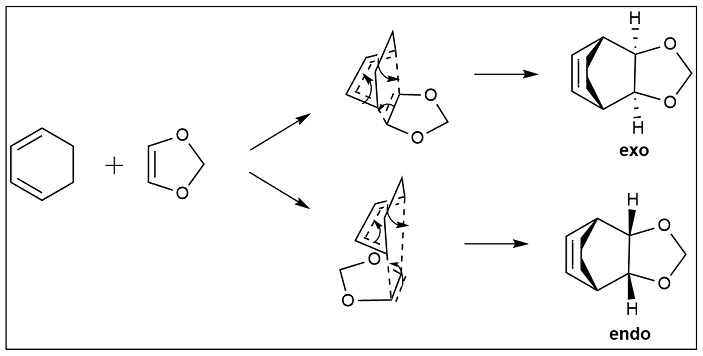
Method 2 was used to locate the transition state and determine the IRC for this reaction.
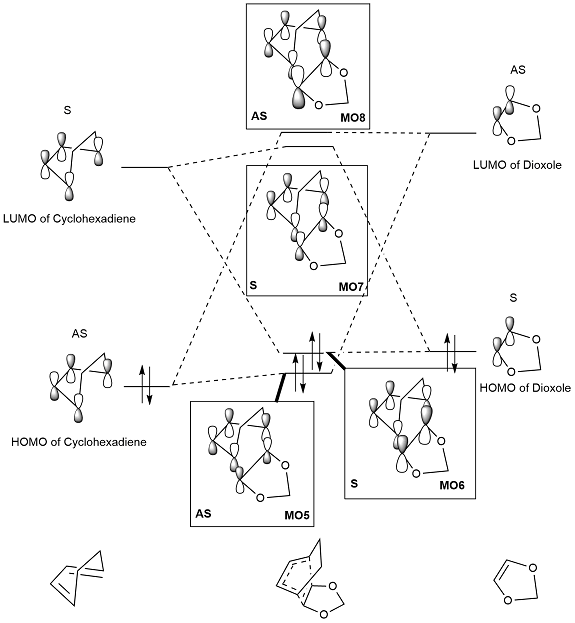
MO diagram
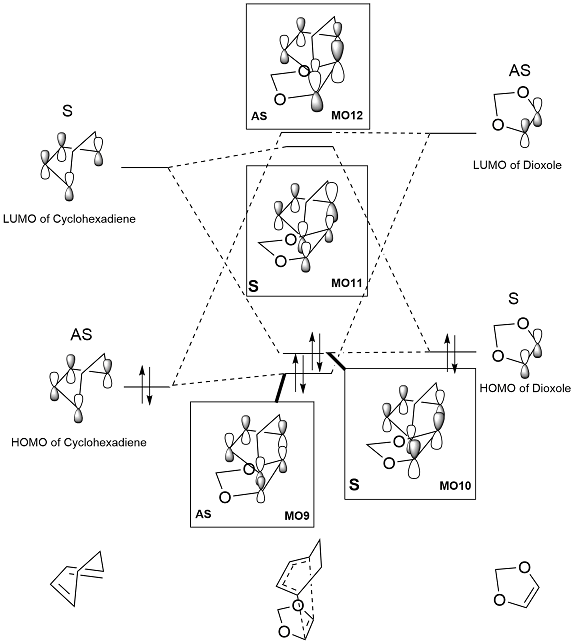
(Fv611 (talk) Very good MO diagrams, well done! Could have commented a little more on what difference there is between the Exo and Endo case.)
|
|
|
| ||||||||||||
|---|---|---|---|---|---|---|---|---|---|---|---|---|---|---|---|
| Figure 14: MO5 | Figure 15: MO6 | Figure 16: MO7 | Figure 17: MO8 |
The MO diagram of the exo product was constructed using the relative energies found from Gaussian. Whilst these energies cannot be used as absolute values, they do indicate the relative placing of MOs in the diagram. We can see in figure 13 that the HOMO of the diene (cyclohexadiene) is lower than the HOMO of the dienophile (1,3 dioxole). This indicates an inverse demand DA reaction, where the greatest orbital interaction is found between the LUMO of the diene and HOMO of the dienophile. The high energy HOMO of the dienophile may be explained by considering the lone pair electrons in the two oxygen atoms of the ring; the electron donating groups raise the energy of the dienophile, thus its MOs lie higher in energy and we see an inverse demand in the reaction.
|
|
|
| ||||||||||||
|---|---|---|---|---|---|---|---|---|---|---|---|---|---|---|---|
| Figure 19: MO9 | Figure 20: MO10 | Figure 21: MO11 | Figure 22: MO12 |
Like the Exo case, the endo case also shows an inverse demand reaction.
Thermodynamic data
| (kJ/mol) | ||
|---|---|---|
| PM6 | B3LYP/6-31G(d) | |
| Cyclohexadiene | 306.855336 | -612593.193227 |
| 1,3-Dioxole | -137.258525 | -701187.43398 |
| Exo TS | 364.689854 | -1313614.286016 |
| Exo product | 99.7099673 | -1313845.77899 |
| Exo reaction barrier | 195.093043 | 166.341191 |
| Exo reaction energy | -69.8868437 | -65.151783 |
| Endo TS | 362.166749 | -1313849.37856 |
| Endo product | 99.26482492 | -1313849.3733 |
| Endo reaction barrier | 192.569938 | 158.480447 |
| Endo reaction energy | -70.33198608 | -68.746093 |
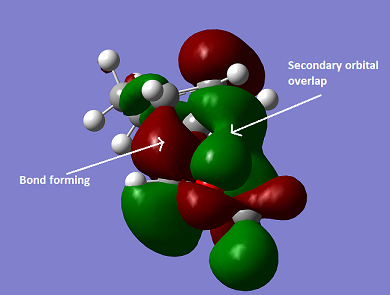
At the PM6 optimisation level, the endo reaction barrier is 2.52 kJ/mol lower than it's exo counterpart (235.09 kJ/mol at 6-31G(d)) This is expected, as we expect secondary orbital interactions between the p-orbitals of the oxygens in the dioxole with the pi-orbitals of the developing pi-bond, as shown in figure 23; this lowers the energy of the transition state, lowering the reaction barrier (activation energy - Ea). Using Arrhenius' relationship between rate and activation energy, we can conclude that the endo product is formed fastest, and kinetically favoured. A similar argument may be made using data from the B3LYP/6-31G(d) optimisation.
The endo product is also 0.45 kJ/mol lower than its exo counterpart at the PM6 optimisation level (3.60 kJ/mol at 6-31G(d)), indicating the endothermic product is also the most thermodynamically stable. This may be explained by considering the steric hindrance observed both in the exo TS and product. In the exo TS, where the hydrogens are on an opposite face to the carbon bridge, we will observe steric hindrance with the rest of the dioxole ring, increasing the energy of the TS, the activation barrier and thus, decreasing the rate. Similarly, the hindrance is observed in the products, increasing its energy compared to the endo counterpart. A similar argument may be made using data from the B3LYP/G-31(d) optimisation.
Nf710 (talk) 23:27, 28 November 2017 (UTC) It is dubious to say that there is sterics in the TS but all your other arguments for which is the thermo and the kinetic are correct and your energy values looks to be quite good. You have also shown a good understanding of the inverse nature of the reaction
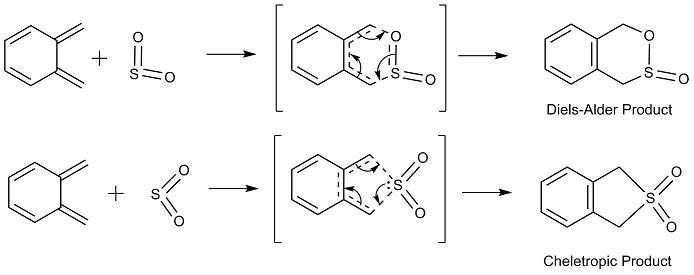
Exercise 3: Diels-Alder vs Cheletropic
Method 3 was used to locate the transition state and determine the IRC for this reaction.
| Exo *Note IRC is reversed | Endo | Cheletropic | |
|---|---|---|---|
| Reaction GIF | 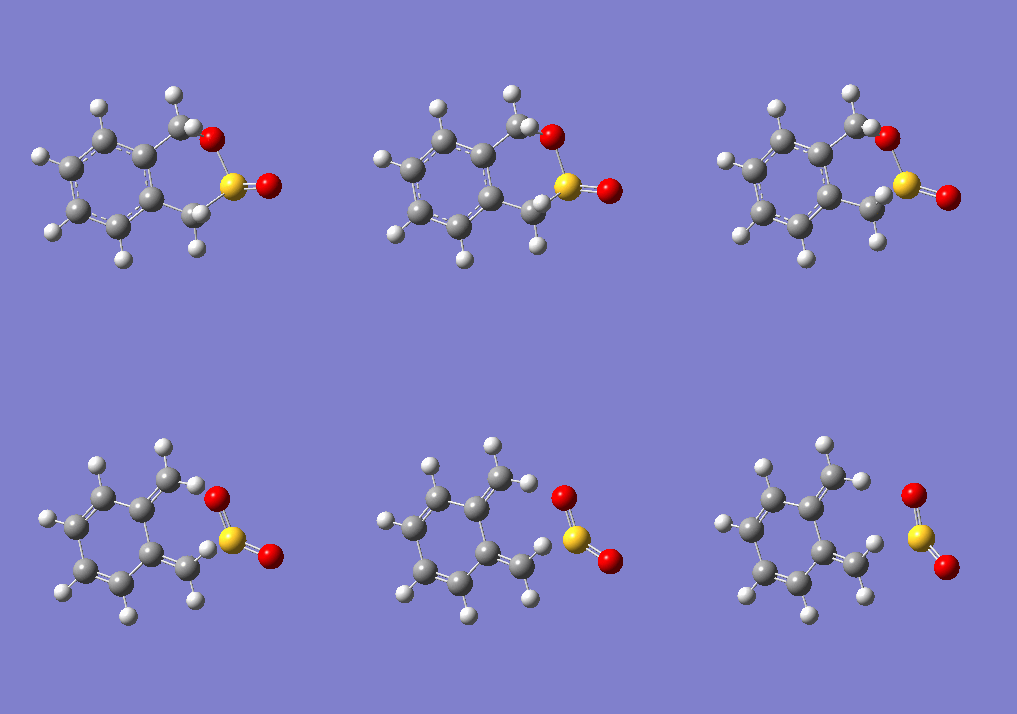
|

|

|
| Figure 25 | Figure 26 | Figure 27 | |
| Energy plot | 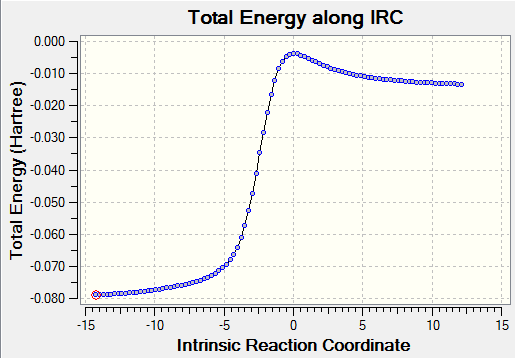
|

|
|
| Figure 28 | Figure 29 | Figure 30 |
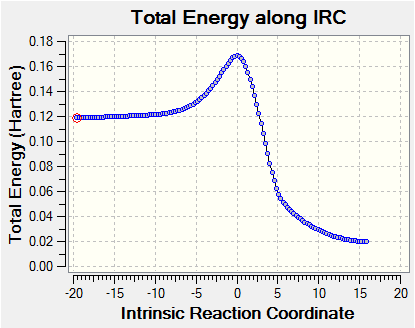
(The cheletropic IRC you've provided does not link reactants to products. You can see that the reactants are far too high in energy - the o-xylylene is twisted and is missing two hydrogens. This is the main reason that we run IRCs as a validation. Tam10 (talk) 10:42, 24 November 2017 (UTC))
Thermodynamic data
| (kJ/mol) | |||
|---|---|---|---|
| DA Exo | DA Endo | Cheletropic | |
| O-Xylylene | 467.564829 | ||
| SO2 | -313.138158 | ||
| TS | 241.7481819154 | 237.765298112 | 260.5833639 |
| Product | 56.3274812908 | 56.96547784 | 166.278178666 (52.38765569) |
| Reaction barrier | 87.32151092 | 83.33862711 | 106.1566929 |
| Reaction energy | -98.0991897 | -97.4611932 | 11.85151 (-102.039) |
In the IRCs shown in figures 25-27, we observe how the unstable o-Xylylene ring is converted to a aromatised benzene ring; the aromatic stability imparted by this transformation is the driving force for this reaction.
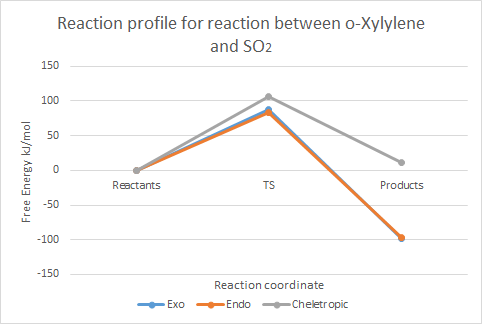
Table 3 shows that the activation energy is lowest in the endo case; considering Arrhenius' equation again, we may conclude that this is the kinetically-favoured product, formed under kinetic conditions (room temperature, non-equilibrating conditions). This result may be explained by considering the favourable orbital interactions in the TS between the lone pair of the oxygen (not involved in the reaction) and the developing pi-bond of the o-Xylylene, as shown in exercise 2 in figure 23; this stabilisation results in a lower energy endo transition state, and thus, the endo product is formed faster.
(You will probably have a mix of both DA products under kinetic conditions. However the real cheletropic product is lower in energy than both DA products Tam10 (talk) 10:42, 24 November 2017 (UTC))
The table also shows that the exo product is the lowest in energy, indicating this is the thermodynamic product. The exo product suffers less steric hindrance than it's endo counterpart; this is illustrated well in the IRC gif for the endo case (figure 26), where the non-reacting S=O bond experiences repulsion from the rest of the molecule, and moves away from the rest of the molecule.
The cheletropic case has both the highest reaction energy and the reaction barrier, indicating that it is a highly unfavourable product compared to the products of the Diels-Alder reaction. A possible explanation for this result could be that the 5-membered ring experiences more strain than the 6-membered ring in the Diels-Alder case. However, experimental evidence (2) shows that the cheletropic product should be thermodynamically favoured, owing to the retention of both S=O bonds. The energy of the cheletropic product, as seen directly in the IRC, has also been recorded in brackets in Table 3; this supports the aforementioned trend, but weakly so. Despite reoptimisations of the cheletropic product obtained from the IRC (at PM6 as required), and confirmation that the structure has converged, the energy remained higher than the products of the Diels-Alder reaction. A possible explanation for this error is that the IRC calculated reached a local minimum at the products, as opposed to the global minimum. This is a likely error, as the programme was set to 'Recorrect steps: Never'. In order to improve this calculation, this setting should be changed.
Conclusion
Computational methods were used to identify the transition state of various reactions. Thermodynamic data was also extracted, and the kinetic and thermodynamic data products were determined. The limitations of such methods was also discussed, and improvements to further investigations were also suggested.
References
(1) Wales, D. In Energy Landscapes: Applications to Clusters, Biomolecules and Glasses; Cambridge Molecular Science; Cambridge University Press: Cambridge, 2004; pp 1–118.
(2) Suarez, D.; Sordo, T. L.; Sordo, J. A. (1995). "A Comparative Analysis of the Mechanisms of Cheletropic and Diels-Alder Reactions of 1,3-Dienes with Sulfur Dioxide: Kinetic and Thermodynamic Controls". J. Org. Chem. 60 (9): 2848–2852. doi:10.1021/jo00114a039.
Log files
| File | Log File |
|---|---|
| Exercise 1 | |
| Diene | file |
| Alkene | file |
| TS | file |
| Products | file |
| IRC | file |
| Exercise 2 | |
| Cyclohexadiene | file |
| Dioxole | file |
| TS Exo PM6 | file |
| TS Exo B3LYP | file |
| Product Exo B3LYP | file |
| IRC Exo PM6 | file |
| TS Endo PM6 | file |
| TS Endo B3LYP | file |
| Product Endo B3LYP | file |
| IRC Endo PM6 | file |
| Exercise 3 | |
| o-Xylylene | file |
| SO2 | file |
| TS DA Exo | file |
| Product DA Exo | file |
| IRC DA Exo | file |
| TS DA Endo | file |
| Product DA Endo | file |
| IRC DA Endo | file |
| TS Cheletropic | file |
| Product Cheletropic | file |
| IRC Cheletropic | file |
