Rep:SanhaLeeMgO
DOI: 10042/a3v2z
Abstract
Quasiharmonic approximation (QHA) and molecular dynamics (MD) methods were used to determine the volumetric coefficient of thermal expansion of MgO, in order to investigate the consistency of the two methods in the low temperature range. Between 400 K - 800 K, both methods showed good agreement but above 800 K QHA showed superlinearity in expansion coefficient. In MD method, no quantum correction was considered which meant that the simulation underestimated the crystal volume in below 400 K. MD method also failed to reproduce the literature trend above 800 K due to the small system size used in this investigation. Both techniques overestimated the experimental expansion coefficient but the trends from QHA agreed the literature better than MD in the temperature range investigated. The vibrational dispersion relation and the density of state function were also determined using QHA and the observed trends agreed with the experimental findings.
I. Introduction
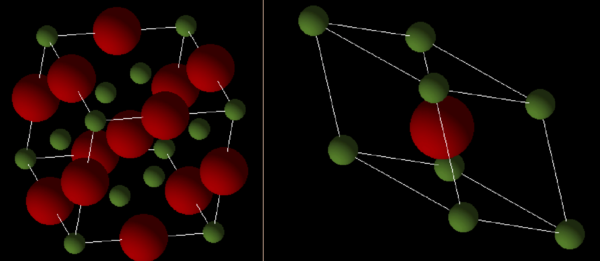
Magnesium oxide (MgO) is an ionic compound which adopts face-centred cubic (fcc) lattice in solid state where each magnesium and oxide ions are in octahedral environment [1]. Being one of the key constituent of the Earth's lower mantle, the thermodynamic properties of MgO has attracted many attention in the study of geophysics. However, there are many structural problems which are difficult to access through direct experiments due to the cost and inconvenience.[2] Making theoretical predictions by performing computer simulations provides an alternative approach to study this mineral. In this investigation, the thermal expansion coefficient of MgO was determined using two different methods; quasiharmonic approximation (QHA) and molecular dynamics (MD). Furthermore, the phonon dispersion curves and the density of states (DOS) function were also computed with QHA to perform additional structural analysis. There were already many theoretical and experimental studies performed to determine this mineral's thermodynamic properties [3] [4] [2] and hence they provided an excellent reference to evaluate the methods used in this study.
II. Methods
A. Force Fields
All computations were performed in General Utility Lattice Program (GULP) [5] by considering all ions as rigid, charged spheres. A good quality force-field is the key to accurate simulation results. In this investigation, all Mg-O interactions were modelled using Buckingham pair potential given by the equation below.
The potential parameters are summarised in the table below. Max cutoff distance was set to 12 angstroms for both interactions.
| Interaction | A | B | C |
| Mg-O | 0.130E+04 | 0.300 | 0.00 |
| O-O | 0.228E+05 | 0.149 | 27.9 |
B. Computing the Vibrational Dispersion Curves and Density of State function
At ambient temperatures, a perfect crystal with a rigid lattice do not exist in nature and there are always some contribution of the internal energy to lattice vibrations. The vibrational modes in crystals are known as phonons and each phonon can be labelled with a wavevector k. The dispersion relation is the equation connecting the relationship between the frequency and the wavevector. For a simple one dimensional system with two atoms in the unit cell, the dispersion relation have two solutions
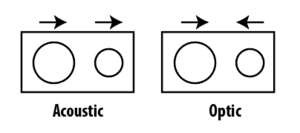
where k is the wavevector, a is the separation between the ions, and f is the force constant. It is clear from the equation above that one branch goes to zero when k=0 whereas the other branch becomes increasingly higher. The former is known as the acoustic branch and the latter is known as the optic branch. For the ionic compounds, the two atoms in the unit cell can either move in the same direction or in the opposite directions. In the optic branch solution, the ions in the unit cell moves in opposite directions and hence couple leading to optical properties.
Vibrational Density of State (DOS) is defined as the number of vibrational states per frequency interval and can be written as:
where n is the number of states [6]. From this equation it is obvious that DOS is proportional to inverse of the slop of the dispersion curve. Hence, the two factors leading to higher density of states are flatter bands and greater number of bands in the dispersion relations.
In this investigation, vibrational phonos were computed at 50 different k-points along the path W-L-G-W-X_K in the Brillouin Zone (BZ) using GULP. DOS function was also determined along the same path by dividing the k-space into a grid and calculating the average number of states at these sampling points. Initially, the grid was set to 1x1x1 and hence, one k point but the grid size was optimised by increasing the grid division until no further change in DOS was observed.
C. Determining the Expansion Coefficient Using Quasiharmonic Approximations
In QHA, harmonic approximation is used to evaluate ω, where the potential for the particles in the lattice is found by the Taylor expansion around the minimum. At the minimum, the linear term disappears and the terms above the second orders are negligible and hence the potential is parabolic
where s=(x-x0 ) displacement and k is the wavevector. Within this model, the ratio of probabilities of occupancy of two states, where state i is higher in energy than state j, is given by the Boltzmann distribution:
QHA incorporates the fact that at any temperature, the equilibrium structure is the one that minimises the free energy. Calculation of the minimum free energy of the system therefore allows the thermal dependence of the crystal to be modelled. [7] The free energy is given by the following equation
where the E 0 is the internal lattice energy, the second term correspond to the summation of zero point energy and the third term is the thermal excitation energy [8] [9]. The term k is the summation over the k space and j is the summation over the each band and hence the full phonon spectrum. To model the thermal expansion, one has to turn to the Badger's rule [10] which states that the force constant and hence ω decreases with increasing bond length. Therefore, the main driving force at the low temperature range is that, reduction of ω leads to lower zero-point energy and hence, F becomes more negative. At higher temperatures, the exp(-ћω/kB T) term provides additional decrease in F, if ω decreases. This is the cause of thermal expansion in QHA; as temperature increases, F is lowered if ω is decreased and from the Badger's rule, and the reduction of ω is favoured by increase in volume.
A crucial difference in QHA and harmonic approximation is that the anharmonicity is re-introduced but is only restricted to thermal expansion. The harmonic approximation is still used to compute ω, but the crystal volume is allowed to vary anharmonically. With pure harmonic approximation, the bond length will not increase with the temperature since the potential is symmetrical. It should be noted that anharmonic contribution becomes significant at higher temperature and hence this method becomes invalid [11]

Computing V(T,P) at different temperatures allows the thermal expansion coefficient to be determined. The volumetric thermal expansion coefficient is given by the relationship shown below
where α is the expansion coefficient, T is the temperature, and V is the volume of the solid. Since the expansion coefficient was dependent upon the temperature a fourth order polynomial [4] was fitted to V vs T data points. Using the derivative of this polynomial, it was possible to determine α at each temperature. [12].
In this investigation, the free energy were computed by sampling k-points along the path W-L-G-W-X_K using GULP with NPT ensemble. Again, the grid size was optimised by increasing the grid division from 1x1x1 until no further change in free energy was computed. Proceeding this optimisation, the thermal expansion coefficient was determined by varying the system temperature from 0 to 1000 K with 100 K intervals and monitoring the changes in the lattice volume at constant 0 GPa. By performing a linear fit for ln(V) vs T, the expansion coefficient was determined.
D. Determining the Expansion Coefficient Using Molecular Dynamics
In molecular dynamics, Newtonian equations were integrated using leapfrog algorithm to compute the time evolution. The key difference between the two method is that in MD, no quantum effect is taken into consideration and hence all phenomenon are modelled classically. In higher temperature ranges, previous studies have shown that MD method is more practicable than QHA [11] since the quantum effects are negligible.
The variation in crystal volume was also computed for the temperature range 100 to 1000 K using MD simulations in GULP using NPT ensemble. The conventional MgO unit cell was replicated 2x2x2, totalling 64 atoms. The crystal was equilibrated for 0.5 ps and the MD simulation was performed for further 0.5 ps where the equilibrium volume was calculated. The system was simulated at 0 GPa with periodic boundary conditions. Again, a fourth order polynomial was fitted to determine the variation of expansion coefficient with temperature.
III. Results and Discussion
A. The Dispersion Curve of MgO
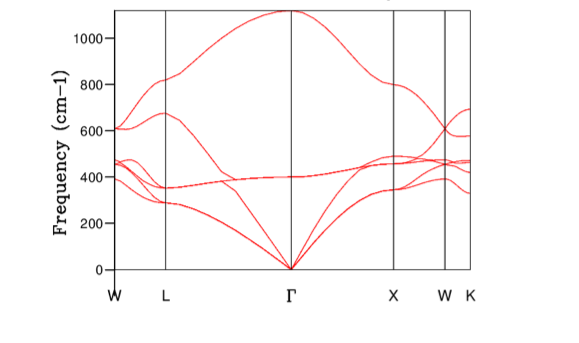
The obtained dispersion curve from the GULP calculation is shown in Figure 4. The dispersion relation resulted in six different branches. In three dimensions the number of optic phonons are given by 3N-3, where N is the number of atoms in the unit cell. Therefore, three bands correspond to the optic solution to the equation given in section IIB. The acoustic phonons also produce three bands due to one vibration corresponding to longitudinal mode and two further vibrations corresponding to transverse modes as displacement can also occur perpendicular to the propagation of the wave. At the point k=0 the acoustic branch has zero frequency as predicted previously. If the path along the Brillouin zone is highly symmetrical, the longitudinal and transverse dispersion may become degenerate and hence the number of bands were not six along the entire k space. Experimentally, the phonon frequencies can be predicted using neutron scattering and results from previous studies are summarised below. The general pattern agreed but the precise values were not in exact agreement.
| 408 | 718 | 299 | 422 | 443 | 554 | 288 | 369 |
B. The Density of State function for MgO
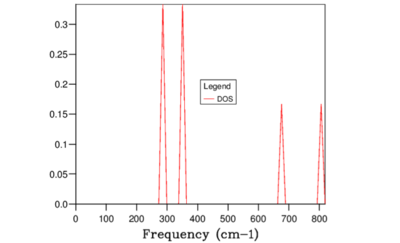
Obtained DOS functions for different grid sizes are summarised above. For 1x1x1 grid, the DOS(ω) plot (Figure 5) showed peaks at 288.49, 288.49, 351.76, 351.76, 676.23, and 818.82 cm-1 which corresponded to the symmetry point L on the dispersion curve as the frequency values were identical. It should be noted that this k point sampled here did not correspond to the symmetry point gamma. According to the study by Baldereschi [14] , averaging quasiparticle properties in Brillouin zone is time consuming but there are special points known as 'mean-value points' where the convergence is much faster. In a cubic lattice, the fastest convergence location is the symmetry point L and hence GULP performed calculation at this point for 1x1x1 system.
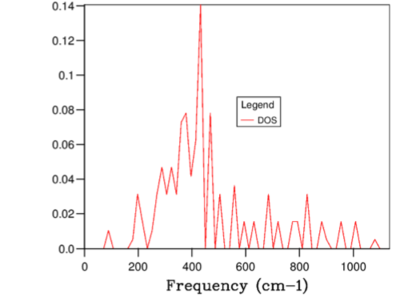
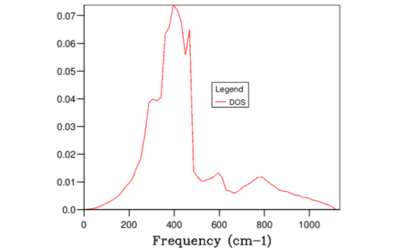
When the grid size was large, the number k samples were small and hence the the DOS was a delta function with peaks at the frequencies where the sample was collected. As the grid division increased, the number of locations along the W-L-G-W-X-K path where k was sampled increased. Therefore, since more samples were available at each frequency to perform averages, smaller grid led to higher resolution DOS curve with more clearly defined gradient. However, increasing the grid size beyond 32x32x32 had no effect on the obtained DOS function as illustrated in Figures 8-9. Beyond this division, the difference between the adjacent k values were too small to have an impact on the average and hence further would simply decrease the computational efficiency. Hence, 32x32x32 was concluded to be the optimum grid size. This argument is summarised in Figure 9 below.
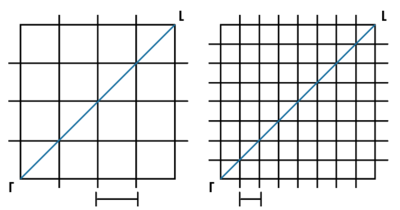
The total area under the DOS curve is proportional to the number of bands in the dispersion curve. Hence, this must be a constant quantity when DOS is calculated for different grid sizes. Therefore, as the grid division increased, in order to keep the integral for the entire frequency range constant, the peak DOS decreased as number of sampled frequencies increased.
Considering the definition of DOS(ω) from section IIB, it was possible to compare the obtained DOS(ω) with the dispersion curve. For example, for the grid size 1x1x1 the peaks at 286 and 351 cm-1 were twice as higher than 676, and 806 cm-1 peaks. This was due to the fact that 286 and 351 cm-1 peaks were degenerate and hence there were twice as many states sampled at these points. Furthermore, around the frequency region 300-500 cm-1 , there were high concentration of flat bands which in turn corresponded to high DOS(\omega) in the same frequency region.
C. Grid Division Optimisation by Computing the Free Energy of MgO Crystal
 |
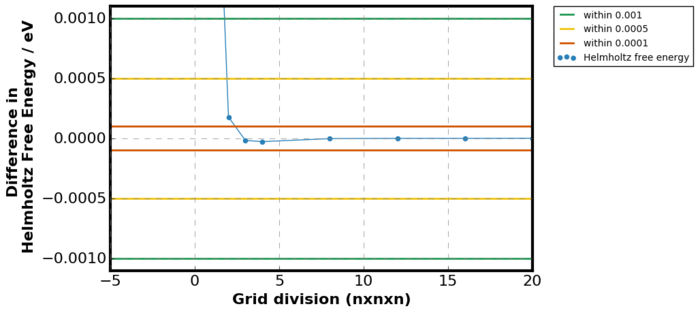 |
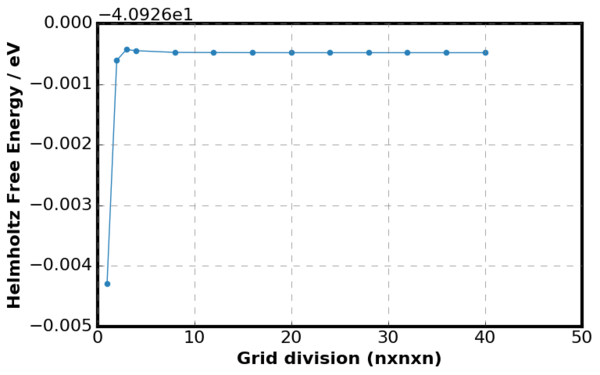
The variation in free energy as a function of grid division is shown in figures above. Figure 11. is a plot of
where Ei is the energy of the current grid size and Ej is the energy of the previous grid size. Overall, the Helmholtz Free Energy increased as the grid division increased because the number of k points taken into summation has increased. However, as the grid division continued to increase the Helmholtz Free Energy converged to -40.926483 eV, directly taken from GULP output. This relation was shown more clearly in Figure 11 as no difference in free energy between the previous and the current gird size was observed when the grid size was very small. Considering Figure 11., it can be seen that minimum grid division of 2 was required to generate free energy accurate to 1meV and 0.5 meV and for accuracy above 0.1 meV, minimum of grid division 3 was required.
D. Calculating Density of State Function and free energies for different systems
CaO
CaO have structural properties similar to MgO, including lattice parameters (hence ionic separation) and polarisation (see Table 2). Therefore, in the reciprocal space, the size of the Brillouin Zone (BZ) and the shape of the dispersion curve will be very similar to MgO. Hence, optimal grid size for MgO is also appropriate for CaO for both DOS function and free energy calculations.
Faujasite
Faujasite is a zeolite mineral with a varying concentration of cations. The unit cell parameter of zeolite in real space is much greater than MgO as shown in Table 2. The size of the reciprocal lattice vector is inversely proportional to the size of the real space lattice vector. Therefore, in the reciprocal space, the primitive unit cell of zeolite will be smaller than the MgO, hence small number of division is required to achieve same degree of resolution. For Zeolite, fewer grid division is sufficient for both free energy and DOS function plot.
| MgO | CaO | Faujasite | |
| 4.811 | 4.213 | 24.669-24.996 | |
| 1.73 | 2.51 |
Lithium

The band width for vibrational phonons can be predicted by the dispersion relation equation given in section IIB. It is clear that larger spring constant f, would lead to greater band width as the sine term is multiplied by a larger constant value. Lithium adopts metallic structure where the cations are fixed and the electrons are delocalised across the lattice. This shielding of cations results in smaller spring constant and hence the vibrational band width for metals are smaller than ionic compounds where the electrons are fixed inside the ions. Therefore, since the difference in the maximum and minimum frequency in the BZ is smaller for Li, increasing the number of k samples has smaller impact on the average. Larger grid size is sufficient to calculate accurate DOS function and free energy for Li (see Figure 9).
E. Computing the Thermal Expansion of MgO using Quasiharmonic Approximations
 |
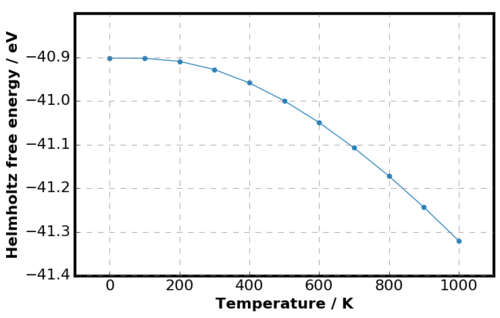 |
Little change in the lattice parameter was observed until 100 K but above this temperature, the thermal expansion was more definite. The results matched the experimental thermal expansion of MgO by Smith et al. [18] where the lattice parameter was almost constant until 80 K. Furthermore, non-linear thermal expansion agreed the experimental results by Reeber et al. [4] The gradient decreasing to zero at low temperatures is a quantum effect arising from the presence of zero point energy. Looking back at the free energy expression from section IIC, at lower temperatures the entropic contribution is small and the energy term dominates. The energy term is independent of temperature and hence leads to smaller variation in lattice parameters. Figure 14 also supported this argument as at lower temperatures, the variation in Helmholtz free energy was small. At higher temperatures, the free energy decreased non-linearly as the entropic contribution became more significant. [19]
The origin of thermal expansion can be explained by the Boltzmann distribution introduced in IIC. Increasing the temperature increases the probability and hence the occupancy of higher energy states. Here, increasing the population of higher energy states, the probability of finding the particle away from the ground state equilibrium position increases, and hence the equilibrium separation between the ions increases. As discussed in the methodology, QHA allows volume expansion but bond breaking was not allowed. Melting would therefore would not occur if the temperature was increased above the melting point (3250 K [20]).
F. Computing the Thermal Expansion of MgO using Molecular Dynamics
Literature search showed that the expansion coefficient was not constant but varied with the temperature [4]. The expansion coefficient determined using the derivative of the fourth order polynomial fitting are summarised in Table 5. below. QHA and MD showed an excellent agreement between the temperature range 400 K to 800 K and hence it is not a surprise that both methods yielded similar expansion coefficients in this region. No tailing was observed at lower temperatures for the MD result since the zero point energy was not taken into account in the numerical integration. This deviation was purely a quantum phenomenon and hence MD underestimated the lattice volume in this temperature region. Previous studies have shown that at high temperatures, the QHA showed superlinear change in expansion coefficient at high temperatures [8]. In figure 16, this behaviour was observed past 800 K since QHA neglects the higher-order anharmonic terms which becomes much more significant [11] at higher temperatures.
Studies have also shown that MD method showed continuous linear expansion in volume which was also observed in the experimental results [2]. In MD method, the thermal energy is distributed amongst the atoms in contrast to QHA, where the atomic motions are restricted to vibrational modes. At higher temperatures MD therefore should better replicate the random motion of atoms [2]. However, in this investigation, the MD result failed to show this linearity at high temperature. Large system size is especially important at higher temperatures where the atoms are moving with greater velocity and hence travel further. Due to the small system size, the simulation failed to accommodate the longer distance travelled by the atoms in the periodic boundary conditions and hence the expansion coefficient decreased past 800 K in Figure 16. This was the most significant limiting factor in this MD method.
| Temperature / K | Quasiharmonic Approx. K -1 | Molecular Dynamics K -1 | Experimental Lit. Value K -1 | MD Lit. Value K -1 |
| 0 | ||||
| 100 | ||||
| 200 | ||||
| 300 | ||||
| 400 | ||||
| 500 | ||||
| 600 | ||||
| 700 | ||||
| 800 | ||||
| 900 | ||||
| 1000 |
QHA and MD both overestimated the thermal expansion coefficient. This was not a surprising result since both methods assumed the crystalline lattice was perfect with no defects and periodic boundary conditions meant that the lattice was infinite in all three directions. Defects such as dislocation will prevent such smooth expansions and hence would lead to reduction of the expansion coefficient in real experiments. More significant approximation was that the ions were modelled as hard spheres with local charges. In a real crystal, covalent character is likely to be present which would increase the bond strength and hence the expansion is more difficult. Furthermore, expansion coefficient obtained from QHA was closer to the literature value than MD. As discussed previously, due to quantum corrections, QHA reproduced the behaviour of the crystal more accurately at lower temperatures. Therefore, since this investigation was performed in lower temperature range, QHA was a better model to use.
IV. Conclusions
Using quasiharmonic approximation, it was possible to determine the vibrational dispersion curves and the density of states which agreed the previously found trend. The thermal expansion coefficient determined by MD and QHA agreed well in the region 400 K to 800 K. However, MD method underestimated the volume at the low temperatures and the expansion coefficient did not agree with the experimental trend above 800 K due to small system size. Although both methods overestimated this value, the coefficient obtained from QHA matched the experimental results better than the MD method. The investigation was performed at lower temperature range meaning QHA which incorporated quantum correction was the better of the two methods.
Several improvements could potentially improve the obtained results. For both methods, using a different force field parameters optimised to study the thermal properties would certainly improve the model's behaviour [21]. For MD, previous studies have shown that incorporating quantum correction at lower temperatures can introduce the tailing and better replication of the experimental data. [2] As discussed earlier, increasing the system size by performing convergence tests would also improve the accuracy of the results which was the most significant error in this investigation. Furthermore, if longer computational time allowed, performing simulation with shorter timestep would increase the number of samples collected and hence increase the probability that all vibrations are sampled.
References
- ↑ A. R. Organov, M. J. Gillan and G. D. Price, The Journal of Chemical Physics, 2003, 118, DOI: 10.1063/1.1570394
- ↑ 2.0 2.1 2.2 2.3 2.4 2.5 M. Matsui, The Journal of Chemical Physics, 1989, 91, DOI: 10.1063/1.457484
- ↑ Y. Wang, L. Burakovsky and R. Ahuja, Journal of Applied Physics, 2006, 100, DOI: 10.1063/1.2219081�
- ↑ 4.0 4.1 4.2 4.3 4.4 R. R. Reeber, K. Goessel and K. Wang, Eur. J. Mneral., 1995, 7, 1039-1047
- ↑ J. D. Gale, J. Chem. Soc., 1997, 93, 629-637
- ↑ Hoffmann, R., 1987. How Chemistry and Physics Meet in Solid State., 26, 846-878
- ↑ M. T. Dove, Introduction to Lattice Dynamics, Cambridge University Press, New York, 1993, ch. 5, pp. 64-79
- ↑ 8.0 8.1 P. Carrier, R. Wentzcovitch and J. Tsuchiya, Phys. Rev. B, 2007, 76, DOI: 10.1103/PhysRevB.76.064116
- ↑ R. LeSar, R. Najafabadi and D. J. Srolovitz, The American Physical Society, 1989, 63, 624-627
- ↑ J. Cioslowski, G. Liu and R. A. Mosquera Castro, Chemical Physics Letters, 2000, 331, 497-501
- ↑ 11.0 11.1 11.2 M. Matsui, G. D. Price and A. Patel, Geophysical Research Letters, 1994, 21, 1659-1662
- ↑ D. Turcotte, Geodynamics, Cambridge University Press, US, 3rd edn., 2002, ch. 4, pp. 204-205
- ↑ B. B. Karki and R. M. Wentzcovitch, Phys. Rev. B, 2000, 61, 8793-8800
- ↑ A. Baldereschi, Phys. Rev. B, 1972, 7, 5212-5214
- ↑ E. Dempsey, G. H. Kuhl and D. H. Olson, The Journal of Physical Chemistry, 1968, 78, 387-390
- ↑ V. S. Stepanyuk, A. Szasz, B. L. Grigorenko, O. V. Farberovich and A. A. Katsnelson, 1989, 155, 179-184
- ↑ Y. N. Xu and W. Y. Ching, Phys. Rev. B, 1990, 43, 4461-4472
- ↑ D. K. Smith and H. R. Leider, J. Appl. Cryst. 1968, 1, 246-249
- ↑ C. Y. Ho, Thermal Expansion of Solids, ASN International, US, 1998
- ↑ C. Ronchi and M. Sheindlin, Journal of Applied Physics, 2001, 90, 3325-3331
- ↑ G. V. Lewis and C. R. A. Catlow, 1984, J. Phys. C: Solid State Phys., 1985, 18, 1149-1161

