Rep:SLMgO
DOI:
1. Calculating the Internal Energy of an MgO crystal
The energy of the MgO crystal was calculated using GULP with ionic.lib force-field and was found to be -41.07531759 eV. A section of the output file is shown below:
 Components of energy :

--------------------------------------------------------------------------------
   Interatomic potentials     =           6.72119980 eV
  Monopole - monopole (real) =          -5.11592628 eV
  Monopole - monopole (recip)=         -42.68059111 eV
  Monopole - monopole (total)=         -47.79651739 eV
--------------------------------------------------------------------------------
   Total lattice energy       =         -41.07531759 eV
--------------------------------------------------------------------------------
   Total lattice energy       =           -3963.1403 kJ/(mole unit cells)
2. Lattice Vibrations - Computing the Phonons
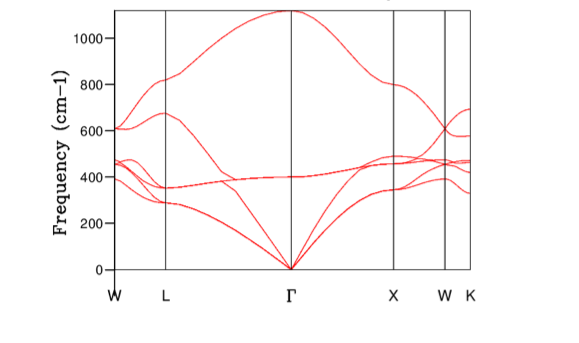
From the dispersion curve it can be seen that
Degeneracy
1. The density of states for 1x1x1 grid was computed for a single k-point. Can you work out which k-point by examining the dispersion curves ? look in the Log File to check.
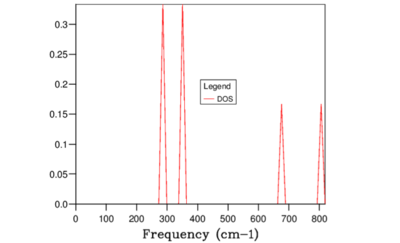
For 1x1x1 grid, the DOS plot (Figure 3) shows peaks at 286, 351, 676, and 806 cm-1 which must correspond to the symmetry point L on the dispersion curve. Checking the k point 11 from the dispersion curve log file suggested the frequencies should occur at 288.49, 288.49, 351.76, 351.76, 676.23, and 818.82 cm-1 and hence this point corresponded to L the symmetry point L.
It was also worth noting that for the 1x1x1 grid system, the k point sampled did not correspond to the symmetry point but instead. Looking back at Figure 1. It can be seen that at the wave vector corresponding to , there are only three bands which indicated that this point was highly symmetrical. It is stated in the paper by Baldereschi [1] that averaging quasiparticle properties in Brillouin zone is very time consuming but there are special points known as 'mean-value points' where the convergence is much faster. In 1x1x1 grid system the fastest converging k points was the symmetry point L, which was the mean value point of a cubic lattice as stated by Baldereschi.
2. How does the density of states vary with grid size ?
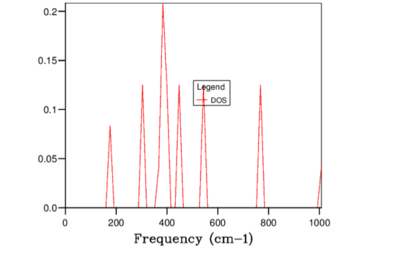
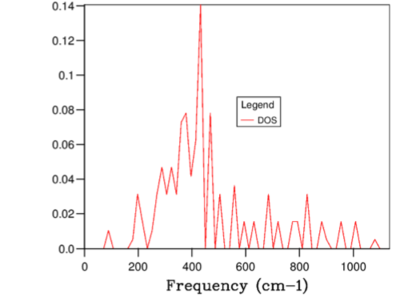
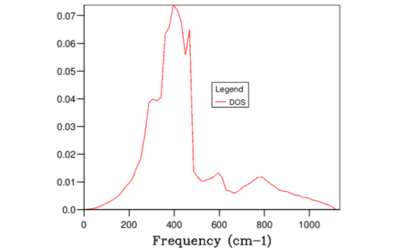
Figures 3-9 illustrates the variation in DOS with increasing grid size. As the grid size is increased, the number of locations in which k samples taken for each frequency increases. Therefore, when the grid size was large the number k samples were small and hence the shape of the DOS was similar to a delta function with peaks at the frequencies where the sample was collected. When the grid size was increased above 32x32x32, the DOS had a clearly defined gradient at each frequency because the resolution (number of different frequencies points where the samples was taken) was much higher.
3. As the grid size increases more and more of the possible vibrations are sampled and more features appear - which grid size is the minimum for a reasonable approximation to the density of states ?
When the grid size was increased beyond 32x32x32, no noticeable change was observed in the gradient for the entire range of frequencies (see Figure 8 and 9). Therefore 32x32x32 was the minimum size required.
4. How does the density of states computed at this optimal grid size compare to that computed for smaller and larger grids ?
The total area under the DOS curve is proportional to the number of bands in the dispersion curve. When DOS is calculated for different vibrational frequencies, the total area under the DOS curve should stay constant. In this experiment, each unit cell in the Bloch function contains two atoms; Mg and O and therefore in one dimension two bands will be generated. However, since the experiment was performed in 3 dimensions, 6 bands were generated in total. In Figures 3-9, in order to keep the integral of the DOS curve for the entire frequency range constant, the peak DOS decreases as number of sampled frequencies increased.
The density of states is defined as:
Therefore, greater the number of states within the frequency interval, higher value of DOS(E) results. For example, for the grid size 1x1x1 the peaks at 286 and 351 cm-1 were twice as higher than 676, and 806 cm-1 peaks. This was due to the fact that 286 and 351 cm-1 peaks were degenerate and hence there were twice as many states sampled at these points. Considering the definition of the DOS(\omega) above, it can be concluded that the DOS(\omega) is proportional to the inverse of the gradient of frequency vs k. Hence, flatter the band, the greater the density of states at that vibrational frequency. Compare the results from Figure 9 and Figure 2. Clearly, large amount of 'flat bands' were concentrated around the frequency region 300-500 cm-1 in the dispersion curve which in turn corresponded to high DOS(\omega) in the same frequency region.
- ↑ This is the lazy dog reference.
3. Computing the Free Energy - The harmonic approximation
The Helmholtz free energy can be found by summing over all vibrational energy levels by considering all k-points and all the possible vibrational bands j:
where the is the internal lattice energy, the second term correspond to the summation of zero point energy and the third term is the entropic term.
1. How does the free energy vary with grid size?
 |
 |
Figure 11. is a plot of
where is the energy of the current grid size and is the energy of the previous grid size. Overall, the Helmholtz Free Energy increased as the grid size decreased because number of k points taken into summation has increased. However, as the grid size continued to decrease the Helmholtz Free Energy converged to -40.926 J. This relation was shown more clearly in Figure 11 as no difference in free energy between the previous and the current gird size was observed when the grid size was very small.
2. Which grid size is appropriate for calculations accurate to 1 meV, 0.5 meV and 0.1 meV per cell ?
Minimum of grid division 2 was required to generate free energy accurate to 1meV and 0.5 meV. For accuracy above 0.1 meV, minimum of grid division 4 was required. The convergence for Helmholtz Free Energy was much more rapid than the DOS plot from the previous section as only grid division of 4 was required to achieve precision within 0.1 meV
Speculate: Would this optimal grid size for MgO be appropriate for a calculation on
a similar oxide (eg: CaO)?
a Zeolite (eg: Faujasite)?
a metal (eg: lithium)?
4. Thermal Expansion of MgO
1. Plot the energy against the temperature

2. Plot the lattice constant against the temperature
 |
 |
3. Comment on the shape of the curves
For lattice parameter vs temperature plot, little change in the parameter was observed until about 300K. Above this temperature, there was a clear linear lattice expansion.
For the Helmholtz Free Energy vs temperature plot, at low temperatures, the entropic contribution is very small as T ~ 0. Hence the free energy is dominated by the zero point energy summation and hence is relatively flat in the low temperature range. However, at high temperatures, the entropic term becomes more predominant and negative. Therefore, the free energy becomes more increasingly negative as the temperature increases.
4. Compute the coefficient of the thermal expansion for MgO
The thermal expansion coefficient is given by the equation:
where the V is the volume of the crystal. The coefficient of thermal expansion was calculated by performing a linear fit of ln(V) vs T plot where the gradient of the straight line corresponded to beta.
According to the literature, it is expected that the the thermal expansion coefficient is zero at absolute zero temperature but asymptotically approach a finite value as the temperature increases.
5. How does this compare to that measured ? Find a measurement in the literature or on the web - at what temperature was the measurement made?
According to the study by Shiratori et al., the thermal expansion of MgO was found to be from to . The obtained thermal expansion coefficient value in this investigation was 2.865 \times 10^{-5} between to
6. What are the main approximations in your calculation?
There are many approximations made in this investigation
7. What is the physical origin of thermal expansion?
As the temperature increases, the entropic driving force dominates enthalpy and the system will organise in such way to maximise entropy. Increasing the interatomic distance by decreasing the interatomic forces would lead to greater degrees of freedom and hence increases the number of microstates in which the system can be arranged.
8. As the temperature approaches the melting point of MgO how well do the phonon modes represent the actual motions of the ions?
9. In a diatomic molecule with an exactly harmonic potential would you expect the bond length to increase with temperature ? Why does it increase in the solid when we are using an quasi-harmonic approximation?
According to the Boltzmann distribution, the ratio of probabilities of occupancy of two states, where state i is higher in energy than state j, is given by the following equation:
Therefore, increasing the temperature will lead to increase the ratio and hence the population of the higher vibrational energy states. In perfect harmonic potential, the potential curve is symmetrical about the equilibrium bond length and hence, increasing the population of higher energy state will have no effect in the equilibrium position.
In 1912, Gruneisen postulated that the relationship between the vibrational frequencies of the atoms and the volume was given by Cite error: The opening <ref> tag is malformed or has a bad name:
where k is the wavevector and i is the ith mode of vibration. The thermal expansion coefficient can be written in terms of Gruneisen parameter <ref name::

