Rep:SJP115 Thermal Expansion Of MgO
Abstract
DLVisualize was used as the graphical user interface to the molecular modelling code GULP. GULP was used to calculate the energy and vibrations of the atomic interactions in a crystal of MgO. Two different simulations, lattice dynamics and molecular dynamics, were used to determine the free energy of the crystal and predict how the material expands when heated. Lattice dynamics relies on the quasi-harmonic approximation to model phonons and their density of states at different temperatures. Molecular dynamics, on the other hand, reproduces the actual vibrational motions of the atoms. The thermal expansion coefficient at zero pressure in the temperature range of 500-1300 K was computed to be 3.12E-05 K-¹ for lattice dynamics, whilst molecular dynamics afforded a value of 3.01096E-05 K-¹. Comparison with the experimental results by Rao et al.[1] revealed that the expansion coefficient for MgO is 4.0x10⁻⁵ K−¹ thus both simulations underestimated the expansion coefficient.
Introduction
Lattice Dynamics
Modelling Vibrations
Lattice Dynamics studies the underlying vibrations of atoms. The statistical average over the many vibrational energy states can be used to compute the thermophysical properties of crystalline materials such as the prototypical ionic solid, MgO.
Contrary to the traditional crystallographic picture of ionic solids as static, they are in fact dynamic materials. The regular lattice of a crystal means the atoms do not vibrate independently of each other. The vibrations take the form of collective modes which propagate through the material. These vibrations can be modelled by harmonic travelling waves [2]. The energy of harmonic vibrations is quantised in units of ћw, giving rise to phonons.
Phonons are characterised, not by their wavelength, but rather by wave-vectors which are normalised such that |k|=2π/λ and can be used to model the continuum of vibrational modes. The use of k means that vibrations are modelled in the reciprocal space rather than real space. In real space, a lattice is periodic in its lattice parameter a, whereas in reciprocal space its periodicity is given by the lattice vector in reciprocal space a*=2π/a. k takes specific values in the interval -π/a ≤ k< π/a which is called the First Brouillon Zone; outside of this range the vibrations will be repeated [3]. The frequency of phonons is also dependent on the lattice parameter a according to eq 1. J in this expression is the force constant of atoms of mass M.
Eq.1

Figure 1 illustrates the situation when the wave-vector of these phonons are parallel to the direction of propagation of the wave. The atoms are held together by a harmonic force and a denotes the lattice parameter. All the wave-vectors propagate in phase.
 |
|---|
The relationship between the wave-vector and frequency of a phonon is called the phonon dispersion. The normal modes correspond to lattice vibrations with a well-defined wavelength and frequencies. For a one dimensional lattice there are two modes of vibration which represent solutions to eq.2.
Eq.2[5]

The two branches correspond to longitudal acoustic and longitudal optical phonons and represent positive and negative solutions to eq. 2 respectively. In three dimensions, the lattice vibrational waves can be a systematic sequence of atomic displacements of longtitudal, transverse or some combination of the two. In general, the number of branches is given by the number of atoms multiplied by the dimensionality. Thus for the case of MgO, we would expect 6 branches. Phonon dispersions are important since you can compute the free energy of a crystal by summing over all the vibrational bands and all of the k-points which is equivalent to summing over all the vibrational energy levels. Density of states (DOS) graphs, plot the number of frequencies versus the frequency value of phonons and thus represent a histogram of frequency values across the grid of wave-vectors. Summation across all the vibrational modes across all the bands and k points represented in the DOS will give the Helmholtz free energy according to eq.3.
Eq.3[6]

Full conversion of the DOS is required to achieve an accurate free energy.
Approximations
The key approximation in lattice dynamics is the quasi-harmonic approximation which is a variant of the harmonic approximation.
The harmonic approximation assumes nuclear motion can be described in terms of independent quantum harmonic oscillators. The minimum bond length between a pair of atoms can be modelled according to a Buckingham potential; the potential between atoms is described by a van der Waals attraction and a Pauli repulsion term. The harmonic approximation then consists of performing a Taylor expansion around this minimum bond length.
Eq.4[7]

In the harmonic approximation, the higher order terms are neglected resulting in a potential of mean force that is quadratic; a spherically symmetric harmonic well. As the vibrational energy increases, the amplitude of vibration will increase and the bond will stretch around the equilibrium bond length. Whilst the harmonic approximation provides a link between vibrational frequencies, wave-vectors and interatomic forces, it fails in computing thermal expansion since it assumes the volume is independent of the frequency of phonons. Lattice dynamics thus relies on the quasi harmonic approximation. This introduces an explicit dependence of phonon frequncies on the volume whilst retaining the harmonic equation for the Helmholtz free energy [8]. The quasiharmonic approximation is useful in the study of thermal expansion as it is possible to retain the harmonic approximation but allow the force constants (and equilibrium separation) to change with an expansion of the lattice. The expression for the Helmholtz free energy can thus be described by eq. 5 and requires summation across the all the branches and wavevectors.
Eq.5[9]

The first term corresponds to the vibrational zero point energy of the lattice. The final term dictates the temperature dependent vibrational contribution, the KbT term gives the population of the states whilst the logarithmic term gives the dependence of the frequency of the vibrational modes on the temperature. The last term will dominate as the temperature increases; the frequency of phonons will decrease and their population will increase. Quasi harmonics takes into account quantum effects such as zero point energy (which is a manifestation of Heisenberg's uncertainty principle) thus lattice dynamics is useful at low temperatures. This is especially useful when classical simulations, such as molecular dynamics fail due to their neglect of quantum effects [10].
With a temperature dependent volume expansion in hand it is possible to model the isobaric thermoexpansion of MgO using lattice dynamics under the quasi harmonic approximation.
Eq.6[11]

Eq. 6 shows how the thermal expansion coefficient gives the change in volume with changing temperature, and the expression is normalised by dividing by the initial volume. At low temperature, it is more advantageous to have a lattice crystal that minimizes the volume and free energy whereas at high temperature the entropic component dominates.
Molecular Dynamics
Molecular dynamics (MD) aims to simulate the microscopic motion in a real material to obtain macroscopic properties. MD models particles classically and models the motion using Newton’s second law. The microscopic trajectory of each atoms in the system is determined by integration of Newton’s equation of motion [12].
The system is initialized to some state, where each atom has an initial position and velocity. In the case of MgO, the selected interatomic potential are pairwise interactions modelled by a Buckingham potential. In this simulation a fixed number of atoms in a lattice were allowed to interact for a fixed period of time under constant pressure and temperature conditions for a fixed period of time. It was assumed that all collisions were perfectly elastic, the total energy and momentum is conserved and the particles do not change shape upon collision [13]. The volume of the system was allowed to vary and the time average of the system will give the average statistical volume. This average is equivalent to an average over a microcanonical ensemble [14]. The exclusion of quantum effects such as zero point energy means that the simulation breaks down in the low temperature limit. The main disadvantage of molecular dynamics compared to lattice dynamics is that it is more computationally expensive to simulate individual atomic motion than it is to sum over the harmonic frequencies.
Method
Lattice Dynamics
Model of MgO
 |
 |
|---|
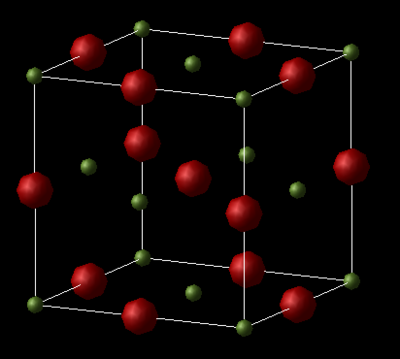
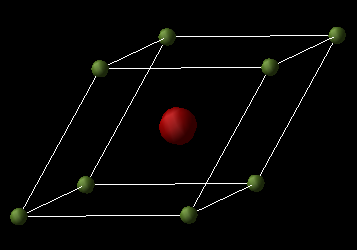
MgO is an ionic material with a halite structure, with Mg and O ions in octahedral environments.
The conventional unit cell of MgO is a face-centred cubic (FCC) lattice with all the lattice parameters equal to a and all the angles equal to 90°. The lattice dynamics simulation computes the properties for the primitive unit cell as it contains fewer atoms in the unit cell making it less computationally exhaustive. However, it is more useful to obtain the conventional lattice parameters since these can be compared with the super cell used in molecular dynamics. Converting between the primitive unit cell volume to the conventional unit cell is carried out by multiplying the primitive cell volume by four, since there are two ions in the primitive cell and 8 in the conventional cell.
The Cartesian lattice vectors (Å) for this primitive cell are as follows:
| 0.000000 | 2.105970 | 2.105970 |
| 2.105970 | 0.000000 | 2.105970 |
| 2.105970 | 2.105970 | 0.000000 |
The basis vectors thus define a right handed-axial system. All the lengths of the side of the primitive unit cell are equal to 2.9783 Å, whilst all the angles are equal to 60 degrees. The lattice parameter for the cubic cell is 4.21194 Å and this is in agreement with the experimental value of 4.212 Å [15] . The GULP program uses a relaxed fitting procedure for its calculations [16]. The short range interactions between Mg²+ and O²- are given by the Buckingham potential for the energy minimised geometry. The Ewald summation method is used to describe the long range electrostatic interactions.
Computing the Phonons
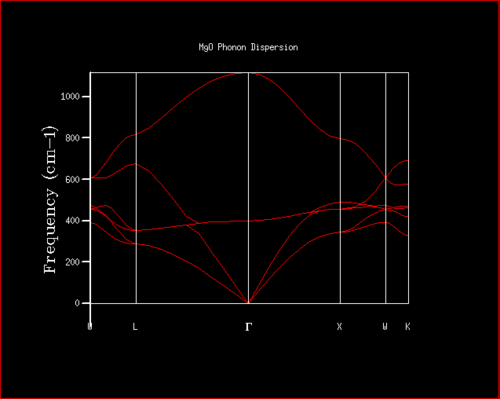
The phonon dispersion curve provides the relationship between the frequency of the phonons (w) as a function of their wave vector (w(k)) and allows visualisation of all the vibrational modes. There are three acoustic modes and three optical modes. There is one longitudinally polarised acoustic mode and two transverse acoustic modes that correspond to translation in the kx,y,z space. There are equally three optical modes, which correspond to higher energy vibrations. At Г the frequency is equal to zero as all atoms move in the same phase.
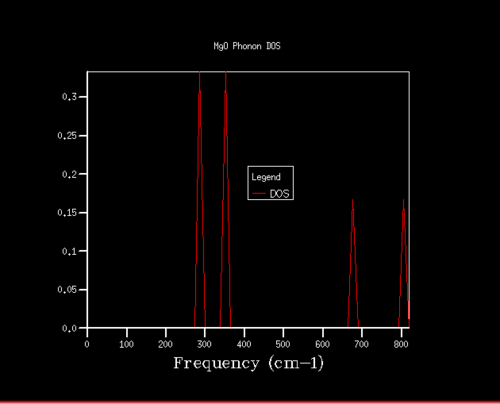
There are a large number of vibrational levels in solids and it is hence easier to think about the vibrational states in a given energy interval [17]. The DOS plots the distribution of these energy levels. The DOS is obtained by dividing the Brouillon zone into a grid of points and calculating the number of phonons and performing a numerical integration across the grid. In this way the DOS allows a return to the real space [18].
 |
 |
|---|
The phonon dispersion and DOS curves share the same frequency axis. The k point sampled for the 1x1x1 grid in the DOS corresponds to L. It can be seen that the frequencies populated in the density of states are those that match the L k point. The log file of the DOS shows that the frequencies populated are the 288.49, 351.76, 676.23 and 818.8 cm-¹. The first two frequencies are doubly degenerate which account for the greater intensity of these frequencies in the DOS. This equally provides further evidence for the L being the k point sampled since the phonon dispersion curve shows two branches are degenerate at 288.49 cm-¹ and two branches are degenerate at 351.76 cm-¹. Examining the log file of the phonon dispersion curve shows that the k value at L is: kx=ky=kz=0.5.
Optimising the Grid Size and Computing the Free Energy
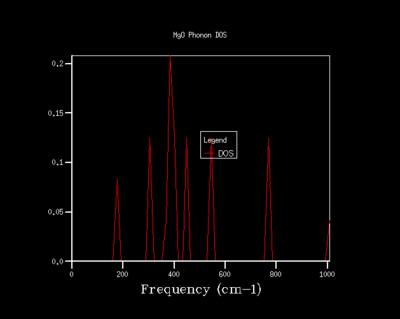
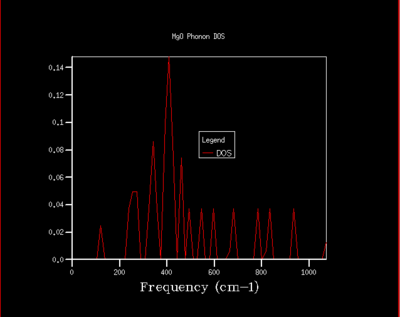
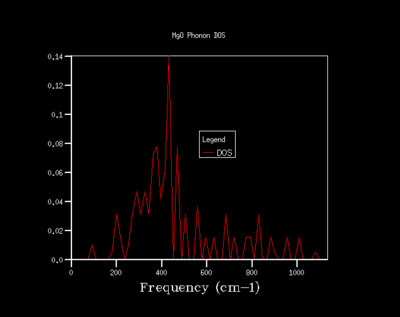
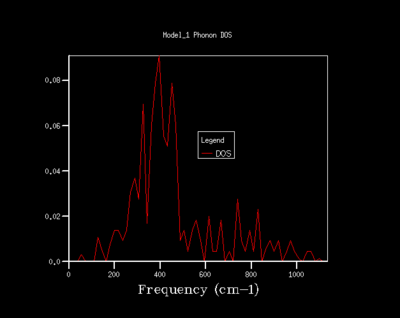
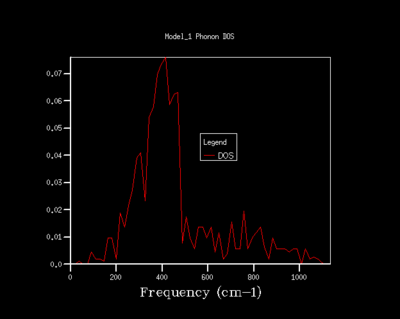
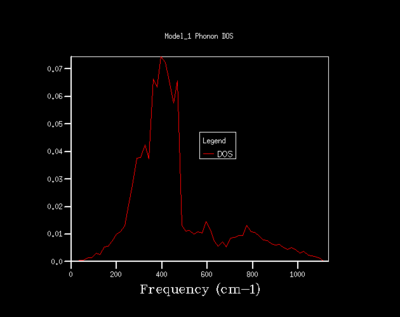
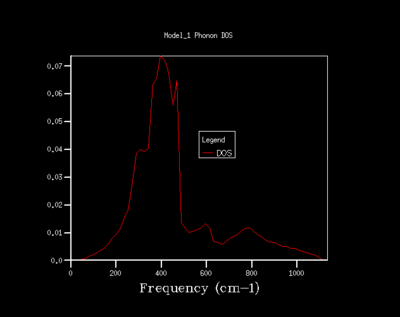
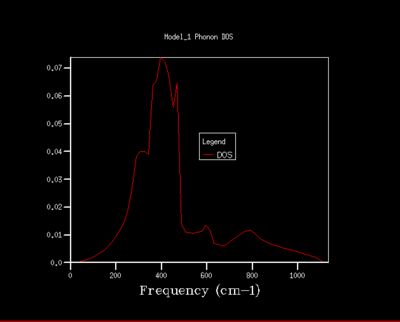
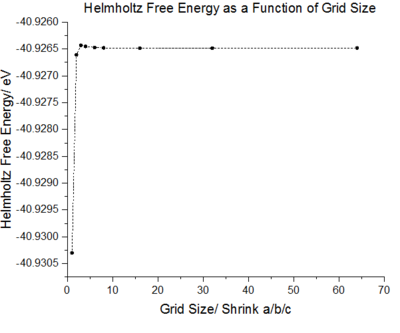
When generating plots of the phonon density of states, the critical factor in the resolution is the shrinking size. As the shrinking factor is increased the number of k points sampled across the first brouillon zone is increased. However, it is not necessary to employ large numbers of points to achieve accuracy of the properties. The optimal grid size is the one in which accuracy can be achieved without excess processing power.
As the shrinking factor is increased the DOS curve starts to converge, a better resolution of the DOS is obtained and a smooth variation of the number density is obtained. Examination of the log files revealed that not all the k points had been sampled. MgO is a highly symmetrical system, hence the number of k points is reduced to a minimum by using special points in k space. Comparison of the 32x32x32 grid and the 64x64x64 grid shows only minute changes to the curves.
Whilst the effect of varying the grid size on the DOS can be determined visually, a more quantitative approach to achieving the optimal grid size can be determined by inspecting the effect on the Helmholtz free energy.
| Grid Size | Helmholtz Free Energy/ eV | Difference in Energy/ meV |
|---|---|---|
| 1x1x1 | -40.930301 | 0 |
| 2x2x2 | -40.926609 | 0.3692 |
| 3x3x3 | -40.926432 | 0.177 |
| 4x4x4 | -40.926450 | -0.018 |
| 6x6x6 | -40.926471 | -0.021 |
| 8x8x8 | -40.926478 | -0.007 |
| 16x16x16 | -40.926482 | -0.004 |
| 32x32x32 | -40.926483 | -0.001 |
| 64x64x64 | -40.926483 | 0 |
The DOS resolution increases rapidly as the number of k points sampled is increased. This is reflected, not only by the rapid convergence in the free energy but also in the accuracy with varying grid size. The 2x2x2 and 3x3x3 grids are sufficient to gain 1 meV accuracy. 0.5 meV accuracy can be obtained with the 4x4x4 and 6x6x6. Lastly, 0.1 meV accuracy can be obtained with any grid size larger than 4x4x4.
From both a qualitative (inspection of the DOS curves) and quantitative approach (Helmholtz free energy), the 32x32x32 grid represents the optimal grid size. The 32x32x32 grid gives an accuracy of 0.1 meV, a free energy that has fully converged and a smooth DOS plot. Using a grid size greater than 32x32x32 would require more computational time that this would not lead to significant increases in accuracy.
The optimum grid size is dependent on the size of the first Brouillon Zone in k space. The First Brouillon Zone is defined as the primitive cell in reciprocal space, and its periodicity is given by a*=2π/a, hence it is highly dependent on the lattice parameter a in real space (provided the system is cubic). The lattice constant for MgO is 4.21194 Å. For a similar metal oxide such as CaO it is a=4.811 Å [20], it is 3.5092 Å for Li metal [21] and it is much larger for the zeolite Faujasite with values between 24.61- 25.13 Å [22] depending on the SiO2 and Al2O3 ratio. Due to the inverse relationship, a larger lattice constant will result in a smaller reciprocal space which will require a smaller shrinking factor to achieve resolution of the DOS. Conversely, a smaller lattice constant results in a larger first brouillon zone and more k points will need to be sampled. CaO should require a similar optimum grid size, the Zeolite will require a smaller grid and the Li metal will require a larger grid size.
Conversion of the DOS plot is crucial to obtain accurate free energy values as dictated by eq.3. The free energy for CaO can be computed accurately using a similar grid size to MgO since their lattice constants are similar and this will lead to a similar k space which will require a similar grid mesh to obtain the true DOS value hence Helmholtz energy. Faujasite has a lattice parameter that is orders of magnitude larger than the metal oxides, from which a smaller k space will ensue and the Helmholtz free energy can be found accurately with fewer k points. Contrariwise, lithium metal will require more k points sampled across the First Brouillon Zone to achieve the true Helmholtz value as a result of its large reciprocal space.
Molecular Dynamics
Model of MgO
 |
|---|
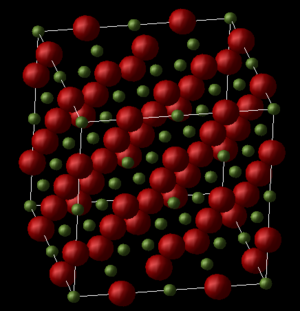
Molecular dynamics models the bulk properties of MgO by utilising a supercell to model the periodic boundary. It is not possible to use a primitive cell to study molecular dynamics since the movement of an atom in the cell will affect the atom in a cell directly next to it and the atoms would be moving in-phase. In a supercell, the movement of atoms in the grid will not affect the surrounding atoms and the movement of the atoms can be assumed to be more flexible. The atoms are enclosed in a cell that is replicated to infinity such that a particle that leaves the cell on one side enters the cell from the opposite side.
In order to determine a suitable supercell size, a similar calculation would need to be performed as with lattice dynamics; the number of unit cells should be increased until the Helmholtz energy converges. The optimal cell size will be the one that allows the atoms to move with sufficient freedom to obtain accurate average cell parameters, such as the Helmholtz energy, but not so large that excessive computational time would be required.
Running MD Simulations
The molecular dynamics algorithm utilised in this experiment worked as follows:
1. The potential and initial configuration of the atoms in the supercell were defined. This required building the molecules in x, y, z space and finding the optimal structure. The isothermal-isobaric ensemble and a timestep of 1 fs were selected as the parameters for the simulation. The timestep in this calculation is critical, it must be computationally efficient and sample all the vibrations.
2. The forces on the atoms were then computed.
3. Atomic momenta was introduced in the timestep, and the atoms were accelerated using F=ma.
4. The velocities of the atoms were updated: Vnew=Vold+ a*dt. The velocities were random but the variation in KE and PE of the atoms roughly maintained the selected temperature.
5. The positions of the atoms were equally updated.
6. This process was repeated until the average properties were obtained. The production step here was selected to be 500 thus 500 more steps will be performed following equilibration.
Examination of the log files for MD equally provide an insight into the nature of the simulations carried out. At each timestep sampled, a number of properties were reported with both an instantaneous value and an averaged value. This continued for each timestep and the system eventually equilibrated.
Results and Discussion
Lattice Dynamics
 |
|---|
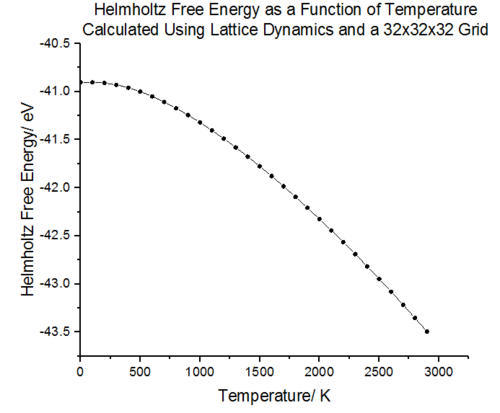
The free energy curve shows that at absolute zero temperature, the atoms vibrate about their equilibrium positions as they posses zero point vibrational energy. As the temperature is initially increased, the Helmholtz free energy is still dominated by the zero point energy and the energy changes are minimal. As the temperature is increased further, the population breaks out of the zero point vibrational energy and higher vibrational levels become populated. The entropic component of the free energy dominates at higher temperatures and the free energy decreases rapidly.
 |
 |
|---|
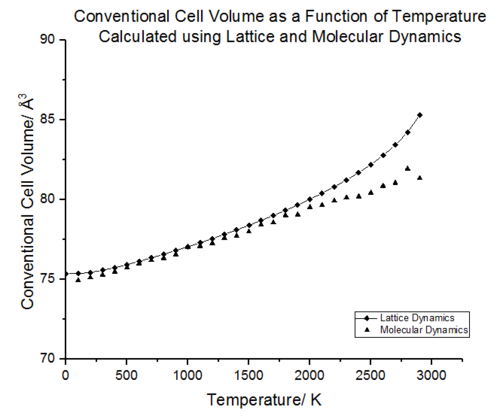
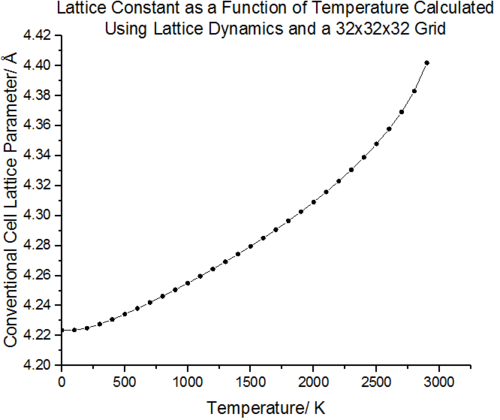
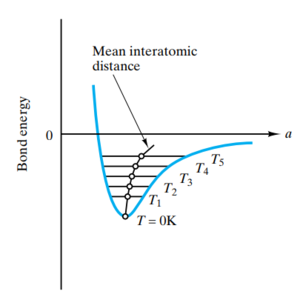
Figure 17 shows the effect on the lattice parameter on increasing the temperature. As the free energy is minimised for a given value of temperature, an equilibrium parameter is obtained a(T) [24]. It can be seen that minimisation of this free energy results in expansion of the lattice. In the low temperature limit, the lattice parameter changes are minimal and population of the ground vibrational state dominates. The atoms vibrate close to the equilibrium bond distance. As the temperature increases, the kinetic energy of the molecules increases and thus the atoms maintain a greater average separation resulting in an increased lattice constant. An alternative interpretation is that as the higher energy vibrational states are populated, the interatomic separation increases. This effect is illustrated in figure 18. In the high temperature limit, the lattice constant no longer increases linearly with temperature and an exponential increase in a begins to appear. The breakdown in linearity can be accounted for by a large increase in population of the higher energy states. This is a result of the frequencies of the phonons decreasing and the energy level separation decreasing. The increase in population of states at higher temperatures and decreasing phonon frequencies is a commutative effect giving rise to the exponential increase in lattice constant at high temperatures. The lack of higher order anharmonic terms in the quasi harmonic approximation means that even as the temperature approaches the melting point of MgO (3073 K [25]) and the lattice motif disintegrates to a liquid state, the lattice constant will continue to increase as the QHA will continue to assume a lattice structure. This is one of the major pit-falls of the Quasi-harmonic approximation, the geometry and free energy minimisation breaks down as anharmonic effects dominate.
 |
 |
 |
|---|
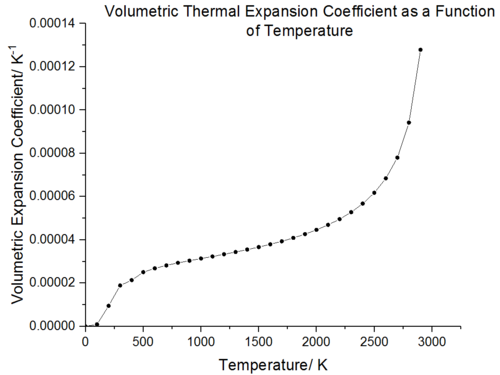
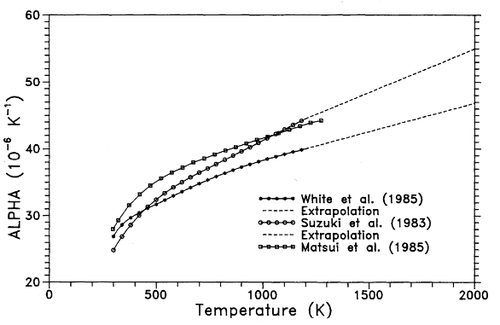
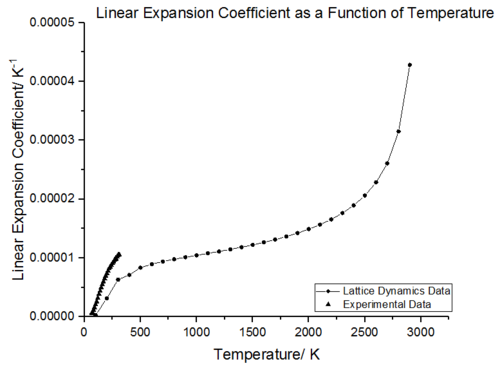
The thermal expansion coefficient can be defined as either volumetric (ΔV/V/ΔT) or linear (ΔL/L/ΔT). The volumetric and linear thermal expansion coefficient graphs both show that thermal expansion is not temperature independent. As the volumetric expansion coefficient is the cube of the linear expansion, the volumetric increase is three times larger. The thermal expansion curves were obtained according to eq. 6 where a polynomial fit function in Origin was used to calculate the derivative. In both cases, it is observed that it is the propensity of vibrational frequencies to decrease with increasing volume which results in thermal expansion [28].
Comparison of the volumetric expansion coefficient with experimental data (figure 19 and figure 20) shows a similar trend, between 300-500 K the thermal expansion coefficient rises rapidly whilst between 500-2000 K the thermal expansion coefficient increases linearly with temperature. As the temperature increases initially, the gradient increases rapidly and there is a large change in volume with temperature. The origin behind this phenomenon is similar to that observed with the volume-temperature curve; the thermal expansion is initially dominated by the vibrational ground state dependent volume and as the temperature increases the change in volume increases rapidly giving a steep gradient. The change in volume per temperature increase then remains constant across the linear region. In the high temperature limit, the thermal expansion coefficient again shows an exponential increase and this is again due to the lack of anharmonic terms in the Quasi-Harmonic approximation.
Figure 21, shows experimental values of the linear thermal expansion coefficient obtained from Browder et al. [29] plotted with the data obtained from lattice dynamics simulation. This shows that lattice dynamics generally underestimates the linear thermal expansion coefficient. This could be due to several factors, for example, inadequacy of the Buckingham Potential in modelling many-body terms or the breakdown of approximations made in the quasi harmonic approximation.
Moleucular Dynamics
 |
 |
|---|
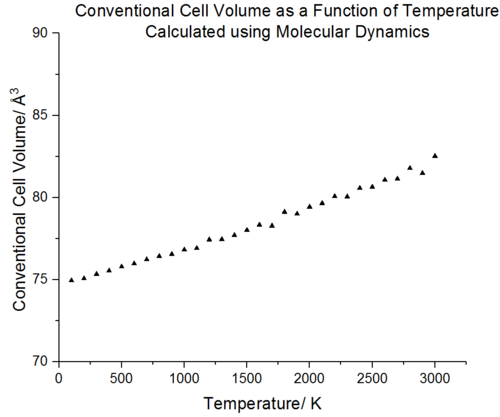
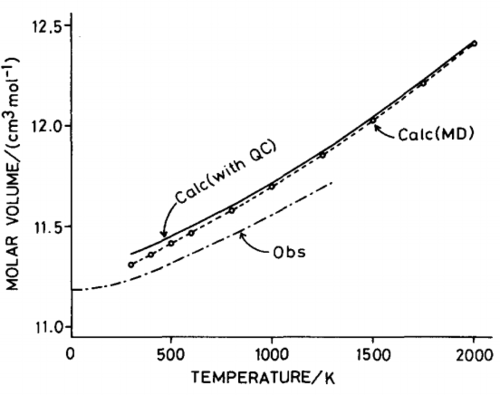
Molecular dynamics cannot be used at low temperatures since it is a classical model which utilises Newton's laws to model motion hence no data is observed at 0 K (the atoms would have no kinetic energy). Comparison with molecular dynamics data from Matsui et al.[31] shows that the data follows the same trend; there is a linear increase in volume as the temperature increases. The advantage of molecular dynamics is that it provides a more accurate description for volume changes at high temperatures. Unlike lattice dynamics, the volume continues to increase linearly as the temperature approaches the melting point of MgO. This is because the molecular dynamics does not rely on a lattice structure and more accurately models the liquid structure that begins to appear near the melting point of MgO. There is a full account of anharmonicity. However, the volume in the high temperature limit fluctuates and this is due to high KE of the atoms which leads to lots of noise. The particles have high velocities and their motion will require a smaller timestep to better reflect the average cell properties.
 |
 |
|---|
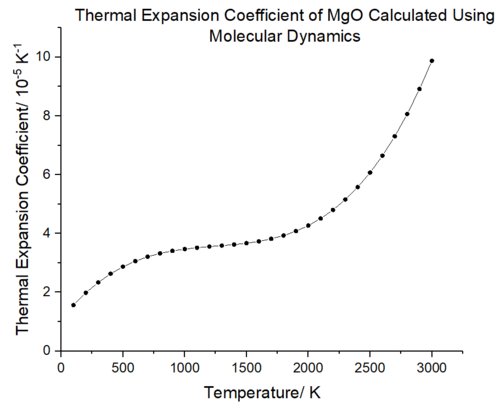
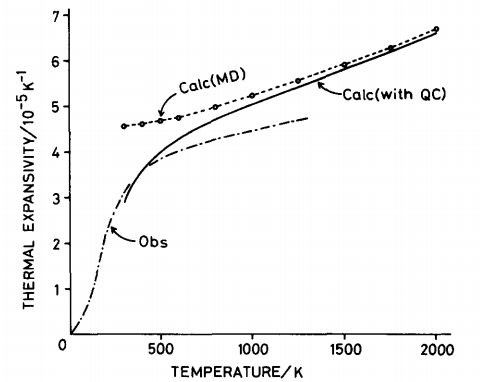
The volumetric expansion coefficient as a function of temperature was obtained in the same way as lattice dynamics; the gradient was computed using a polynomial fit in Origin and plotted according to eq. 6. The same sigmoidal behaviour as figure 25 is observed. At low temperatures, the thermal expansion coefficient will be dominated by the lattice potential energy and as the temperature increases the entropy factor will dominate. Comparison with the molecular dynamics results from Matsui et al. [33] shows that the molecular dynamics results calculated herein underestimate the thermal expansion coefficient. This could be due to the cell size and timestep used in the calculations. Matsui used a much larger supercell for their simulations; 64 unit cells containing 256 Mg ions and 256 O ions and a 5000 picosecond timestep [34]. Their results better match experimental data and suggest that a timestep of 500 fs and supercell of 32 units is insufficient to probe the high velocities of ions and obtain an accurate picture of the temperature variation with volume.
Comparison of Lattice Dynamics and Molecular Dynamics
Curve Fitting Approach
 |
|---|
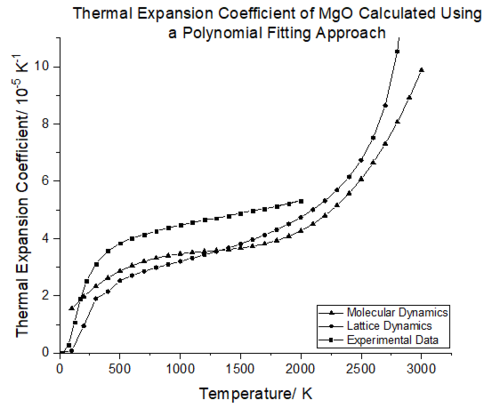
Comparison of the two simulations with experimental data shows that in the temperature range of 0-200 K the thermal expansion coefficient predicted by lattice dynamics will be more accurate; molecular dynamics overestimates the increase in volume which will be dominated by the zero point vibrational energy. As the temperature increases (300-1200 K), molecular dynamics reflects the experimental values of α(T) more closely, but there is not a large discrepancy between the two simulations. In the temperature range of 1400-2000 K, lattice dynamics becomes more reliable, but again both simulations prove to be fairly accurate in modelling the volume expansion as a function of temperatures. This is because within these temperature ranges the approximations made in each simulation remain valid. Whilst no experimental data could be found above 2000 K, it is envisaged that lattice dynamics will fail as the quasi harmonic approximation breaks down and molecular dynamics will remain valid as the ions are free to move and adopt the geometry with the lowest energy.
Linear Fitting Approach
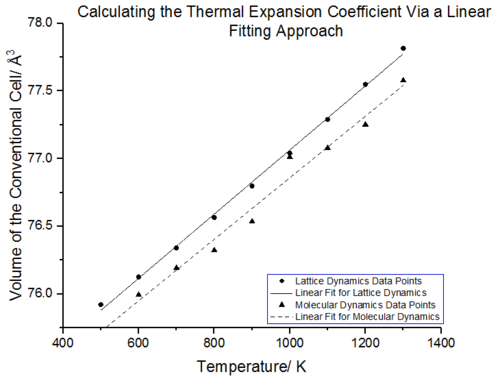
From figure 24 it can be seen that between 500-1300 K, the conventional cell volume increases linearly with temperature for both lattice and molecular dynamics. In this region the volume with respect to temperature change is constant thus the expansion coefficient should remain the same. A linear fit of this region was carried out for both molecular and lattice dynamics, as seen in figure 25. The gradient from this linear region will be constant and can be extracted from the linear fit. With the linear fits in hand the thermal expansion coefficients were calculated using eq.6. The thermal expansion coefficient in this temperature range was calculated to be 3.12E-05 K-¹ for lattice dynamics whilst the thermal expansion coefficient for molecular dynamics was found to be 3.01096E-05 K-¹. Rao et al.[37] report a volumetric expansion coefficient of 4.0x10⁻⁵ K−¹ in the temperature range of 300 K–1250 K[38]. The thermal expansion coefficient obtained from lattice dynamics is thus more accurate with a 22 % error compared to literature, molecular dynamics has a 25 % error compared to literature. The difference in expansion coefficient between the two simulations is very small, 3.61 %.
Conclusion
Two methods of computing the thermal expansion coefficient of MgO were carried out for two distinct simulations. The curve fitting method allowed the observation of how the thermal expansion coefficient varies as a function of temperature. A linear fitting approach was also used and proved to be successful for both simulations. The thermal expansion coefficient at zero pressure in the temperature range of 500-1300 K was computed to be 3.12E-05 K-¹ for lattice dynamics, whilst molecular dynamics afforded a value of 3.01096E-05 K-¹. Both simulations underestimated the thermal expansion coefficient with the experimental value being reported as 4.0x10⁻⁵ K−¹ by Rao et al. [39].
In order to improve the accuracy of the thermal expansion coefficients several modifications could be made to each simulation. A smaller timestep in molecular dynamics is required, especially at elevated temperatures. The stepwise simulation probes the volume of the system for each time interval, if the particles have a high velocity then a smaller timestep would give a more accurate average volume. In addition quantum effects need to be accounted for so that the system can be modelled at low temperatures. To improve the lattice dynamic simulation, anharmonic terms need to be introduced. The downfall of these modifications is that both improvements would be computationally more expensive.
References
- ↑ Studies on Thermophysical Properties of CaO and MgO by 𝛾-Ray Attenuation by A. S. Madhusudhan Rao and K. Narender Journal of Thermodynamics Volume 2014, Article ID 123478, http://dx.doi.org/10.1155/2014/123478
- ↑ Introduction to the theory of lattice dynamics M.T. Dove EDP Sciences, 2011 DOI: 10.1051/sfn/201112007
- ↑ How Chemistry and Physics Meet in the Solid State R. Hoffmann Angew Chem Inr. Ed Engl 26 1987 846-878
- ↑ Introduction to the theory of lattice dynamics M.T. Dove EDP Sciences, 2011 DOI: 10.1051/sfn/201112007
- ↑ Misra, Prasanta Kumar (2010). " Chapter 2.1.3 Normal modes of a one-dimensional chain with a basis". Physics of Condensed Matter. Academic Press. p. 44. ISBN 0-12-384954-3.
- ↑ Introduction to Phonons and Electrons By Liang-fu Lou ISBN: 981-238-439-1
- ↑ Introduction to the theory of lattice dynamics M.T. Dove EDP Sciences, 2011 DOI: 10.1051/sfn/201112007
- ↑ On how differently the quasi-harmonic approximation works for two isostructural crystals: Thermal properties of periclase and lime A. Erba, M. Shahrokhi, R. Moradian, and R. Dovesi The Journal of Chemical Physics 142, 044114 (2015) https://doi.org/10.1063/1.4906422
- ↑ On how differently the quasi-harmonic approximation works for two isostructural crystals: Thermal properties of periclase and lime A. Erba, M. Shahrokhi, R. Moradian, and R. Dovesi The Journal of Chemical Physics 142, 044114 (2015) https://doi.org/10.1063/1.4906422
- ↑ Ionic solids at elevated temperatures and/or high pressures : lattice dynamics, molecular dynamics, Monte Carlo and ab initio studies Neil L. Allan, Gustavo D. Barrera, John A. Purton, Chris E. Simsa and Mark B. Taylor Phys. Chem. Chem. Phys., 2000, 2, 1099-1111 DOI : 10.1039/a908622f
- ↑ On how differently the quasi-harmonic approximation works for two isostructural crystals: Thermal properties of periclase and lime A. Erba, M. Shahrokhi, R. Moradian, and R. Dovesi The Journal of Chemical Physics 142, 044114 (2015) https://doi.org/10.1063/1.4906422
- ↑ Basic Principles of Molecular Dynamics (MD) theory K. Kubiak PowerPoint presentation available at:http://www.archie-west.ac.uk/wp-content/uploads/2012/06/MD_theory.pdf
- ↑ Basic Principles of Molecular Dynamics (MD) theory K. Kubiak PowerPoint presentation available at:http://www.archie-west.ac.uk/wp-content/uploads/2012/06/MD_theory.pdf
- ↑ Molecular dynamics simulations at constant pressure and/or temperature by Hans C. Andersen The Journal of Chemical Physics 72, 2384 (1980)
- ↑ Magnesium oxide (MgO) crystal structure, lattice parameters, thermal expansion Subvolume B ‘II-VI and I-VII Compounds; Semimagnetic Compounds’ of Volume 41 ‘Semiconductors’ of Landolt-Börnstein - Group III Condensed Matter DOI: 10.1007/10681719_206
- ↑ Self-consistent Interatomic Potentials for the Simulation of Binary and Ternary Oxides by Timothy S. Bush,*a Julian D. Gale: C. Richard A. Catlow" and Peter D. Battle J. MATER. CHEM., 1994, 4(6), 831-837
- ↑ How Chemistry and Physics Meet in the Solid State R. Hoffmann Angew Chem Inr. Ed Engl 26 1987 846-878
- ↑ How Chemistry and Physics Meet in the Solid State R. Hoffmann Angew Chem Inr. Ed Engl 26 1987 846-878e
- ↑ Lattice Dynamics of MgO at High Pressure: Theory and Experiment S. Ghose, M. Krisch, A. R. Oganov, A. Beraud, A. Bosak, R. Gulve, R. Seelaboyina, H. Yang, and S. K. Saxena Phys. Rev. Lett. 96, 035507
- ↑ Computational Chemistry of Solid State Materials: A Guide for Materials by Richard Dronskowski ISBN-10: 3-527-31410-2
- ↑ Lattice Constants of Separated Lithium Isotopes by E. J. Covington, and D. J. Montgomery The Journal of Chemical Physics 27, 1030 (1957)
- ↑ Catalysis and Zeolites: Fundamentals and Applications J. Weitkamp, L. Puppe Springer-Verlag Berlin Heidelberg 1999 ISBN: 978-3-540-63650-2
- ↑ http://web.nchu.edu.tw/~jillc/me/Ch07-%20Thermal%20Behavior.pdf Last accessed 11th February 2018
- ↑ Lattice dynamics, thermal expansion and specific heat of a Lennard-Jones solid in the quasi-harmonic approximation F.W.De Wette, L.H.Fowler, B.R.A.Nijboer Physica 54 (1971) 292-304
- ↑ Melting point of MgO C. Ronchi, M. Sheindlin Journal of Applied Physics 90, 3325 (2001) doi.org/10.1063/1.1398069
- ↑ Thermodynamic Functions and Properties of MgO at High Compression and High Temperature O. L. Anderson and K. Zou J. Phys. Chem. Ref. Data Vol. 19, 1990
- ↑ Magnesium oxide (MgO) crystal structure, lattice parameters, thermal expansion Subvolume B ‘II-VI and I-VII Compounds; Semimagnetic Compounds’ of Volume 41 ‘Semiconductors’ of Landolt-Börnstein - Group III Condensed Matter DOI: 10.1007/10681719_206
- ↑ Lattice Dynamics Calculation of the Thermal Expansion of Pure and Ti-Bearing Fused Silica in the Quasi-Harmonic Approximation by James R. Rustad Corning Incorporated accessible at https://arxiv.org/ftp/arxiv/papers/1404/1404.0264.pdf
- ↑ Low Temperature Thermal Expansion Measurements on Optical Materials Browder, J. S., Ballard Appl. Opt. 8 (1969) 793
- ↑ Molecular dynamics study of the structural and thermodynamic properties of MgO crystal with quantum correction by Masanori Matsui The Journal of Chemical Physics 91, 489 (1989);
- ↑ Molecular dynamics study of the structural and thermodynamic properties of MgO crystal with quantum correction by Masanori Matsui The Journal of Chemical Physics 91, 489 (1989);
- ↑ Molecular dynamics study of the structural and thermodynamic properties of MgO crystal with quantum correction by Masanori Matsui The Journal of Chemical Physics 91, 489 (1989)
- ↑ Molecular dynamics study of the structural and thermodynamic properties of MgO crystal with quantum correction by Masanori Matsui The Journal of Chemical Physics 91, 489 (1989)
- ↑ Molecular dynamics study of the structural and thermodynamic properties of MgO crystal with quantum correction by Masanori Matsui The Journal of Chemical Physics 91, 489 (1989)
- ↑ Thermodynamic Functions and Properties of MgO at High Compression and High Temperature O. L. Anderson and K. Zou, J. Phys. Chem. Ref. Data, 1990, 19, 69-83 https://doi.org/10.1063/1.555873
- ↑ Thermal expansion of periclase and olivine, and their anharmonic properties I. Suzuki, Phys. Earth Planet. Inter, 1975, 23, 145-159
- ↑ Studies on Thermophysical Properties of CaO and MgO by 𝛾-Ray Attenuation by A. S. Madhusudhan Rao and K. Narender Journal of Thermodynamics Volume 2014, Article ID 123478, http://dx.doi.org/10.1155/2014/123478
- ↑ Studies on Thermophysical Properties of CaO and MgO by 𝛾-Ray Attenuation by A. S. Madhusudhan Rao and K. Narender Journal of Thermodynamics Volume 2014, Article ID 123478, http://dx.doi.org/10.1155/2014/123478
- ↑ Studies on Thermophysical Properties of CaO and MgO by 𝛾-Ray Attenuation by A. S. Madhusudhan Rao and K. Narender Journal of Thermodynamics Volume 2014, Article ID 123478, http://dx.doi.org/10.1155/2014/123478

