Rep:Pth115MgO
Abstract
The principal aim of this computational experiment was to use the programme GULP to run optimisations on an MgO lattice to determine the thermal expansion coefficient, α, of the material. Once the ideal k grid size for the simulations was established to be 20x20x20, two different methods were used to calculate α, one based on the quasi-harmonic approximation and the other on molecular dynamics. The values obtained for α were 34.6 x 10⁻⁶ K-1 (quasi-harmonic approximation) and 31.2 x 10⁻⁶ K-1 (molecular dynamics) for the temperature range of 300-2000 K. This was found to roughly agree with experimental data found in literature. Further, by working out expressions for each model that give α as a function of temperature, we were able to directly graphically compare the compatibility of the models with the literature values. From this, it was concluded that the results from the method based on the quasi-harmonic approximation coincided more with the experimentally measured values at temperatures above 700 K, whilst the molecular dynamics model was closer to the literature values at temperatures below 700 K.
Introduction
MgO: Crystal Structure
For an MgO crystal, there are two main unit cell types to take into account: primitive and conventional.
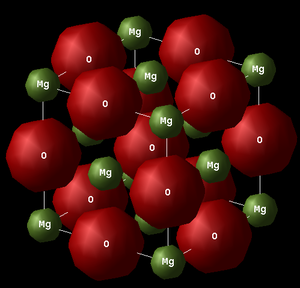
The conventional unit cell of MgO (see Fig.2) has a face centred cubic (FCC) lattice structure that contains 8 ions (4 Mg2+ and 4 O2-). This system has a cubic shape with a lattice parameter ac (constant in all three dimensions, ac = bc = cc) and an interaxial angle of 90o (αc = βc = γc = 90o).
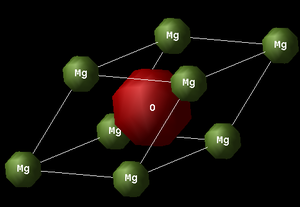
Each primitive unit cell of MgO (see Fig.1), on the other hand, has a rhombohedral shape and contains 2 ions (1 Mg2+ and 1 O2-). As with the conventional cell, the lattice parameter, ap, is the same along all three dimensions (ap = bp = cp). However, the interaxial angle is 60o in the case of the primitive unit cell (αp = βp = γp ≠ 90o).
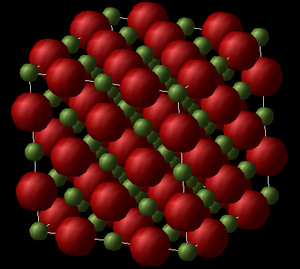
Although, there is still a third kind of MgO unit cell structure type that needs to be mentioned and considered: the supercell structure (see Fig.3). It has the same FCC structure as the conventional unit cell, except that its lattice parameter, as, is twice as large as that of the conventional cell (as = bs = cs = 2ac). The supercell type structure contains a total of 64 ions (32 Mg2+ and 32 O2-).
For this task, the primitive unit cell structure was used to perform calculations within the frame of the quasi-harmonic approximation, whilst the supercell was used for the molecular dynamics computations. The underlying reason for this is elaborated upon later in the report.
Equations 1 and 2 respectively allow for the conversion from the volumes of a primitive cell, VP, and of a supercell, VS, to the volume of an equivalent conventional cell, VC.
— Equation 1
— Equation 2
| Primitive Cell | Conventional Cell | Supercell |
|---|---|---|
 |
 |
 |
Thermal Expansion Coefficient
One of the aims of this computational experiment is to calculate a value of the thermal expansion coefficient, α, of MgO.
Under the thermal expansion of a material, one understands how that material changes in size (length, area or volume) in response to a temperature change[1]. In this experiment, we will be considering the volume of the MgO lattice as the size-dimension that changes with temperature (not length or the surface area). The reason why a solid material thermally expands is the increase of the thermal motion of the atoms (i.e. the atoms gain more thermal energy and oscillate to a greater extent around their equilibrium positions, which increases the average separation between atoms and hence the volume of the overall lattice)[2].
The coefficient of thermal expansion, α, physically describes the ratio of the change in size of a material relative to the change in temperature. The expression for the calculation of the thermal expansion coefficient of a volumetric expansion is given by Equation 3 below, where dT, dV and Vo respectively represent the temperature and volume changes at constant pressure, and the initial volume of the solid.
The areas of material science and engineering make great use of the thermal expansion coefficient when developing and designing sophisticated alloys. Apart from that, determining the thermal expansion coefficient is important when welding together materials, as a large difference in α between the materials could lead to tensile stress in one material and a compressive stress in the other, resulting in both materials cracking[3].
— Equation 3[4]
Vibrations: Phonon Theory & Reciprocal Space
Similar to the way light can be described to comprise of distinctly quantised energy packets (photons), the quanta of lattice vibrations are called phonons. As with light, vibrations are subject to the phenomenon of wave-particle duality: normal modes from classical mechanics describe the wave-nature of vibrations, whilst phonons represent particle properties of vibrations.
In this experiment, we are dealing with lattices in real, as well as reciprocal space. In reciprocal space, objects are defined in terms of wave-vectors k (given by Equation 4), rather than position vectors, r, that are used in real space. The conversion between real and reciprocal space is carried out via a Fourier transformation[5]. Naturally, one can convert entire lattices from real to reciprocal space, yielding a reciprocal lattice. If a crystal has a lattice parameter a in real space, the corresponding lattice parameter in reciprocal space will be a*, which is calculated as shown in Equation 5. The reason to consider lattices in reciprocal space is to facilitate the analysis of the wave-like properties of a crystal with an infinite structure, such as its lattice vibrations[5].
— Equation 4[6]
— Equation 5[6]
To gain a more fundamental understanding of the nature of the wave-vector k, it useful to imagine the model of an infinitely long 1-D chain containing N identical atoms, each spaced by a length of a from the other. For now, only electronic interactions between atoms will be discussed. For the most simple case, one can assume that each atom is represented by a spherical s-orbital. It is apparent that the electrons in this model are subject to a periodically varying potential, which ultimately means that these electrons can be described by a periodic electron wavefunction. This concept is described as Bloch's Theorem (which is represented mathematically by Equation 6)[7]. Bloch's wavefunction (Ψk) describes the linear combination of the atomic s-orbitals (χn), where each s-orbital is multiplied by an exponential term to take into account the periodicity of the system. One can recognise that the λ term in the expression of the wave-vector k represents the crystal orbital wavelength (in the frame of electronic wavefunctions). In the case that k = 0, the chain crystal model illustrates a chain where all orbitals have the same phase (most bonding scenario). Although, as one diverges from k = 0 in either the positive or the negative direction, there will be more nodes present in the chain. The maximum value k can assume is ± π/a, describing the case with the most nodes (most anti-bonding scenario). The reason for the restriction on the values k can take (Equation 10) is elucidated in the paragraphs below.
— Equation 6[7]
The same principles described in the above paragraph for electronic interactions between atoms in an infinitely periodic 1-D chain can easily be applied to vibrational interactions between these atoms. Now, we are considering that each atom in the chain is an individual oscillator, and that all atoms are connected by bonds that behave like mechanical springs (Harmonic Oscillator Approximation, discussed in more detail in the sub-section below). If we think about the vibrational interactions (through which bonds are being compressed and extended) of single atom n in the chain with its nearest neighbours, we can express the force exterted on this atom from the vibrations, Fn, with Equation 7. In that equation, un is the displacement of atom n from equilibrium, un+1 and un-1 are the displacements of the nearest neighbours of atom n from equilibrium, and C is the force constant[5]. If one equates this equation to Newton's 2nd law (Equation 11), one arrives at the solution of the general form as shown in Equation 8[5]. This expression represents a propagating wave, in which every single atom in the chain oscillates with the same frequency ω and amplitude A about their equilibrium positions xeq. Equation 8 can be thought of as an analogy to the Bloch function in Equation 6, but for vibrational instead of electronic interactions between the atoms in the chain model. As for Equation 6, the exponential term in Equation 8 ensures for the periodicity of the oscillation. In the case that the wave-vector k= 0, all vibrations of the atoms in the chain are in phase. Although, if k=±π/a, each atom vibrates in opposite phase to its nearest neighbours.
— Equation 7[5]
— Equation 8[5]
From Equation 8, one can derive Equation 9, which establishes a relationship between the vibration frequency, ω (which is directly proportional to the energy of the vibration), and the wave-vector, k. This expression is known as the dispersion relation of the vibrational frequency. It is evident that the sine term in the equation accounts for the periodic nature of the system. As a further consequence of the periodicity, one notices that the frequencies for any one wave-vector k, and another wave-vector (k + 2π/a), are physically identical. This enables for the restriction of k values between -π/a and +π/a, which corresponds to the first Brillouin zone[8]. One can now take the chain-model described above further apply the same ideas to a 3-D lattice, where the first Brillouin zone is representative of a primitive crystal lattice located in reciprocal space[8].
In Equation 9, J is the force constant, M the mass per unit cell, k is the wave-vector and a is the lattice constant in real space.
— Equation 9[5]
— Equation 10[5]
Quasi-Harmonic Approximation
The most fundamental way to model particle vibrations is the Harmonic Oscillator Model, which considers chemical bonds to behave in the same way as springs do in classical mechanics. The model further assumes that these chemical bonds obey Hooke's Law[9] (Equation 9) for oscillations of small displacements, where F is the restoring force of the oscillation, k is the bond strength and x is the displacement from equilibrium. This means that the atomic vibration frequency, ω, and the potential energy at displacement x from equilibrium, V(x), are given by Equation 10 and Equation 11 respectively. Equation 11 conveys that under the harmonic approximation, the potential energy follows an ideally parabolic behaviour with respect to bond extension. This means that the model breaks down at high temperatures, where the bond is expected to eventually break. So evidently, the model does not take into account anharmonicity. It should also be noted that within the harmonic approximation model, the equilibrium distance is not considered to change with increasing temperature (where higher vibrational energy states are occupied). This makes the model unsuitable for the investigation of the thermal expansion of a lattice.
— Equation 11[9]
— Equation 12[9]
— Equation 13[9]
The quasi-harmonic approximation is based on determining the Helmholtz free energy, F (Equation 14). By looking at the expression which gives the change in Helmholtz free energy, dF, (Equation 15), one sees that dF is dependent on the change in volume of the system, dV, and the change in temperature, dT (hence: F = F(V,T)). The quasi-harmonic approximation determines the equilibrium volume for a fixed temperature, by minimising the free energy with respect to the temperature. In this model, the equilibrium distance is not considered to remain constant as temperature increases and is in fact allowed to increase with rising temperature. Thus, the quasi-harmonic approximation allows for the calculation of thermal expansions.
In Equation 15, p is the pressure of the system and S the (vibrational) entropy.
— Equation 14[10]
— Equation 15[10]
The U term in Equation 14 represents the internal energy of the lattice, whereas S is the vibrational Entropy of the system. The Helmholtz free energy can be expressed in terms of the partition function, q (Equation 17), where h is Planck's constant, k is Boltzmann's constant, and ωi the vibrational frequency. By substituting the equation for the vibrational partition function, qvib, into Equation 14, and by including the internal energy, U, one arrives at Equation 18. More specifically, the U term gives the interaction energy, which is modeled by a Buckingham Potential. In Equation 18, the second term stands for the zero point energy of the vibrations, whilst the third term represents the entropic contribution of the vibrations to the Helmholtz free energy. The indices j and k represent the number of branches and the number of k- points respectively.
— Equation 16[11]
— Equation 17[11]
— Equation 18[12]
Molecular Dynamics Model
Molecular dynamics simulations make use of Newtons 2nd Law of Motion (Equation 19), which states that the resultant force of an object, F, is equal the product of the object's mass, m, and its acceleration, a, to carry out computations about the MgO lattice. Indeed, the calculations work by giving the system a set of initial configurations (i.e. initial positions, r, and initial velocities, v)[13]. The initial ion positions will be set in accordance with those of an ideal MgO lattice, whereas the initial ion velocities are set randomly, but still approximately in correspondence to a thermal motion similar to that of the target temperature. Then, the configuration of the MgO lattice is continuously updated and recorded in constant time intervals, dt. This is concept of iteratively updating the lattice's configuration is shown mathematically by equations 20 and 21 below. Once the internal energy and the temperature of the system have settled, the collected data of the configurations at different time-steps is pieced together to model trajectories of the ions. These trajectories finally allow the software to generate time-averaged properties of the system.
— Equation 19[13]
— Equation 20[13]
— Equation 21[13]
The advantages of the molecular dynamics method include the fact that it fully describes the anharmonicity of the system, which is not the case for the quasi-harmonic approximation.
Methodology
The computational experiments were carried out on a Linux operating system. The interface DLV was used to visualise the MgO lattices. Once the lattice was displayed on the DLV interface, the calculations themselves were performed with the programme GULP, which uses lattice dynamics (and in given cases also molecular dynamics) to do simulations and optimisations . Each of the computations was completed including the ionic.lib option for the GULP potential, but without incorporating ionic shells.
Initial MgO Calculation
In the first step of the experiment, the free energy of a 1x1x1 primitive cell lattice of MgO was computed with the GULP programme. The temperature and the pressure were set to 0 K and 0 GPa respectively. The value of the internal energy of the lattice was obtained from the log file of the output of the simulation.
Calculation of MgO Phonon Modes & Density of States
Next, the GULP programme was used to perform a Phonon Dispersion calculation with 50 Npoints on the same MgO lattice with the same temperature and pressure settings as in the previous step. After the operation completed, the programme plotted and displayed the phonon dispersion curves.
Subsequently, the phonon density of states were computed with GULP for the same lattice dimensions as before (1x1x1), but for a variety of shrinking factors of k: 1x1x1, 2x2x2, 3x3x3, 4x4x4, 5x5x5, 8x8x8, 16x16x16 and 32x32x32. The DOS plot for each k shrinking factor was displayed and is presented in the Results & Discussion part of this report. It is noted that the changes in the DOS plots between the k gird sizes of 16x16x16 and the 32x32x32 were minimal.
Calculation of MgO Free Energy
After, the free energy of the MgO lattice was investigated for a range of k grid sizes: 1x1x1, 2x2x2, 3x3x3, 4x4x4, 5x5x5,8x8x8, 16x16x16, 20x20x20, 25x25x25 and 32x32x32. Given that these computations use the quasi-harmonic approximation, the higher the grid size, the more accurate the calculation of the free energy of the lattice. This is because of the quasi-harmonic approximation obtaining a value for the free energy of the lattice by summing the vibrational energies at each k- point. Thus, an infinite amount of k - points would provide the most accurate result possible for the free energy. This principle is discussed in further detail in the Results & Discussion section. However, the larger k grid size goes directly go hand in hand with a longer time required to complete the computation. In order to proceed in this experiment in the most efficient manner, it is necessary to determine the smallest k grid size that gives the same value for the free energy of the lattice, as if there were infinitely many k points. This ensures the highest degree of accuracy with minimal processing time.
The temperature for the simulations was set to 300 K, and the pressure was fixed to 0 GPa. As before a 1x1x1 MgO lattice was used. The values for the free energy for each k grid size was obtained by opening the log file from the respective simulation output. Through inspection of how the lattice free energy changes with increasing k grid size, one observes that the value is converged once a grid size of 20x20x20 was reached. For this reason, the grid size of 20x20x20 was chosen for the subsequent part of this experiment.
Thermal Expansion of MgO Simulation
In this section of the experiment, the thermal expansion of the 1x1x1 MgO lattice was explored. This was done by using the GULP programme to optimise the lattice structure and obtain values for the free energy for a variety of temperatures (0 K to 2900 K, in steps of 100 K). For the reasons described in section above, a k shrinking factor of 20x20x20 was used. The programme performed these calculations using the quasi-harmonic approximation.
Molecular Dynamics Simulations
For the last part of the computational expriment, an MgO supercell lattice was optimised with the GULP programme using the molecular dynamics method. Optimisations on the lattice were made for the temperature range between 100 K and 3000K, in increments of 100 K. The timestep was chosen to be 1 femtosecond, whilst the Equilibration and Production steps were both set to 500. The Sampling and Trajectory write steps were both configured to be 5. Lastly, the system was set up be an NPT ensemble, which signifies that the number of ions (N), the system pressure (P) and the temperature (T) were all set to be constant at each step of the optimisation.
Results & Discussion
MgO Phonon Modes & Density of States
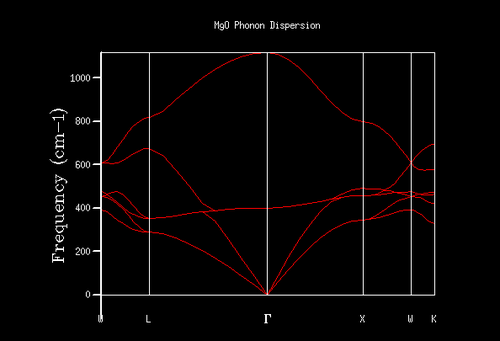
Fig.4 shows the phonon dispersion of the MgO lattice. As discussed in the Introduction section, in reciprocal space each k value corresponds to a specific vibration with a certain vibration frequency, ω. Indeed, this is what is shown in the phonon dispersion curve: a relationship between k values (x-axis) and vibrational frequencies (y-axis). The capital letters on the x-axis denote points of high symmetry in the Brillouin zone (so-called critical points)[8], where Γ is the origin of the plot and the centre of the Brillouin zone (k= 0 and ω= 0).
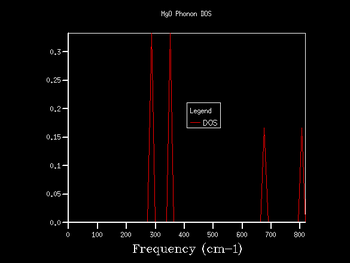
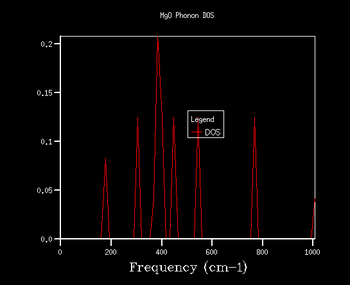
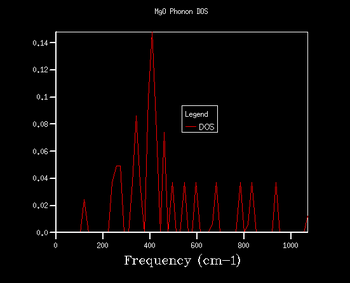
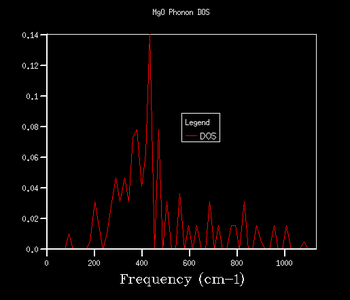
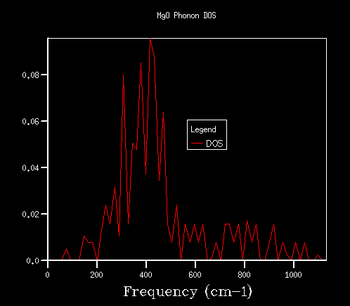
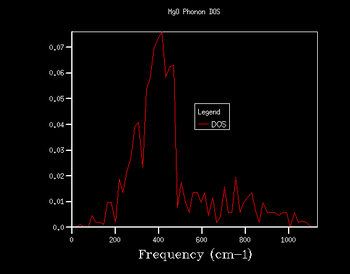
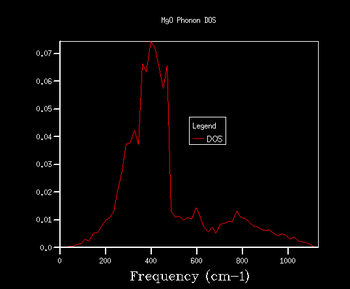
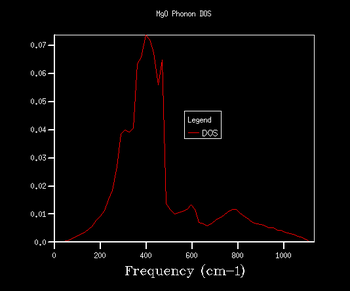
Table 1 displays the density of states (DOS) graphs for different k shrinking factors. The peaks in these plots are generated by summing over all the k- points at a certain vibrational frequency. One can think of this concept visually by imagining a vertical line on the phonon dispersion graph (corresponding to a specific frequency) and considering the points at which this line intersects the branches of the dispersion curve. One then sees whether that point of intersection happens coincides with a k point on the x-axis. This is done for all points on the dispersion curve for that particular frequency, and all of those points that coincide with k points are subsequently summed together and displayed on the DOS plot.
If one observes the density of states graph for a k shrinking factor of 1x1x1 (Fig.5), one finds that there are 4 such peaks. The first 2 peaks (at roughly 280 cm-1 and 360 cm-1) have a considerably higher intensity (~0.35) than the other 2 peaks (at roughly 680 cm-1 and 805 cm-1), which have intensities of approximately 0.17. The fact that the relationship between the intensities of the pairs of peaks is around 2:1 suggests that the vibrations responsible for the first pair of peaks are doubly degenerate. Upon examination of the phonon dispersion curve, one recognises that this description fits with the k point labelled L: to the right of the point L there are 4 branches (corresponding to the 4 peaks on the DOS plot). However, to the left of L, the bottom 2 branches split into 2 further branches each, depicting the double degeneracy of these vibrations.
Indeed, the output log file of the calculation contains a k point fitting with the description for L. The point has coordinates [0.5, 0.5, 0.5], and frequencies at 288.49 cm-1, 288.49 cm-1, 351.76 cm-1, 351.76 cm-1, 676.23 cm-1 and 818.82 cm-1. As one can see, there are 2 doubly degenerate vibrations (288.49 cm-1 and 351.76 cm-1) and 2 singly degenerate vibrations (676.23 cm-1 and 818.82 cm-1), as expected.
For these reasons, one can safely conclude that the k point for the 1x1x1 shrinking factor is located at the point L. Point L describes the centre of a hexagonal face in the first Brilloiun zone of an FCC lattice[8].
Table 1: Density of State Plots for Various Grid Sizes
Through further investigation of the DOS plots in Table 1, one sees that as the k shrinking factor increases, so does the range of the vibrational frequencies. Further, one observes how the plot becomes continuous for k grid sizes larger than 8x8x8. At even higher grid sizes, the continuous line of the curve starts to smoothen out. The expansion of the frequency range on the DOS plots with larger grid size is due to more k points being sampled: this means that there are more virbratonal frequencies that coincide with a k point and are displayed on the DOS graph. This is also the reason for the smoothing out of the DOS plot with larger k shrinking factors: the more k points are being sampled, the more points on the phonon dispersion curve are covered, so more frequencies are being taken into account of.
As explained in the Methodology section, it is of our interest to find the smallest k grid size that still produces the most genuine reflection of what the DOS actually looks like. This is in order to obtain the most accurate graph, whilst minimising the necessary computational power and time to generate the plot (the larger the grid size, inevitably the more time the calculation will take). By again evaluating the plots in Table 1, it becomes clear that for the grid sizes we have chosen, the k shrinking factor of 32x32x32 meets the set out criteria. Even though the changes between the plots of grid sizes 16x16x16 and 32x32x32 are minimal, there is still a slight smoothing out of the graph visible.
MgO Free Energy
Table 2: Helmholtz Free Energy against Grid Size Data
| k Grid Size | Helmholtz Free Energy (F/eV) | ΔF (Difference to converged Free Energy) /eV |
|---|---|---|
| 1x1x1 | -40.930301 | 0.002818 |
| 2x2x2 | -40.926609 | 0.000126 |
| 3x3x3 | -40.926432 | 0.000051 |
| 4x4x4 | -40.926450 | 0.000033 |
| 5x5x5 | -40.926463 | 0.000020 |
| 8x8x8 | -40.926478 | 0.000005 |
| 16x16x16 | -40.926482 | 0.000001 |
| 20x20x20 | -40.926483 | 0 |
| 25x25x25 | -40.926483 | 0 |
| 32x32x32 | -40.926483 | 0 |

Table 2 and Fig.13 illustrate how increasing the k grid size affects the value the programme calculates for the free energy of the lattice, up until a certain point. The data shows that the increasing k shrinking factors lead to a convergence of the lattice's free energy. In fact, by referring to Table 2, one notices that the free energy calculated does not change above a grid size of 20x20x20, converging to a value of -40.926483 eV. This observation was briefly mentioned in the Methodology section. This value is assumed to be the free energy that is expected if the k grid had an infinite amount of points.
One might anticipate the frequency peaks displayed onto the DOS plots to increase with the k grid size, as there are more k points being sampled. If there would be more k points at each specific frequency, one could imagine that the intensity of that frequency increases on the DOS graph. However, this is not the case, since the summation of the k points at each frequency is normalised (i.e.: each k point contribution is multiplied by a factor of 1/n during the summation, where n is the number of k points at the frequency in question). As a consequence of this normalisation, the total area under a DOS graph is always equal to 1.
Apart from showing the data for k grid size and corresponding free energy, Table 2 also contains a column containing the difference of the free energy from the converged free energy value. This data enables us to make the observation that the 2x2x2 grid size provides an accuracy of the free energy (relative to the converged energy) to 1 meV, as well as to 0.5 meV. The 3x3x3 grid size was accurate to 0.1 meV.
It is interesting to consider whether the optimal k grid size would be different for other crystal structures than MgO. We will be contemplating this for the lattices of CaO, Faujasite and Lithium. For this investigation, it is important to first reflect on how the sizes of these crystals compare to MgO in reciprocal space. By refering to Equation 5, it is clear that the lattice constant in real space, a, is inversely proportional to the lattice constant in reciprocal space, a*.
If we first consider CaO, we expect its structure to be inhernetly similar to that of MgO. This means that CaO's lattice constants will not be massively different that of MgO in real space (and hence reciprocal space). So, it can be assumed that the 20x20x20 grid size would be suitable to get the same accuracy for the free energy calculations for CaO as we did for MgO.
The structure of the mineral faujasite, on the other hand, is known to have a rather large and complicated framework, containing sodalite cages and pores[14]. It can therefore be deduced that faujasite's lattice parameter in real space is larger than that of MgO, which in turn means that its a* value will be presumably relatively small (and definitely smaller than that of MgO). For this reason, faujasite needs a considerably smaller k grid size than MgO to cover more parts of its phonon dispersion curve to obtain an accurate result for the free energy.
For the last considered material, lithium, the opposite can be said than to faujasite: Li will have a more compact structure than MgO in real space, which leads to Li possessing a larger lattice constant in reciprocal space than MgO. Thus, lithium will need a larger grid size than the 20x20x20 one used for MgO to get valid results for the computations of it's free energy.
Thermal Expansion of MgO
 |
 |
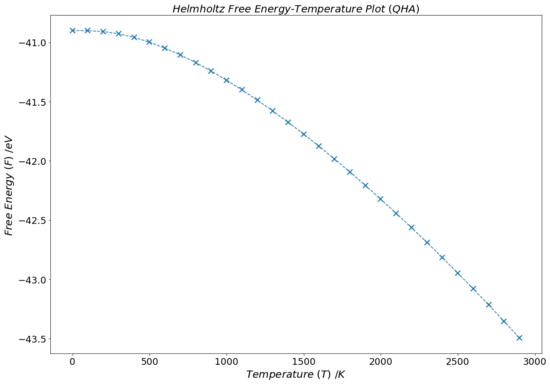
The graph in Fig.14 illustrates how the free energy of the MgO lattice decreases with rising temperature under the quasi-harmonic approximation. For the most part, the graph shows a negatively linear dependence of free energy with temperature. This can be rationalised by thinking about Equation 14: as the temperature of the lattice is increases, the TS term becomes larger and evermore negative. This growing negative contribution to the Helmholtz free energy ultimately leads to a decrease in F that is linearly dependent on T. Although, this includes the assumption that the vibrational entropy term, S, does not vary strongly with increasing temperature.
However, at lower temperatures (~ 0-400 K) the plot in Fig.14 is fairly flat and is seemingly independent of temperature changes. This agrees with the theory conveyed by Equation 18: at low temperatures, the first two terms of the expression (the internal energy of the lattice and the zero point vibrational energy, both of which are temperature independent) have a dominating contribution to the free energy. As T increases, the third term of the equation becomes more and more dominant until the roughly linear dependence starts to act at about 700-800 K.
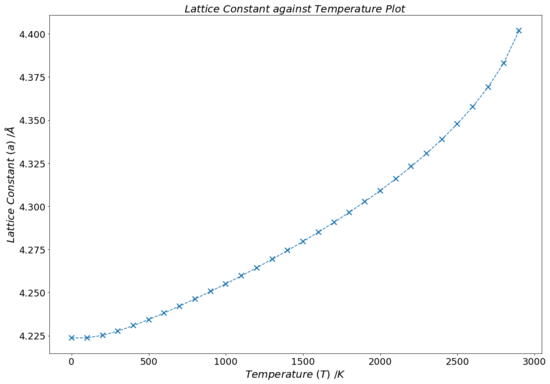
Fig.15 contains a plot that presents how the conventional unit cell lattice parameter, a, changes with increasing temperature within the frame of the quasi-harmonic model. The output log file of the calculations contain the volume of the primitive unit cell of MgO. With the help of Equation 1, this can be converted into the volume of a conventional MgO unit cell, which can be cube-rooted to obtain the lattice parameter. Overall, a very clear and, for the most part, positively linear behaviour is visible on the graph. This is hardly a surprise, as one expects the ions within the lattice to have more thermal energy at higher temperatures, causing them to vibrate more, extending the average inter-ionic distance between them. Although, it is visible that at higher temperatures (above ~ 2000 K), the roughly linear trend of the graph breaks down. This can be attributed to the fact that, as mentioned in the introduction, the quasi-harmonic approximation does not take into account the anharmonicity that occurs at elevated temperatures.
The lattice constant against temperature graph in Fig.15 appears to also be rather flat at low temperatures (~ 0-250 K) and does not fit the trend of the rest of the plot. This is due to the fact that the lattice constant of the cell, a, at a specific temperature is determined from its volume, V, which in turn is computed from the Helmholtz free energy, F, which was minimised with respect to the volume in the frame of the quasi-harmonic approximation (Equation 15 and Equation 18). As elaborated upon before, the free energy mainly depends on the internal lattice energy and the zero point energy of the system at low temperatures (first two terms in Equation 16 dominate). That is why the variation of the lattice parameter seems to be temperature independent for low T values: the free energy of the lattice, F is hardly affected by temperature changes when T is small, so any change in volume of the lattice, dV (which is directly related to dF, Equation 16, and determined by minimising F) is minimal at low temperatures. If the change of the lattice volume is small/negligible, so will be the change of the lattice constant (since the two quantities are directed related to each other by a cubic relationship, V = a3).
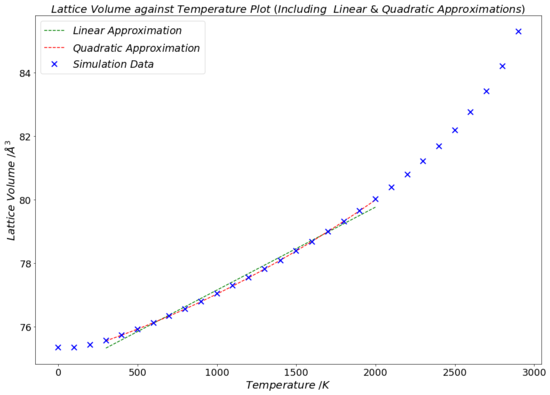
Table 3: Equations for the Linear and the Quadratic Fitting of Lattice Volume against Temperature Data (Quasi-Harmonic Model)
| Linear Fitting for V(T)
(Quasi-Harmonic Model) |
Quadratic Fitting for V(T)
(Quasi-Harmonic Model) |
|---|---|
| V(T) = 0.00261T + 74.54501 | V(T) = 5.02488 x 10⁻⁷T2 + 0.00146T + 75.07430 |
Table 4: Values of the Thermal Expansion Coefficient from the Computational Experiment and Literature
| α (300 - 2000 K) /K-1
From Simulation |
α (300 K) /K-1
Literature[15] |
α (1000 K) /K-1
Literature[15] |
α (2000 K) /K-1
Literature[15] |
|---|---|---|---|
| 34.6 x 10⁻⁶ | 31.2 x 10⁻⁶ | 44.7 x 10⁻⁶ | 53.3 x 10⁻⁶ |
The thermal expansion coefficient of MgO can be determined form the data presented in the lattice volume-temperature plot in Fig.16 with the use of Equation 3. By calculating the gradient of the line of best fit of the linear section of the V-T plot (giving dV/dT) and dividing that by the initial volume, V0, one gets the value for α predicted by the computations based on the quasi-harmonic approximation. V0 was selected to be the volume of the first point used to calculate the gradient of the linear fit of the curve (i.e.:V when T = 300 K), which was equal to 75.5601 Å3. The linear best fit line (the green line in Fig.16) was drawn between the temperatures of 300 K and 2000 K, since the literature source which was used for comparison contained α values for MgO in this temperature range. The mathematical equation of the linear fit line is displayed in Table 3, and its gradient (dV/dT) was computed to equal to 0.00261 Å3K-1.
Table 4 gives the computed α value form the simulation, compared to α values from the literature at selected temperatures (300 K, 1000 K and 2000 K). It is noted that for the experimental data presented in the literature, α appears to increase with temperature. The origin of this is the fact is that in reality, the bonds in the lattice behave more and more anharmonically with increasing temperature. This anharmonic behaviour means that the inter-particle bond extensions are not anymore proportional to the restoring force of the oscillations[9]. When comparing the data within Table 4, one sees that the computational α value is well within the range of the experimental data, and that it is particularly close to the literature value at 300 K.
However, there are evident deviations from our computed thermal expansion coefficient to the literature values for α at 1000 K and 2000 K (Table 4). These deviations are most likely attributable to the assumption the quasi-harmonic approximation makes, that the volume increase of the cell is linear with rising temperature. Due to anharmonic effects, this is not true. For this reason, the rate of change of volume with regard to temperature, dV/dT, will not be constant in reality as temperature rises. Indeed, in Table 4 there seems to be the trend that the deviation of the computational result from the experimental literature values increases with rising temperature. This could very well be due to the aforementioned assumptions becoming less feasible at higher temperatures, as the anharmonic contributions and effects become more pronounced and prevalent when the temperature is elevated.
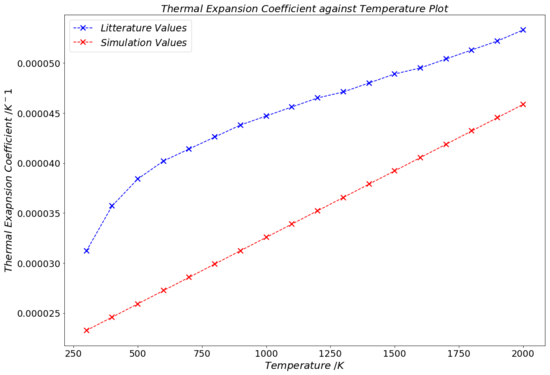
Table 5: Thermal Expansion Coefficient Equation derived from Computational Data (Quasi-Harmonic Model)
| Fitted Equation for α(T)
(Quasi-Harmonic) |
|---|
| α(T) = (2 x 5.02489 x 10-7T + 0.00146)/75.56010 |
Until now, only the use and results of the linear fitting of the lattice volume-temperature plot were discussed. As explained, in reality the thermal expansion coefficient increases with rising temperature. This suggests that perhaps fitting the data to a quadratic polynomial function (for the same 300-2000 K temperature range, as before) may be more adequate. The quadratic fitting is seen on Fig.16 by the red curve, and the mathematical function of the curve is given in Table 3. Taking the derivative of this expression for V(T) with respect to T yields and equation for the rate of change of the lattice volume relative to a temperature change, dV/dT. Dividing this differential expression by the initial volume, V0 (still taken to be 75.5601 Å3), one arrives at an expression which gives the thermal expansion coefficient, α, as a linear function of temperature. The equation for this is given in Table 5.
The graph in Fig.17 displays the experimental data (blue), as well as the α(T) function obtained from simulation data (red) with the method described in the last paragraph. It is immediately obvious that there are not points whatsoever between the two graphs that overlap or coincide, albeit all points being in the same order of magnitude. This strongly indicates that the computational results are quite flawed, but still give rough estimates (within ~ 17-51% of the experimentally measured data) for α.
The deviations from the experimental literature values are so much more visible and evident in the plot of Fig.17 than in the numerical result from the linear fit. The reason for this is the fact that on the graph, one is able to compare the individual α values for each temperature to those from the literature. The linear fit method in contrast, solely gives a single value for the thermal expansion coefficient for a range of temperatures.
If one were to consider a simple diatomic molecule (such as H2) that behaves like an ideal harmonic oscillator (as described mathematically by equations 11, 12 and 13), its potential energy, V(x), against bond extension, x, plot would have the shape of a conventional parabola. This signifies that whist the bond length, x, does extend with increased temperature (and thus increased bond vibrations) under this model, the equilibrium bond length, xeq (which is the bond length that satisfies the condition given by Equation 22) does not vary. Equation 22 essentially states that when the atoms are at a distance xeq apart, the oscillating restoring force is equal to 0 (dV/dx = 0). For the quasi-harmonic approximation, however, the shape of the potential well does change with rising temperature, which leads to xeq also changing and indeed increasing. This allows us to investigate thermal volume expansions under the quasi-harmonic, but not under the harmonic approximation.
— Equation 22[9]
Molecular Dynamics

Fig.18 shows how the volume of the MgO lattice (for a conventional unit cell) changes with increasing temperature under the quasi-harmonic approximation, as well as under the molecular dynamics model. As mentioned before, the quasi-harmonic model and the molecular dynamics method respectively give the volume of MgO as a primitive cell and a supercell. To convert these volumes into the volume of an equivalent conventional cell, equations 1 and 2 are used.
The way in which the molecular dynamics method functions was briefly discussed in the introduction: equations of Newtonian motion (equations 19, 20 and 21) are used to repeatedly update the ions' positions and velocities in specific time intervals until the system equilibrates. All physical quantities (such as lattice's internal energy or volume) are calculated from the average kinetic motion and vibrations of the ions. Consequently, the more ions there are in the system that contribute to this calculation of the average energy, the more reliable the output result will be. In fact, this is exactly why an MgO supercell is utilised for the molecular dynamics optimisations: the 2 ions in a primitive unit cell most certainly are not enough to compute an accurate statistical average for the lattice's energy. To circumvent this issue and provide more statistical accuracy, the supercell with 32 ions is used instead.
The graph in Fig.18 compares how the volume of the lattice expands with temperature under the molecular dynamics model and under the quasi-harmonic approximation. We can see that for the region between about 500 K and 1100 K, the two models strongly agree with one another. Although, form about 1500 K onward, the two curves start to diverge from each other. This temperature of 1500 K coincides with the point at which both of the graphs stop being linear. However, the underlying reason because of which the plots cease to be linear are different. As explained in the last sub-section of this report, the quasi-harmonic approximation does not regard anharmonicity, that has a substantial effect at elevated temperatures. The molecular dynamics calculations, on the other hand, break down at high temperatures due to the sheer amount of thermal energy possessed by the ions. This energy goes hand in hand with more and stronger vibrations, which cause more fluctuations between each step in the computation that determines the new positions and velocities of the ions. This issue could be solved by either using a lattice with even more ions to get a clearer statistical average and minimise the impact of these fluctuations, or by choosing a smaller time interval, dt, between each step.
Further, there is a slight disagreement visible between the curves in the lattice volume-temperature plot (Fig.18) at about 100 - 200 K. It was discussed in the Thermal Expansion of MgO sub-section, that the lattice constant is almost entirely unaffected by temperature at low T values. This was due to the internal energy and the zero-point energy terms being the dominant contributors to the free energy at decreased temperature. Since the lattice constant and the volume of the lattice are directly related to each other (for conventional unit cells, the volume is equal to the lattice parameter cubed), one would expect the same trend to hold true for the lattice volume at low temperatures. This is confirmed by the plot in Fig.18. The molecular dynamics data plot, however, has no reason to deviate from linearity at low temperatures. This, again, agrees with what we see on the graph.
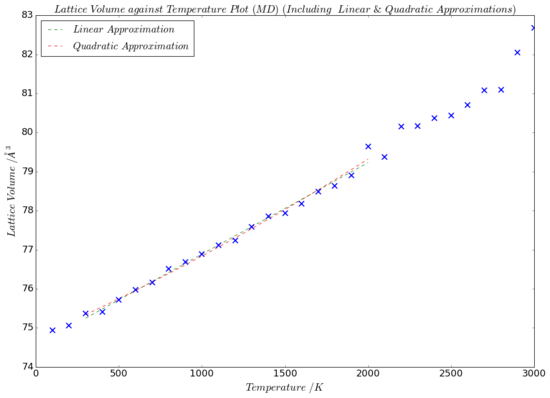
Table 6: Equations for the Linear and the Quadratic Fitting of Lattice Volume against Temperature Data (Molecular Dynamics)
| Linear Fitting for V(T)
(Molecular Dynamics Model) |
Quadratic Fitting for V(T)
(Molecular Dynamics Model) |
|---|---|
| V(T) = 0.00234T + 74.54461 | V(T) = 1.98328 x 10⁻⁷T2 + 0.00189T + 74.75351 |
Table 7: Values of the Thermal Expansion Coefficient from the Computational Experiment and Literature
| α (300 - 2000 K) /K-1
Simulation (QHA) |
α (300 - 2000 K) /K-1
Simulation (MD) |
α (300 K) /K-1
Literature[15] |
α (1000 K) /K-1
Literature[15] |
α (2000 K) /K-1
Literature[15] |
|---|---|---|---|---|
| 34.6 x 10⁻⁶ | 31.2 x 10⁻⁶ | 31.2 x 10⁻⁶ | 44.7 x 10⁻⁶ | 53.3 x 10⁻⁶ |
The lattice volume against temperature data for the molecular dynamics results was linearly and quadratically fitted between 300 K and 2000 K (green and red lines respectively on Fig.19), similarly as was done for the results obtained with the quasi-harmonic approximation. Since the graphs of the two different fitting methods strongly overlap, it is difficult to distinguish them on the plot. The expressions for the linear and quadratic functions of the fittings are given in Table 6. As before, the gradient of the linear best-fit line (dV/dT = 0.00235 Å3K-1) and the initial volume of this line (V0 = 75.40519 Å3) were used in line with Equation 3 to calculate the thermal expansion coefficient, α, as predicted by the molecular dynamics method. The result for this, together with the α from the quasi-harmonic approximation and literature values, are presented in Table 7.
One can see that form the linear fitting method, the value predicted for α by the molecular dynamics model is very similar (within 10%) of that determined with the quasi-harmonic approximation. Any discrepancy between these values may be rationalised by reflecting on the lattice volume against temperature plots in Fig.19. For each model, the same temperature region (300-2000 K) was used to generate a linear line of best fit, of which the gardient, dV/dT, was used to calculate α. From Fig.18, it is evident that the plot from the quasi-harmonic approximation curves up faster than the molecular dynamics plot dos between 1500 K and 2000 K. Because of this, the line of best fit for the quasi-harmonic plot is anticipated to have a larger gradient. This is very much confirmed by comparing the functions for the linear lines of best fit of the quasi-harmonic and the molecular dynamics model: 0.00261 (Table 3) vs 0.00234 (Table 6), respectively. Given Equation 3, which shows a direct proportionality between dV/dT and α, it makes sense that the model with the best fit line with the larger gradient (which in our case is the quasi-harmonic model) will produce a larger value for the thermal expansion coefficient.

Table 8: Thermal Expansion Coefficient Equation derived from Computational Data (Molecular Dynamics Model)
| Fitted Equation for α(T)
(Molecular Dynamics) |
|---|
| α(T) = (2*1.98328 x 10-7T + 0.00189)/75.40519 |
Using the same mathematical principles as earlier, the quadratic function that fitted the lattice volume against temperature data for the molecular dynamics model (second column in Table 6) was differentiated with respect to T and divided by V0 to generate a linear expression that gives α as a function of T (Table 8). This α(T) function was plotted in Fig.20, next to the α(T) function from the quasi-harmonic data (Table 5) and the experimental literature data.
Even though the data in Fig.18 and Table 7 allows us to make comparisons between the molecular dynamics and the quasi-harmonic approximation models, they do not convey much about their validity with respect to the experimental data. Fig.20 enables us to directly compare our computational data from both models to the experimental data recorded in the literature. It appears that until 700 K, the values for the thermal expansion coefficient function from the molecular dynamics model are closer to the literature values. However, from 700 K onward, the α(T) function from the quasi-harmonic approximation agrees more with the experimental literature values. Whilst never actually overlapping with the literature data, the quasi-harmonic approximation α(T) function seems to overall follow a very similar trend as the literature values.
Conclusion
The programme GULP was used to perform a variety of simulations and optimisations on an MgO lattice.
By plotting and analysing a phonon dispersion graph for a primitive MgO unit cell with a 1x1x1 k grid size, it was determined that the k point was located on high-symmetry point L. Further, by increasing the k shrinking factor and investigating the corresponding density of states plot, we concluded that the 32x32x32 grid size gave the most accurate representation. However, by examining how the Helmholtz free energy changes relative to an increasing grid size, it became obvious that a 20x20x20 k grid size would sample sufficiently many k points to give the most accurate result possible by the GULP programme, whilst minimising the used computational power.
Having determined a suitable k grid size, the thermal expansion coefficient of MgO was calculated for the temperature range of 300-2000 K under the quasi-harmonic, as well as the molecular dynamics model. This was done by computing the gradient of the linear fit of the lattice volume against temperature data of each model. The α values generated for the quasi-harmonic and molecular dynamics method respectively were 34.6 x 10⁻⁶ K-1 and 31.2 x 10⁻⁶ K-1. This was found to approximately coincide with values found in the literature.
From the lattice volume temperature plots of the data from both methods, it was evident that the quasi-harmonic and the molecular dynamics models strongly agreed with each other between the temperatures of about 500-1100 K.
Additionally, quadratic fits were done for the lattice volume-temperature data from each of the two methods. From these quadratic fits, expressions for α as a linear function of temperature were obtained and plotted against experimental literature data. This plot suggested that the molecular dynamics model agreed more with the experimental data at temperatures below 700 K, whereas the quasi-harmonic approximation data seemed to be closer to the literature values for temperatures above 700 K. Also, it appeared that the quasi-harmonic data generally agrees more trend-wise with the literature data.
References
- ↑ Paul, Tipler, Gene Mosca, Physics for Scientists and Engineers, W.H. Freeman, New York, 6th edn, 2007, pp. 667-669
- ↑ M. Blackmann, Proc. Phys. Soc., 1957, 70, 827-832
- ↑ J.R. Davis, K. Ferjutz, N. D. Wheaton, ASM Handbook Vol.6: Welding, Brazing and Soldering: Welding, Brazing and Soldering, ASM International, Ohio, 10th edn, 1993, vol.6
- ↑ D.L. Turcotte, G. Schubert, Geophysics, Cambridge University Press, Cambridge, 2nd edn, 2002, ch. 5, pp. 245
- ↑ 5.0 5.1 5.2 5.3 5.4 5.5 5.6 5.7 O.Manasreh, Introduction to Nanomaterials and Devices, John Wiley & Sons, Inc., Hoboken, NJ, USA, 2011, Appendix G: Lattice Vibrations & Phonons, p.445-455
- ↑ 6.0 6.1 W.Cochran, Rep. Prog. Phys., 1963, 26(1), 1-45
- ↑ 7.0 7.1 R. Hoffmann, Angew. Chem. Int. Ed., 1987, 26(9), 846-878
- ↑ 8.0 8.1 8.2 8.3 T.H. Hsieh, H. Lin, J. Liu, W. Duan, A. Bansil, L. Fu, Nat. Commun., 2012, 3, 1-7
- ↑ 9.0 9.1 9.2 9.3 9.4 9.5 P. Atkins, J. de Paula, in Atkins' Physical Chemistry, W.H. Freeman and Company, New York, 8th edn, 2006, ch. 9, pp. 290-295
- ↑ 10.0 10.1 P. Atkins, J. de Paula, in Atkins' Physical Chemistry, W.H. Freeman and Company, New York, 8th edn, 2006, ch. 3, pp. 95-102
- ↑ 11.0 11.1 P. Atkins, J. de Paula, Elements of Physical Chemistry, Oxford University Press, Oxford, 5th edn, 2009, ch. 22, pp. 526-531,
- ↑ C. Chang, W.Chen, M. K. Gilson, J. Chem. Theory Comput., 2005, 1(5), 1017–1028
- ↑ 13.0 13.1 13.2 13.3 S.Yip, R. Car, F. de Angelis, P. Giannozzi, N. Marzari, Handbook of Materials Modeling, Springer, Amsterdam, 2005, ch.1.4, pp. 59-76
- ↑ G. Bergerhoff, W.H. Baur, W. Nowacki, Neues Jahrb. Miner. Monatsh., 1958, 1958, 193-200
- ↑ 15.0 15.1 15.2 15.3 15.4 15.5 O.L. Anderson, K. Zou, J. Phys. Chem. Ref. Data, 1990, 19(1), 69-81

