Rep:PS4615 - The Free Energy and Thermal Expansion of MgO
Abstract
The Helmholtz free energy and the thermal expansion coefficient of MgO were determined computationally using the software GULP, . Lattice dynamics and molecular dynamics were used to carry out such calculations with the NPT ensemble used. The phonon dispersion and density of states of MgO at different temperatures were determined by lattice dynamics to calculate the thermal expansion coefficient at zero pressure. The coefficient was found to be for lattice dynamics, for molecular dynamics, comparing to from J. Zhang[1] and from Rao et al[2].
Introduction
Vibrations in Solids - Lattice Dynamics
Vibrations in solids is an essential phenomenon that determines many of its thermodynamic properties. This includes its heat capacity, thermal expansion, thermal conductivity, free energy and many more. Instead of thinking solid crystals as a rigid material, they should be thought of as dynamic structures, as even at zero kelvin, there are still vibrations within itself. These lattice vibrations can be interpreted as both waves and particles (analogous to wave-particle duality). A quantum mechanical unit of these vibrational particles is called a phonon (analogous to photons).
Considering that a standard solid material is made of regular lattice of atoms, ions or molecules, it can be expected their vibrations will be associated with certain energies depending on the modes of the vibrations itself. Since they are bonded together with attractive forces, one of which could be electrostatic attractions, they cannot be vibrating freely but can propagate throughout the lattice. These vibrations have different modes that have specific wavelengths with specific energies associated with it. Each of the modes can be fundamentally thought of as a phonon, and the energies of phonons are quantised (). Since these vibrations have specific frequencies and wavelengths, it is useful to define the wavevector (wavenumber for one dimensional case) as , where is the characteristic wavelength of a vibrational mode. See figure 1 and figure 2 for the visualizaitons of phonons.
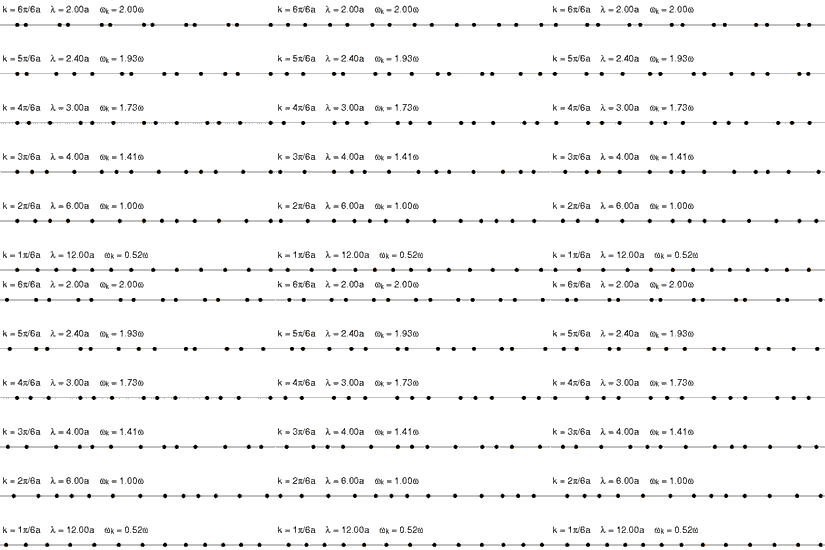
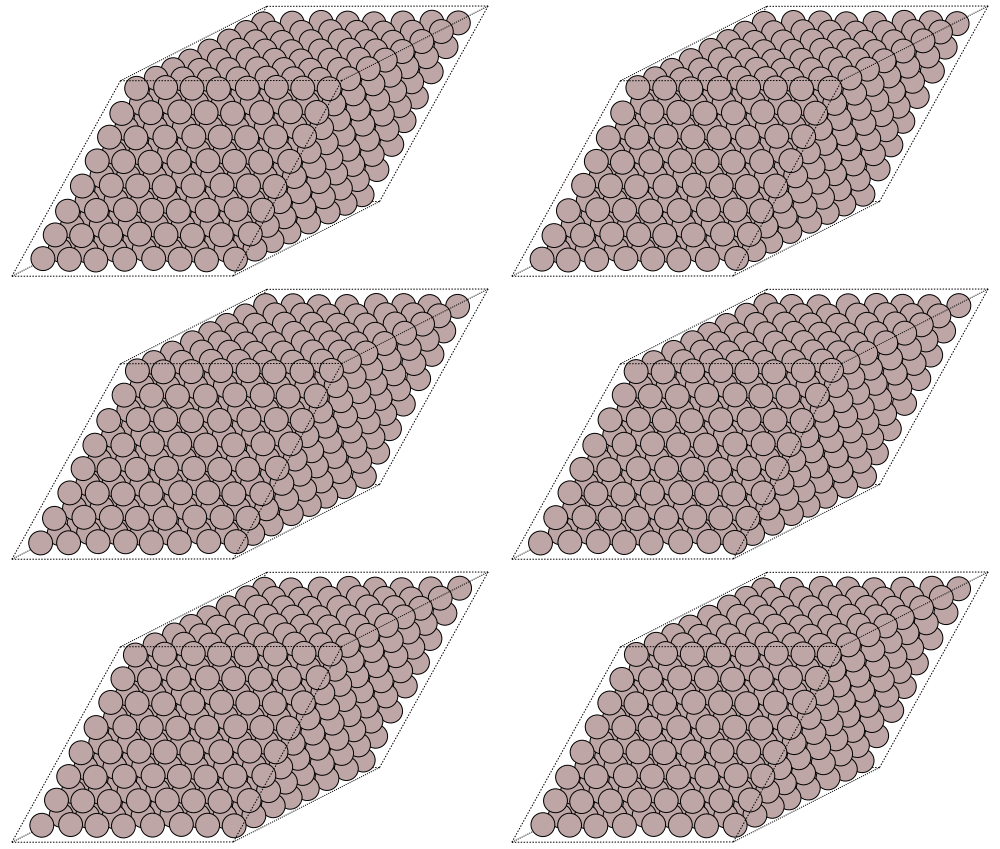
One way of interpreting the wavevector is to think of them as the phonon momentum, where . Although, phonons itself does not physically carry momentum, but it does have particle-like properties. One important example of this is that phonons interact with particles such as neutrons. This is important as it is one of the methods of obtaining dispersion curves experimentally. Essentially, when the neutron is scattered by a solid like MgO, it absorbs or emit energy equals to the energy of phonons. The difference in the energy of the scattered and the incident neutron can be used to construct dispersion curves. This method is called Inelastic Neutron Scattering[5].
The dependence of the frequency (hence the energy), , on the wavevector is called the phonon dispersion.This is characteristic of different solid materials as they depend on the lattice parameters, interaction energies and types, and others.
The relationship of the frequency with the wavevector for one dimensional monoatomic solid lattice is as follows:
(1) [6]
where is the interaction constant between the bonds, is the mass of the particle and is the internuclear separation between the neighboring particles. Although, the relationship is different for diatomic one dimensional solid lattice. The relationship is as follows:
(2) [7]
where and represents the masses of the different particles in the lattice. Depending on the sign of in equation (2), it is obvious that there are two different solutions that correspond to two different dispersion curves. It can be seen that as the number of different particles increases, the number of branches also increases linearly. In addition, increasing the dimension of the lattice also has the same effect. It can be simplified such that the total number of branches is as follows:
(3)
where is total number of branches, is the dimension of the lattice and is the number of different particles in the solid. For the modelling of MgO in three dimensional lattice, 6 branches are expected to be observed in the phonon dispersion plot. The branches is expected to look differently (except at where - This point is known as ), although some regions of the branches can be degenerate. Assuming that the solid has no defects and repeats itself periodically, the phonon dispersion can be reduced to the regions where . This is because the frequency and the displacement of the atoms do not change, as . It is worth noting that the number of vibrational modes of the lattice is directly proportional to the number of atoms in it. This explains why branches of frequencies are observed instead of quantised energy levels, as infinite periodic lattice is used to describe the arrangement of the particles in solids.
The sum over all the different branches () and all the different wavevectors () in each branch represents the free energy (Helmholtz for the below equation) of the solid crystal lattice. From statistical thermodynamics, the free energy of the crystal lattice system can be computed as follows:
(4)[8]
where the is the lattice energy of the solid. The free energy can be calculated from the frequency of the different modes of vibrations but not explicitly from the wavevector itself. Hence, one way to perform the summation in equation (4) is to generate a list of frequency values for a grid of wavevectors from the dispersion plot (shrinking factor indicates the grid size for this experiment). If the grid is sufficient enough to represent all of the frequencies in the dispersion plot, a histogram of frequency values can be generated. This is also called the density of states. To calculate the total energy from the density of states plot, the following equation is used instead of equation (4):
[9] (5)
where is the density of states. This shows that the only thing needed here is the density of states to calculate the total energy.
From equation (4), different thermodynamic properties can be obtained. Although, quasi-harmonic approximation must be used to calculate the interested property, thermal expansion. To calculate the thermal expansion coefficient of a material at constant pressure , the following equation can be used:
(6)[10]
Quasi-Harmonic Approximation
The Buckingham repulsive potential is to describe the interaction between and in the lattice of MgO. This interaction between the ions can be expanded around the bond distance at the minimum energy as follows:
(7)
Using the first two terms from the expansion in (7) (Harmonic approximation) is actually sufficient to describe many features of the lattice (this gives the total energy expression described in equation (4)), including the link between vibrational frequencies, wavevector and interactomic forces, and many thermodynamic properties of solid materials. Although, this is not enough to calculate some of the other properties, including the thermal expansion, thermal conductivity, and other behavior such as phase transitions. Including some of the anharmonic terms from (7) can account for these properties. This is called the Quasi-Harmonic approximation, which was used in the lattice dynamics simulations carried out in this experiment to calculate free energies and thermal expansions of MgO at different temperatures at zero pressure. Essentially, the harmonic approximation is still retained, but the force constants of the interaction and the equilibrium bond length now varies when volume is changed. As a result, this causes the frequencies of the vibrational modes to shift due to the change in volume. This is called the anharmonic shift and is observed in the simulations carried out. Since now that the Quasi-Harmonic approximation has introduced the dependence of the frequencies on volume, the equation (4) must be modified to account for this:
(8)[11]
The model breaks down at high temperature. This is due to the fact that the Quasi-Harmonic approximation does not take into account of the bond breaking of the atoms. Hence, the values for the volume expanded at different temperatures is expected to deviate from experimental data and the data obtained from molecular dynamics model.
Molecular Dynamics
The molecular dynamics model takes a different approach in computing the thermal expansion of MgO compared to lattice dynamics. Molecular dynamics uses classical Newtonian mechanics to compute the forces between the atoms, using also the Buckingham potential to describe the interactions. Another important difference in the two models is that molecular dynamics does not carry out the calculations based on the confinement of the atoms at the lattice points (unlike lattice dynamics). The atoms here are free to move around so that optimization can be calculated. The algorithm used in this method is set up such that it optimizes the mechanical energy (kinetic and potential energy combined) so that it reaches the minimum and compute the average characteristic values (e.g volume) for different conditions. The model uses the Verlet algorithm to compute and optimize the energies and positions of the atoms in the materials. The following are the main steps in the algorithm:
1. Specify the initial conditions. For this experiment, the initial position of the atoms is when all the atoms are at the lattice points in the supercell. 2. Increase the time by (this is the timestep) and calculate the forces. 3. Calculate the resultant velocity of the atoms from the acceleration of the forces calculated (from Newton's Second Law of Motion) . 4. Update the positions of the atoms . 5. Calculate the average energies of the new configurations of atoms. 6. Go back to step and and carry out the cycle again.
Since the equilibrium positions of the atoms are optimised at different temperatures, this can be used to calculate the equilibrium volume of the lattice at different conditions, allowing the thermal expansion coefficient to be calculated. There are many advantages and disadvantages to this model. One advantage is that the model allows greater flexibility in which the atoms can move around. And since the exact potential (not harmonic approximation) is used to calculate the forces, this allows the dynamics of the atoms to be calculated at temperatures around and even after the melting point of the material. In fact, it can be used to determine thermodynamic properties of solids melts, and many others. Although, the simulation breaks down at low temperatures for this simulation. At zero temperature, the simulation is expected not to work.
Thermal Expansion
Thermal expansion is the tendency of materials to expand in respond to an increase in temperature. Fundamentally, this is resulted from the increase in the average separation between atoms in the material itself. If the interaction between the atoms are purely harmonic, this would not have been observed at all. For instance, in a diatomic molecule with an exactly harmonic potential, its equilibrium bond length would not change at all as temperature increases. This is due to the symmetric property of the harmonic potential, where populating the higher energy states of the potential would leave the equilibrium bond length the same. For this experiment, since the quasi-harmonic approximation is used to model the interactions between the ions in MgO lattice, thermal expansion is expected to be observed. Including the anharmonic terms from the Taylor's expansion shown in equation (7) in the interaction potential breaks the symmetry of potential used. Since increasing the temperature increases the population of the higher energy states in the potential, the equilibrium 'bond' length of the ions in MgO increases, resulting in thermal expansion.
Method
Lattice Dynamics of MgO
For the lattice dynamics simulation of MgO, the primitive unit cell of MgO structure was used to compute the relevant properties. As periodic boundary conditions was used, using the conventional or supercell (or other lattice size) should give the same results due to the symmetric nature of the lattice. This is not the case for other methods found in literature which will be further discussed in the results and discussions section.
The potential used to compute the interactions between the and is the Buckingham potential :
[12] (9)
where and are constants. In addition, the lattice parameters used for MgO lattice is as follows:
Unit cell type: Primitive unit
Lattice type: Face-centered cubic structure (FCC)
Cell vectors: 0.0000   2.10597  2.10597
              2.10597  0.0000   2.10597
              2.10597  2.10597  0.0000
Phonon Dispersion
The phonon dispersion curve was computed for MgO (see figure 3). One reason for this is to visualize all the vibrational modes of the solid lattice. It is not possible to this in a single plot in real space. Hence, it must be plotted in the k-space. Also, as mentioned in the introduction section, the dispersion plot was further used to create the density of states.


By comparing figure 3 and figure 4, it can be seen that the shape of the dispersion plots obtained from the software GULP and literature are similar. Although, it must be noted that many regions in the dispersion plot showed some differences. One of the obvious regions is between the region and ( and for literature), where some of the branches seemed to be degenerate but is suppose to have different frequencies based on literature. One possible way of improving this is to use more k-points (Npoint) to compute the phonon dispersion to increase the resolution. Although, the differences may have been because of the intrinsic model used by GULP to calculate the dispersion.
Density of States (DOS)
The number of samplings taken from the dispersion curve to build the DOS plot is determined by the shrinking factor. Since the full analytical integration across the First Brillouin zone (FBZ) is not possible, the integral can be approximated by numerical integration. This is done by calculating the phonon frequencies at a grid of points (specified by the shrinking factor) across the FBZ and summing the values at each point. The resulting plot will then be normalized and the density of states is obtained. Essentially, as the spacing between the grid decreases to zero, it reaches the true DOS. Each numbers on the shrinking factor represents each reciprocal lattice vector that specify how many uniformly spaced points to sample across the FBZ. This was developed by Ramirez et al[15]. Figure 5 to figure 11 illustrates the DOS carried out at different grid size.


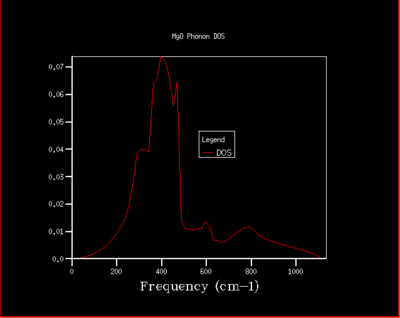
From figure 5, it can be seen that the two peaks between the frequencies and are twice as big as the other two peaks. This is because at the two observed branches sampled at , each of the branches actually represent two branches as they are degenerate. In can be seen further to the left that the branches split and become 4 branches. From onward, the DOS plot have not changed much at all, with the shape and the intensities very similar. This indicates that it has converged and is representative of the true DOS. Comparing the converged DOS with the previous ones (not converged), one obvious difference is the smoothness of the plots. The plots seem to be smoother with much less discontinuities in the density of states. Therefore, it can be concluded that the grid is a reasonable approximation to the true DOS. Although, further increasing the grid size will increase the resolution of the DOS.
It must be noted that this is unique to the case of MgO. The grid size to use for a reasonable approximation depends on how big or wide the FBZ is. If there are more k-points in the FBZ, it will require a bigger grid size to carry out a reasonable number of sampling points to get the DOS. The size of the FBZ depends on the equilibrium bond length between the particles in the lattice. Since the reciprocal space is used in the FBZ, smaller correspond to more k points in the FBZ. An example of this is simply lithium metal. For a similar oxide to MgO, their is expected to be similar, corresponding to a similar FBZ size. On the other hand, something like Zeolite will have a much greater , resulting in a smaller FBZ. Hence, to summarize, lithium would require a bigger grid, a similar metal oxide would require more or less the same grid size, and zeolite would require a smaller grid to obtain a reasonable DOS.
Computing the Helmholtz Free Energy
Since Helmholtz free energy is calculated from the DOS plot (using equation (5)), the quality of the approximation for the values calculated (the free energy) depends how well the DOS plot represents the true DOS. Therefore, another way of checking if the DOS plots have converged is to check if the free energies itself have converged. Figure 12 shows how the Helmholtz free energy varies with the grid size used to compute the DOS at 300 kelvin.
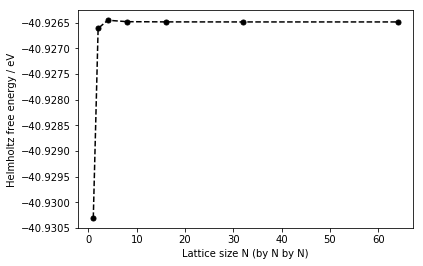

From figure 12 and table 1, it is obvious that the Helmholtz free energy have more or less converged after the grid. Although, the DOS plot shows that at this grid size, the DOS have not converged yet. Therefore, both the DOS plots and the Helmholtz free energy must be taken into account in deciding whether the grid size is a reasonable approximation or not. In addition, the accuracy of the free energies required also decide what the grid size should be used to calculate the free energies. For example, for the accuracy of 1 meV and 0.5 meV, the should be sufficient to compute the Helmholtz free energy based on table 1. For the accuracy of 0.1 meV, the grid should be used. This is determined by the difference in the Helmholtz free energies between the grid size used and the previous grid. If the difference is less than the accuracy required, the grid must be suitable for the calculation of the free energies. For this experiment, the grid is used to compute the Helmholtz free energies at different temperatures, as the computation time for each temperature generally took less than 2 minutes. Whereas using the grid took roughly 30 minutes to compute each at temperature. Hence, to maximize the number of data points but at the same time obtain accurate free energies, the former is used. Note that all the computations were carried out at zero pressure.
More over, since the Helmholtz free energies are calculated from the DOS, the argument used to discuss the validity of the grid size used for the case of lithium, similar metal oxides and zeolite on the sampling of the DOS must also apply to the free energies calculation as well.
The Helmholtz free energy of MgO was computed at temperatures from 0 K to 2900 K, in steps of 100 K. Figure 13 illustrates how the free energies vary with temperature. It can be seen that as the temperature is increased, the free energy becomes more negative with an increasing rate. The resulting volume of the lattice cell at different temperatures (obtained from the output file) were also plotted against temperature. From this, the thermal expansion coefficient can be obtained using equation (6), and is illustrated in the Results and Discussions section below.

Molecular Dynamics of MgO
For the molecular dynamics simulation, the same software was used to obtain the values required to calculate the thermal expansion coefficients. The simulations were carried out at temperatures from 100 K to 3000 K, increasing by 100 K steps. The following are the parameters used to run the simulations:
Ensemble : NPT
Time Step (\delta t) : 1 fs
Equilibrium Steps : 500
Production Steps : 500
Sampling steps: 5
Trajectory write steps : 5
Results and Discussions
Thermal Expansion (using Lattice Dynamics)
The volume of the primitive lattice cell at different temperatures is plotted against temperature itself and is illustrated in figure 14. In general, there is a positive correlation between the volume of the lattice cell and the temperature, illustrating the property of thermal expansion in solid materials. This is true for both lattice and molecular dynamics, with differences in the extreme temperatures.
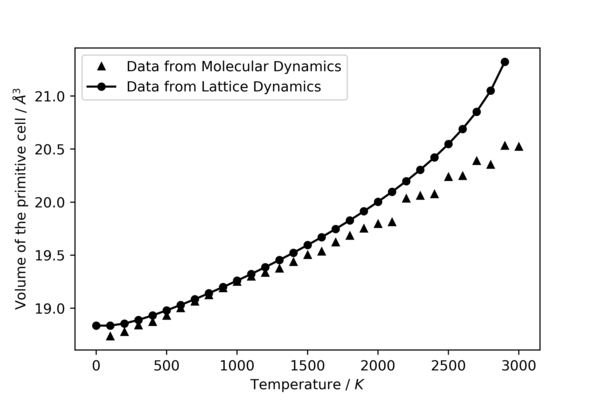
Between the temperatures of 0 K and 500 K for lattice dynamics, there seem to be very small or no change in the volume with respect to the increase in temperature. One possible explanation to this is that since statistical thermodynamics is used to compute the relevant energies, at the very low temperatures, most of the phonon states are populated at the ground state. As a result, there is no significant difference in the thermodynamic properties of MgO lattice between this temperature range. Between 500 K and 1200 K, relationship is linear and agrees with the results obtained from molecular dynamics simulation. After 1500 K, the volume starts to increase exponentially with respect to temperature. One possible explanation to this is that the frequencies of the phonons decrease as temperature increase. As a result, the energy spacings between the energy states in the quasi-harmonic potential decreases, increasing the population of the higher energy states. This is one of the main problems with the quasi-harmonic approximation, as it does not take into account of bond breaking. At very high temperatures, the solid is expected to melt at a certain temperature. Instead of that, high energy states gets more populated and the volume will continue to increase with temperature exponentially. As the temperature approaches and overtakes the melting point of MgO, the principles of phonons and lattice dynamics break down. This is because at temperatures close to the melting point, the ions in the so called lattice behaves more like liquids than solids. At very high temperatures, the actual motions of the ions do not follow the regular and periodic motions described by phonon modes anymore, where the ions are confined in their lattice points or motif. In fact, the motions become more random and cannot be modeled by lattice dynamics.
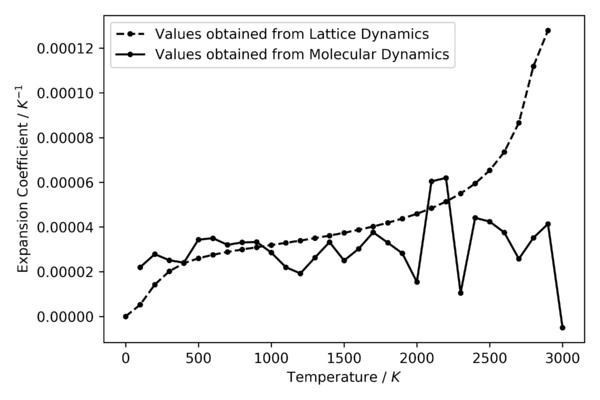
The thermal expansion coefficients at different temperatures is calculated using equation (6) and is illustrated in figure 15. This was done by using the np.gradient function from NumPy to calculate the derivative of the volume against temperature plot in figure14 and using equation (6) to plot the expansion coefficients at different temperatures. From 0 K to around 500 K, the expansion coefficient increases exponentially. It starts to become linear with a positive correlation at 500 K and continue to do so until around 2100 K. After that, the coefficient starts to increase exponentially again with respect to temperature. In contrast, this is very different from the case for molecular dynamics, where the coefficient fluctuates at around the same value throughout the temperature range.

Comparing figure 15 and figure16, it can be seen that the thermal expansion coefficients obtained by GULP has a very similar shape as the ones obtained by CRYSTAL14 based on literature. Their values correspond to the same magnitude, with the results from GULP slightly shifted below the results from the other method (hence the experimental values). In addition, results from CRYSTAL14 agrees with experimental expansion coefficients remarkably well up to around 1000 K, where the quasi-harmonic approximation starts deviating and diverging from the linearity of the experimental results.
Thermal Expansion (using Molecular Dynamics)
From figure 14, it can be seen that volume has a linear positive relationship with temperature throughout the whole temperature range used. In addition, the simulation failed to work at 0 K. One possible explanation to this is that at 0 K, the kinetic energy of the molecules would be zero, indicating that there should not be any molecular motions (as classical mechanics is used here). As a result, since molecular dynamics is heavily based on the change in the positions of the atoms, calculating and optimizing the total mechanical energy, the simulation won't be able to compute any of the values when there is no motion in the first place. Although, it must be noted that because of quantum mechanics, there is still zero-point energy even at 0 K.
Using the same method as lattice dynamics for analysis, the expansion coefficients were computed and illustrated in figure 15. It can be seen that the expansion coefficients are very noisy and fluctuates significantly around a single value at approximately , and got worse after 2000 K. This suggests that more data points are required between the temperature range used, and different parameters must be used to carry out molecular dynamics at the higher temperatures. Due to time constraint of the experiment, this was not possible to carry out and explored more.
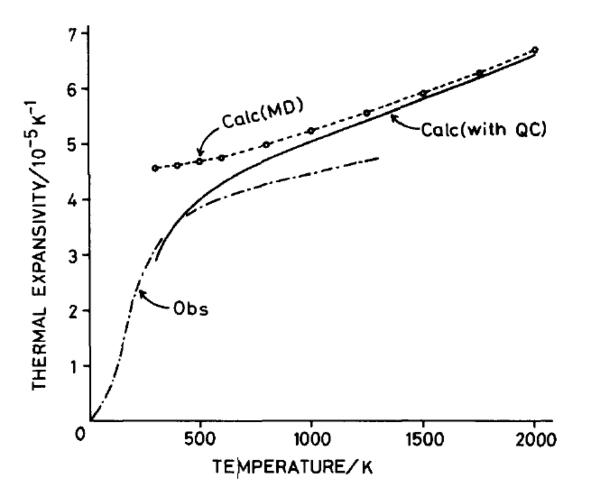
It can be seen that from figure 15 and figure 17, the thermal expansion coefficients obtained is generally smaller than the computation carried out by the literature shown. Although, the comparison made here is not reliable at all. This is because there are too many fluctuations in the values obtained from GULP. A better way to obtain the coefficients for molecular dynamics is to perform a linear fit to the linear region of the volume against temperature plot where it matches the values from lattice dynamics. This was performed and is analysed in the next section.
Since only one supercell (SC) size was used for the molecular dynamics simulations ( the size of the conventional cell, hence 32 atoms in the cell), the deviation of the calculated values may be because of this. This is because the SC used may have been too small to represent the interactions and properties of the bulk materials. Also, periodic boundary conditions does not apply to this model unlike lattice dynamics. Hence, the SC must be large enough to represent the MgO as a bulk material. One way to check is to run the simulations at bigger SCs and and check if their lattice and thermodynamic parameters have converged. This is a similar method carried out for the calculation of the DOS and free energies in the lattice dynamics model. The downside to carrying out simulations at bigger SCs is that it can take much longer run time to compute at each temperature.
Lattice Dynamics vs Molecular Dynamics
The linear region of the lattice and molecular dynamics were fitted and illustrated in figure 18. These are the regions where the volumes of the two model matches. Since the change in the thermal expansion coefficients between 500 K and 1200 K are small, they can be assumed to be constant. From the linear fits performed, the thermal expansion coefficients at zero pressure are (for lattice dynamics) and (for molecular dynamics). The difference between the values is only . These values agree reasonably well with the reported value for the coefficient, from J. Zhang</math>[23]. In addition, a more recent paper by Rao et al[24] reported a value of for the range of 300 K and 1250 K. Both of the reported literature values agree with experimental results from Suzuki[25] and Utsumi et al[26].

From figure 14, it can be seen that the only region where the volume from both the models used matches is between 500 K and 1200 K. Molecular dynamics seem to fail to predict the volume at temperatures below 500 K. One possible explanation is that at low temperature, quantum mechanical behaviour becomes dominant[27]. As molecular dynamics use purely classical Newtonian mechanics to model the ions, this causes the volume calculated to deviate from what actually happened. Hence, at low temperatures, lattice dynamics works well and matches what is observed based on experimental data. However, lattice dynamics fails to predict the volume at temperatures above 1200 K (explanation discussed in previous section). Molecular dynamics predicts the volume well at higher temperature (above 500 K and beyond). This is because for this model, the calculations for the properties of MgO was not done on the basis that the ions are placed at lattice points. The ions are allowed to move freely in the cell in all directions randomly, where the geometry with the lowest energy below the melting point happens to be arranged regularly like a lattice. This means that even after the melting point, molecular dynamics is still a viable method to simulate liquids and observe their dynamics behaviour. Although, it must be noted that it requires different parameters for modelling liquids, as the dynamics of solids and liquids are very different.
There is a difference in the explanation of thermal expansion between lattice dynamics and molecular dynamics model. For lattice dynamics, this is due to the shift in the equilibrium bond length between the ions in MgO as temperature is increased, due to the anharmonicity of the potential used. For molecular dynamics, the potential energy between the ions and the kinetic energy of the system is optimized be adjusting the positions of the ions in the supercell. Both potential and kinetic energy is temperature dependent[28]. At higher temperatures, the supercell adopts geometries such that the average distance between the ions increases(this is after energy optimisation). Even though the basis of thermal expansion for the two models differ, the result is the same for the behaviour of solids.
Conclusion
In this experiment, the thermal expansion coefficient of MgO at zero pressure was calculated by carrying out computer simulations using lattice dynamics (quasi-harmonic approximation) and molecular dynamics method. Two methods of analysis was used obtain such values. The first was to plot the first derivative of the volume against temperature curve using equation (6) to get the expansion coefficients. Generally, the values obtained from this analytical method were observed to be underestimated compared to the experimental ones. Although, the shape of the coefficients obtained from lattice dynamics matches experimental values very well. As for molecular dynamics, the coefficients fluctuates significantly around approximately . This suggested that a better analytical method had to be used to compare the values from both of the computation models. This was done by performing a linear fit to the linear regions of the volume against temperature plot and analyse locally between that region. This was found to be between 500 K and 1200 K. The expansion coefficients was then found to be for lattice dynamics, for molecular dynamics, comparing to from J. Zhang[29] and from Rao et al[30].
Further Work
There are many improvements and extensions that can be carried out based on the results of this experiment. One way to improve the molecular dynamics method is to use more temperature points to carry out the simulations. Also, different parameters can be used for higher temperatures. As for the extensions, molecular dynamics can be used to find the phase transition of MgO theoretically. This can be done by observing the discontinuity in increase in volume as temperature increases. Also, CaO can be modelled and compared with MgO.
References
- ↑ J. Zhang, Physics and Chemistry of Minerals, 2000, 27, 145–148.
- ↑ A. S. M. Rao and K. Narender, Journal of Thermodynamics, 2014, 2014, 1–8.
- ↑ Wikipedia, 2017.
- ↑ Phonon calculations — ASE documentation.
- ↑ S. K. Mishra, M. K. Gupta, R. Mittal, M. Zbiri, S. Rols, H. Schober and S. L. Chaplot, Physical Review B, 2014, 89.
- ↑ Misra, Prasanta Kumar (2010). "2.1.3 Normal modes of a one-dimensional chain with a basis". Physics of Condensed Matter. Academic Press. p. 44. ISBN 0-12-384954-3.
- ↑ Misra, Prasanta Kumar (2010). "2.1.3 Normal modes of a one-dimensional chain with a basis". Physics of Condensed Matter. Academic Press. p. 44. ISBN 0-12-384954-3.
- ↑ A. Erba, M. Shahrokhi, R. Moradian and R. Dovesi, The Journal of Chemical Physics, 2015, 142, 044114.
- ↑ W. A. Harrison, Electronic structure and the properties of solids: the physics of the chemical bond, Dover Publications, New York, 1989.
- ↑ A. Erba, M. Shahrokhi, R. Moradian and R. Dovesi, The Journal of Chemical Physics, 2015, 142, 044114.
- ↑ A. Erba, M. Shahrokhi, R. Moradian and R. Dovesi, The Journal of Chemical Physics, 2015, 142, 044114.
- ↑ R. A. Buckingham, Proceedings of the Royal Society A: Mathematical, Physical and Engineering Sciences, 1938, 168, 264–283.
- ↑ Y. Wang, Z.-K. Liu, L.-Q. Chen, L. Burakovsky and R. Ahuja, Journal of Applied Physics, 2006, 100, 023533.
- ↑ M. J. L. Sangster and C. W. Mccombie, Journal of Physics C: Solid State Physics, 1970, 3, 1498–1512.
- ↑ R. Ramirez and M. C. Böhm, International Journal of Quantum Chemistry, 1988, 34, 571–594.
- ↑ A. Erba, M. Shahrokhi, R. Moradian and R. Dovesi, The Journal of Chemical Physics, 2015, 142, 044114.
- ↑ O. L. Anderson, D. Isaak, and H. Oda, Rev. Geophys., 1992, 30, 57.
- ↑ S. Ganesan, Philosophical Magazine, 1962, 7, 197–205.
- ↑ G. K. White and O. L. Anderson, J. Appl. Phys., 1966, 37, 430.
- ↑ M. Matsui, The Journal of Chemical Physics, 1989, 91, 489–494.
- ↑ G. K. White and O. L. Anderson, J. Appl. Phys., 1966, 37, 430.
- ↑ O. L. Anderson and I. Suzuki, Journal of Geophysical Research, 1983, 88, 3549.
- ↑ J. Zhang, Physics and Chemistry of Minerals, 2000, 27, 145–148.
- ↑ A. S. M. Rao and K. Narender, Journal of Thermodynamics, 2014, 2014, 1–8.
- ↑ I. Suzuki, Journal of Physics of the Earth, 1975, 23, 145–159.
- ↑ W. Utsumi, D. J. Weidner and R. C. Liebermann, Geophysical Monograph Series Properties of Earth and Planetary Materials at High Pressure and Temperature, 1998, 327–333.
- ↑ Penn State. "Probing Question: Are There Upper And Lower Limits To Temperature?." ScienceDaily. ScienceDaily, 11 June 2007. <www.sciencedaily.com/releases/2007/06/070608143130.htm>.
- ↑ V. Timon, S. Brand, S. J. Clark and R. A. Abram, Journal of Physics: Condensed Matter, 2006, 18, 3489–3498.
- ↑ J. Zhang, Physics and Chemistry of Minerals, 2000, 27, 145–148.
- ↑ A. S. M. Rao and K. Narender, Journal of Thermodynamics, 2014, 2014, 1–8.
