Rep:Module 2:mh108 3apr9tru
Module 2
Structural Analysis of TlBr3

| Calculation Summary reported by GaussView | Optimisation |
| File type | .log |
| Calculation type | FREQ |
| Calculation method | RB3LYP |
| Basis set | LanL2DZ |
| E(RB3LYP) | -91.21812851 a.u. |
| RMS Gradient norm | 0.00000090 a.u. |
| Imaginary freq | |
| Dipole moment | 0.000 Debye |
| point group | D3h |
Aim
The aim was to simulate a TlBr3 molecule using computational method, optimise it's geometry and confirm it by frequency analysis.
Method
TlBr3 was simulated by GaussView05 with a restricted geometry to D3h, very tight tolerance(0.0001) and optimised to RB3LYP/LanL2DZ accuracy by Gaussian09. Further frequency analysis was run on this optimised geometry with the same method and basis set to ensure accuracy. Frequency analysis with a different basis set might result in higher energy states calculation than is the needed lowest one.
Results
All bond lengths, of TlBr3, were found to be 2.65A ±0.01 with 120° ±0.1 angles between them.[1] The model with bond lengths and angles can be view as a Jmol applet on the left. The structure was confirmed as energy minimum by frequency analysis, all frequencies positive, with the first frequency A2" 52cm-1 and low frequencies of: -3.4213 -0.0026 -0.0004 0.0015 3.9367 3.9367 cm-1.[2] The importance of frequency analysis is to confirm that a energy minima was found and not a transition state, energy maxima where one of the frequencies is negative, or that the calculation has not simply failed, more than one negative frequency.
| Calculation Summary reported by GaussView | Frequency |
| File type | .log |
| Calculation type | FOPT |
| Calculation method | RB3LYP |
| Basis set | LanL2DZ |
| E(RB3LYP) | -91.21812851 a.u. |
| RMS Gradient norm | 0.00000088 a.u. |
| Imaginary freq | |
| Dipole moment | 0.000 Debye |
| point group | D3h |

Discussion and Conclusion
It was earlier reported that TlBr3 has a planar triangular geometry with a bond length of 2.51A as determined by x-ray diffraction of concentrated aqueous solutions of Thallium(III) and varying concentration of bromide[3].
Theoretically there are six vibrational, bands based on 3N-6, however there are two sets of degenerate vibrations and a zero energy vibration that does not appear on the spectrum. The resulting spectrum is thus observed as shown.
In conclusion the TlBr3 structure predicted by our computational model is an energy minima, as shown by frequency analysis. Furthermore the bond lengths and angles are comparable to earlier reported values supporting the validity of the model.
Further Questions
For some structure it was found that GaussView does not draw bonds in. The reason for this is that GaussView draws bonds based on pre-defined distance between atoms. However that does not mean the bond is not there it only means that the pre-defined value was exceeded.
There are many theories of bonding thus there isn't one and simple answer to what a bond is. In the simplest terms bond is defined by sharing of an electron pair between two atoms. However this oversimplifies the picture and cannot account for different electronic distribution within a molecule. On the other hand it can be defined as an equilibrium distance between two atoms with an energy minima and an associated dissociation barrier, which does not distinguish between a bond and non bonding interactions. In conclusion each theory has it's strengths and weaknesses applicable to different situations but overall it is not possible to accurately define a bond.
MO Analysis of BH3

| Calculation Summary reported by GaussView | Optimisation |
| File Type | .log |
| Calculation Type | FOPT |
| Calculation Method | RB3LYP |
| Basis Set | 3-21G |
| Charge | 0 |
| Spin | Singlet |
| E(RB3LYP) | -26.46226338 a.u. |
| RMS Gradient Norm | 0.00020672 a.u. |
| Imaginary Freq | |
| Dipole Moment | 0.0000 Debye |
| Point Group | D3H |
Aim
The aim was to simulate a BH3 molecule using computational method, optimise it's geometry, calculate it's molecular orbitals and compare them with pictographycally predicted MOs by linear combination of atomic orbitals (LCAO).
Method
BH3 was simulated by GaussView05 and optimised to RB3LYP/3-21G accuracy by Gaussian09. The validity of the structure was confirmed by frequency analysis as above. Finally the MOs were calculated by Gaiussian9 to the same accuracy as earlier to ensure accuracy.

Results
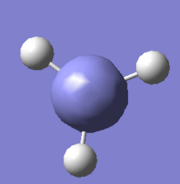
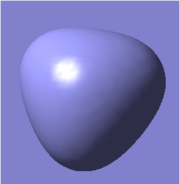
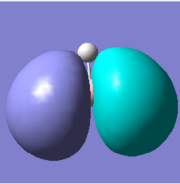
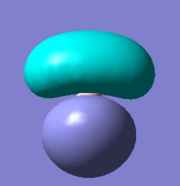
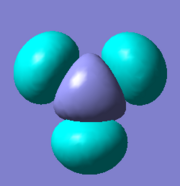
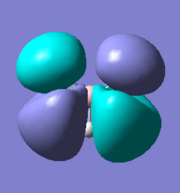
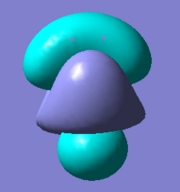
There are five calculated bonding orbitals, which of four are occupied. From a large number of antibonding orbitals only the first three are of an interest as these are the ones predicted by LCAO. The first two are degenerate whereas the third one lies just above them.. [4] For results of frequency analysis visit. [5]
Discussion
The first bonding MO 1a1' does not appear on the predicted MO diagram. It is a boron 1s orbital which is too low in energy to interact with any hydrogen fractional orbitals and remains non bonding. For next four bonding orbitals 2a1', two 1e' and non bonding 1a2" the predicted match with the calculated orbitals in shape and order of energy. However the order of antibonding orbitals is reversed for the calculated orbitals compared with predicted i.e the 2e' lie lower in energy than 3a1' molecular orbital. This is not a problem as the prediction is only qualitative rather than quantitative and the shape of the orbitals was predicted correctly.
Conclusion
The only difference between the calculated orbitals and LCAO orbitals is the energy and order, but as the qualitative approach predicted the right number, shape and occupancy of bonding, non bonding and antibonding orbitals it is not significant. On the other hand it demonstrates the power of LCAO, which accurately predicted all MOs. All calculated MOs are show bellow for comparison with predicted MOs, they might look differently but only as LCAO does not combine the individual orbital contribution as GaussView.
 |
 |
 |
 |
 |
 |
 |
 |
Isomers of Mo(CO)4L2
| Table 1 | Trans-Mo(CO)4(PCl3)2 |
| File Type | .log |
| Calculation Type | FOPT |
| Calculation Method | RB3LYP |
| Basis Set | LANL2DZ |
| Charge | 0 |
| Spin | Singlet |
| E(RB3LYP) | -623.57603100 a.u. |
| RMS Gradient Norm | 0.00003121 a.u. |
| Imaginary Freq | |
| Dipole Moment | 0.3048 Debye |
| Point Group | C1 |

Introduction
Mo(CO)4L2, L=PPh3, can form cir or trans isomer. The cis isomer shows four M-CO vibrational bands whereas the trans isomer produces only one M-CO band. The reason is simply due to increased degeneracy in more symmetric systems as the vibrations are technically the same and do not appear individually on the spectrum.
Aim
The aim is to calculate the relative thermal stability of the two isomers and predict which is the more likely to form. Finally to calculate the theoretical vibrational spectra and analyse the vibrations of the two isomers with the aim to highlight the degeneracy of trans isomer vibrations due to high symmetry.
Experimental
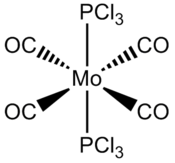
For computational capacity the Mo(CO)4(PPh3)2 was simplified by replacing the phosphine Ph groups by Cl. Electronic behaviour of the Cl substituents is similar to the Ph groups and are relatively large to simulate the steric properties making it a reasonable approximation. The Mo(CO)4(PCl3)2, both cis and trans, were modelled by GausView05 and preliminary optimisation was run at B3LYP/LANL2MB accuracy with "opt=loose", to ensure convergence, by Gassian9. The first optimised structures were manually modified so that the trans isomer (PCl3) were eclipsed and their dihedral angle 0° with one of the CO substituents. The cis isomer (PCl3) were modified so that one C1-Mo-P-Cl dihedral angle was 0° and the other C1-Mo-P-Cl dihedral angle was 180°. This was done to ensure that a new deeper minima is obtain from subsequent optimisation, which was run at B3LYP/LANL2DZ accuracy with additional "int=ultrafine scf=conver=9", to increase electronic convergence, by Gaussian9. Finally the vibrational analysis was run at the same accuracy as the second optimisation to ensure accuracy.
| Table 2 | Cis-Mo(CO)4(PCl3)2 |
| File Type | .log |
| Calculation Type | FOPT |
| Calculation Method | RB3LYP |
| Basis Set | LANL2DZ |
| Charge | 0 |
| Spin | Singlet |
| E(RB3LYP) | -623.57707196 a.u. |
| RMS Gradient Norm | 0.00000259 a.u. |
| Imaginary Freq | |
| Dipole Moment | 1.3101 Debye |
| Point Group | C1 |
Results
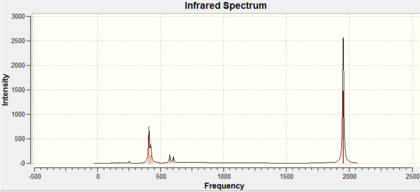
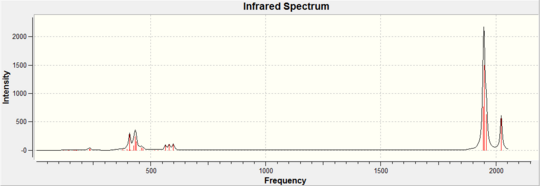
For results of the first approximate optimisation look at references [6] [7], the final optimised structure can be seen in Jmol on the left with the calculation summaries in table 1 and 2. The trans-Mo(CO)4(PCl3)2 bond lengths: Mo-CO 2.06A, Mo-PCl3 2.44A, MoC=O 1.17A, MoP-Cl 2.24A bond angles: P-Mo-C 91.3°, C-Mo-C 89.5°; The cis-Mo(CO)4(PCl3)2 bond lengths: Mo-CO 2.01A, Mo-PCl3 2.51A, MoC=O 1.18A, MoP-Cl 2.24A bond angles: P-Mo-C 89.4°, P-Mo-CP 94.2° (All bond lengths and angles are reported with ±0.01A and ±0.1° accuracy)[8] [9]. The frequency analysis for both complexes have not revealed any negative frequencies for details look at references [10] [11]. trans-Mo(CO)4(PCl3)2 IR cm-1: CO stretches (1951, 1950); cis-Mo(CO)4(PCl3)2 IR cm-1: CO stretches (2023, 1958, 1948, 1945). Note that only stretches with visible intensity are recorded here, in reality there are two other trans-Mo(CO)4(PCl3)2 CO stretches but their intensity is ≈0.
The relative energies of the cis isomer is -1.63720E6kJ/mol and -1.63719E6kJ/mol for the trans isomer ±10kJ/mol.
 |
 |
There are two very low vibrations for both cis and trans isomer, which are small twists of the PCl3 to the sides as shown below.
| trans-Mo(CO)4(PCl3)2 Frequency cm-1 | Vibration |
| 5 | 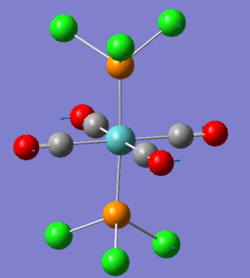
|
| 6 | 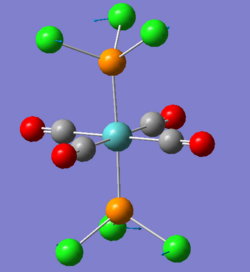
|
| cis-Mo(CO)4(PCl3)2 Frequency cm-1 | Vibration |
| 11 | 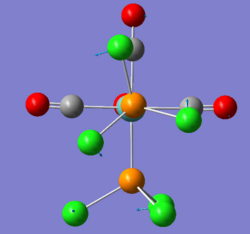
|
| 18 | 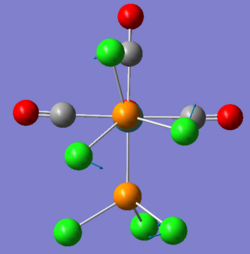
|
Discussion
The difference in relative energy of the two complexes is within approximation error for this method and basis set used thus both can be assumed to be equally likely to form. However from the structures of the two isomers it is clear that increasing the size of the phosphine will make the cis isomer less favoured. Originally we assumed that replacing the phenyls with chlorides will not affect the resulting calculation however here it clearly did as phenyls are sterically bigger and would greatly destabilize the cis isomer. The cis isomer can thus be destabilized compared to the trans by use of bigger substituents like tButyls. Stabilization of the cis isomer relative to the trans one is harder to predict but possibly hydroxyls can stabilize it by means f H-bonding impossible for trans isomer making it more stable.
The calculated bond lengths are in the same order of magnitude as similar Mo-R bonds, where Mo-CO was compared with Mo-C(O)R 2.11A and Mo-PCl3 with Mo-PMe3 2.46A. Furthermore the bond angles are in the right region for octahedral geometry with little alternation due to steric factors enforced by larger PCl3 groups especially in the cis isomer. In conclusion the optimised structures are likely to represent real [Mo(CO)4(PCl3)2]. [12]
The low frequency of the two vibrations for each isomer is the result of heavy atoms, Cl, and strong bonds (C=O) being distorted. These are difficult to distort and the resulting intensities are very small thus at room temperature these vibrations are slow and not very intense.
Further to these low vibrations the frequency analysis showed four carbonyl vibrations for each isomer. This calculation fits the cis isomer however not the trans isomer where symmetry predicts only one stretch. Symmetry prediction combines degenerate vibrations and does not include vibrations which would result in very low intensity based on selection rules. However the calculation shows all the vibrations but when combined to a spectrum the low intensity and degenerate vibrations disappear resulting in one intense vibration. For both cis and trans isomer the calculated CO frequencies are within calculation error to measured IR [13] supporting the choice of basis set for calculation and its accuracy.
Mini-Project

Introduction and Aim
SbF5 readily accepts a fluoride to form bridged [Sb2F11]- adduct.[14] Earlier reported crystallographic studies of the [Sb2F11]- showed an octahedral geometry at the metal centre bridged by one fluoride, where the bridge is not linear but bend. [15]
The aim was to analyse the structure of the adduct and investigate the bonding of the bridging fluoride. Finally extending this idea to structurally similar [As2F11]- adduct and testing the effect of substituting fluoride bridge for other halides, namely chloride.
Experimental
Linear [Sb2F11]-,[As2F11]- and their bridge substituted derivatives were simulated by GaussView05 and optimized at BL3LYP/Lan2DZ int=ultrafine scf=conver=9 accuracy by Gaussian9. The optimised structures were subjected to frequency analysis to ensure an energy minima. Same methodology was followed for bend structures, starting 170° M-X-M bond angle for optimisation, and the results submitted to molecular orbital analysis.
Results
Frequency analysis revealed that all the linear structures were indeed transition states as expected from the crystallographic studies, large negative frequencies. Furthermore the linear structure of [As2F10Cl]- failed to optimise. For details on linear structures and vibrational frequencies visit sources [16] [17] [18].
The optimised structures can be seen in Jmol above. Frequency analysis of bend structures demonstrated energy minimum with negative frequencies within calculation error (±7cm-1). [19] [20] [21] [22] Both [Sb2F11]- and [As2F11]- shows greater tendency to linearity, M-F-M bond angle of 179.7° and 172.6° (±0.1°) respectively. Whereas the chloride substituted derivatives are strongly bend M-Cl-M bond angle 123.7° [Sb2F10Cl]- and 123.0° [As2F10Cl]- (±0.1°). In addition all structures showed tendency of equatorial fluorides to bend towards the bridge, where the tendency was stronger for fluoride bridge than for chloride but independent of the metal centre; F-M-F 85.8°, Cl-M-F 86.6° (±0.1°).
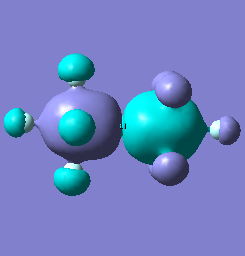
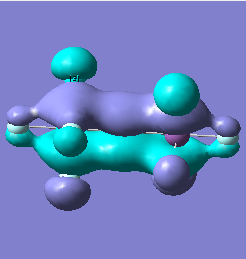
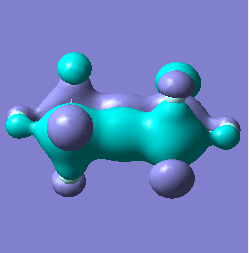
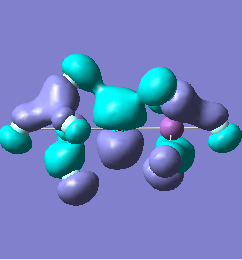
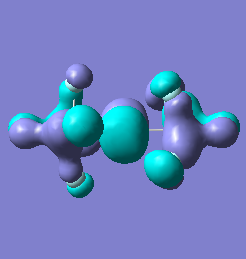
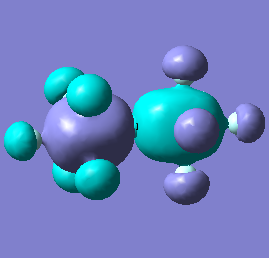
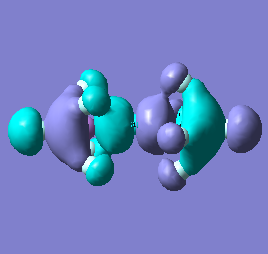
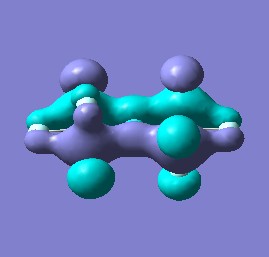
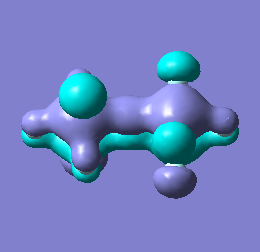
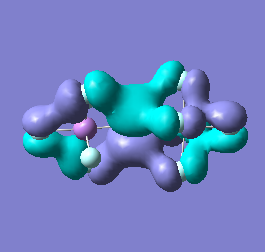
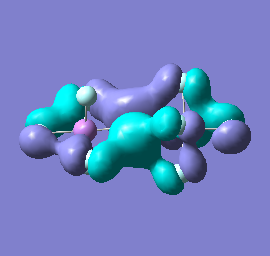
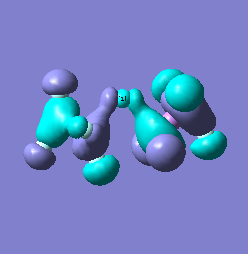
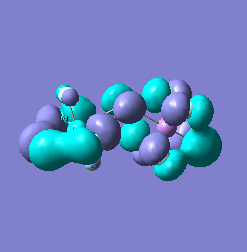
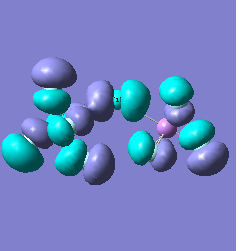
Molecular orbital analysis of [Sb2F11]- and [As2F11]- revealed MO 55 as the HOMO for both adducts, where the [Sb2F11]- has 8MOs with bonding character across the bridge and [As2F11]- has only 7 constructive MOs in the bridging region. MOs that constructively participate in the bridge are shown bellow all other can be found in the supplementary material [23] [24]. For structures, where the bridging fluoride was replaced with chloride, there were more orbitals with a bonding character across the bridge. For [Sb2F10Cl]- there were 10 and [As2F10Cl]- there were 12. The most important according to me are shown below, the rest can be found in supplementary material [25] [26]
Discussion
Formation of an adduct from SbF5 and structurally similar AsF5 is energetically favoured as it allows for the formation of many new bonding molecular orbitals in the bridging region resulting in lowering the energy. Furthermore distortion of symmetry from linearity can be justified as it allows for better orbital overlap, best seen in [Sb2F11]- MO 30 and 32 where the individual contribution AOs overlap on one side constructively to form better MOs. In the overall shape of the MOs there is little difference between the two adducts however substituting the metal centre to a smaller As results in better overlap in all the MOs, As and F AOs are closer in energy than Sb and F atomic orbitals. The only exception is MO 30, where the increased overlap increases manly destructive interference with the metal orbital rather than constructive addition to other fluoride substituents resulting in unfavourable interactions across the bridge.
| MO Number | 12 | 23 | 25 | 26 | 27 | 30 | 31 | 32 |
| [Sb2F11]- |  |
 |
 |
 |
 |
 |
 |

|
| [As2F11]- | 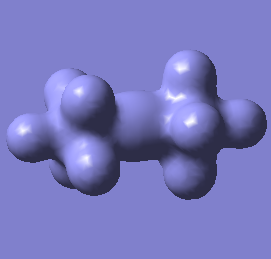 |
 |
 |
 |
 |
Does not constructively participate in the bridging region |
 |
|
| MO Number | 21 | 28 | 33 | 38 | 46 | 53 |
| [Sb2F11]- | 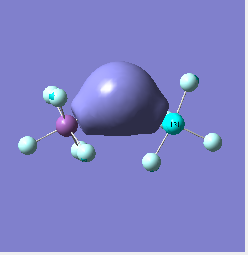 |
Does not constructively participate in the bridging region |  |
Does not constructively participate in the bridging region | 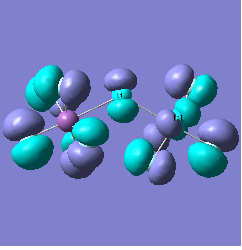 |

|
| [As2F11]- | 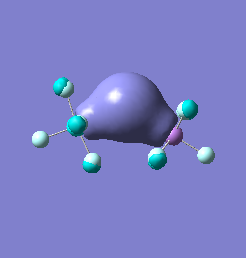 |
 |
 |
 |
 |

|
The importance of bend structure is even more clearly demonstrated with the bridging fluoride substituted for chloride. The bend structure again increases the possible orbital overlap between the bridging halide with non bridging halide substituents on the metal centre. However this time the chloride having larger orbitals can achieve large constructive orbital overlap when the adduct is strongly bend, whereas with the smaller fluoride orbitals the newly formed MOs cannot benefit from bending as the original AOs will not approach each other close enough.
Finally the equatorial fluorides bend towards the bridge again to increase the orbital overlap, where with bridging chloride greater overlap can be achieved resulting in smaller bond angle.
Conclusion
The adduct is formed due to large energetical benefit from forming new bonding interactions across the newly formed halide bridge. Furthermore the structure is bend as it allows for constructive rather than destructive overlap between different p type orbitals as it happens in the linear form.
Literature
- ↑ TlBr3 Optimised structure: https://www.ch.ic.ac.uk/wiki/index.php/Image:MH108_TLBR3_OPT.LOG
- ↑ TlBr3 Frequency analysis: DOI:10042/to-5318
- ↑ Julius Glaser, Georg Johansson; On the Structure of Hydrated Thallium(III) Ion and its Bromide Complexes in Aqueous Solution,36, 125-136, 1982: DOI:10.3891/acta.chem.scand.36a-0125
- ↑ BH3 MO: DOI:10042/to-5320
- ↑ BH3 Frequency analysis: DOI:10042/to-5319
- ↑ Approximate optimisation of cis-Mo(CO)4(PCl3)2: DOI:10042/to-5358
- ↑ Approximate optimisation of trans-Mo(CO)4(PCl3)2: DOI:10042/to-5359
- ↑ Optimisation of cis-Mo(CO)4(PCl3)2: DOI:10042/to-5366
- ↑ Optimisation of trans-Mo(CO)4(PCl3)2: DOI:10042/to-5367
- ↑ Frequency analysis of cis-Mo(CO)4(PCl3)2: DOI:10042/to-5365
- ↑ Frequency analysis of trans-Mo(CO)4(PCl3)2: DOI:10042/to-5364
- ↑ http://www.hbcpnetbase.com/articles/09_13_86.pdf
- ↑ Donald J. Darensbourg, Robin L. Kump, A convenient synthesis of cis-Mo(CO)4L2 derivatives (L = Group 5a ligand) and a qualitative study of their thermal reactivity toward ligand dissociation, Inorg. Chem., 1978, 17 (9), pp 2680–2682: DOI:10.1021/ic50187a062
- ↑ C. Housecroft; Inorganic Chemistry, p.499
- ↑ Sandro Hollenstein and Thomas Laube, Crystal Structure of the tert-Butyl Cation, J. Am. Chem. SOC. 1993,115, 7240-7245: DOI:10.1021/ja00069a023
- ↑ Frequency analysis of linear [Sb2F11]- : DOI:10042/to-5462
- ↑ Frequency analysis of linear [Sb2F10Cl]- : DOI:10042/to-5463
- ↑ Frequency analysis of linear [As2F11]- : DOI:10042/to-5464
- ↑ Frequency analysis of bend [Sb2F11]- : DOI:10042/to-5502
- ↑ Frequency analysis of bend [As2F11]- : DOI:10042/to-5503
- ↑ Frequency analysis of bend [Sb2F10Cl]- : DOI:10042/to-5506
- ↑ Frequency analysis of bend [As2F10Cl]- : DOI:10042/to-5505
- ↑ Molecular orbital analysis of bend [As2F11]- : DOI:10042/to-5482
- ↑ Molecular orbital analysis of bend [Sb2F11]- : DOI:10042/to-5483
- ↑ Molecular orbital analysis of bend [As2F10Cl]- : DOI:10042/to-5488
- ↑ Molecular orbital analysis of bend [Sb2F10Cl]- : DOI:10042/to-5487
