
Rep:Module 1 - ceg09
Since the early 1950's computational chemistry has been an exciting and novel branch of chemistry. In this module several different reaction pathways will be discussed and analyzed using computational techniques. It is important to first express the difference between several methods used throughout the discussions.
- Molecular mechanics (MM)- Allinger's MM2 force field calculations is a classical approach to computational chemistry and essentially considers the compound to be made up of point charges and unbreakable bonds. It is the addition of five independent energies:
- Diatomic bond stretches (Hookes Law)
- Triatomic bond angle distortions (Hookes Law)
- Tetra-atomic bond torsions
- Non-bonding 1,4 Van der Waals repulsions (Lennard-Jones potential)
- Electrostatic dipole attractions
- Merck Molecular Force Field (MMFF)- MMFF computational methods were developed in the 1950's by pharmaceutical companies wishing to model possible drug compounds. For this reason the details of such methods are not readily available in the literature. In essence MMFF is, like MM, a classical approach and can often be used in conjunction with MM2 to prove relative energy relationships.
- MOPAC - MOPAC is a semi-empirical program. Rather than considering the atoms as point charges it uses the wavefunctions of the system and so is capable of creating and breaking bonds within the compound. This method is especially useful when generating molecular orbitals.
The Hydrogenation of Cyclopentadiene Dimer
Introduction


In 1950 Otto Diels and Kurt Alder received the Nobel Prize in Chemistry "for their discovery and development of the diene synthesis"[1]. Professor A. Fredga commented during the award ceremony speech that “the synthesis of dienes (had) been developed in various directions by numerous workers, and its significance (had) become more and more obvious”. Nowadays, the importance of the so-called Diels-Alder reaction is not only obvious but also an intrinsic component in the basic skill-set of every synthetic chemist.
The interest in Diels-Alder reactions is clear form a synthetic viewpoint however it also reveals the intriguing and often unexpected differences between thermodynamic and kinetic control. A good example of this is the dimerisation of 1,3 cyclopentadiene.
The Endo-Rule[2]
Firstly, it is important to recap some simple reaction dynamics. When a reversible reaction is under thermodynamic control the most stable/lowest energy product dominates. This is because the system has enough energy to pass back and forth over the transition states of the two dimers until the lowest energy conformation is obtained. Conversely, under kinetic control the reaction is essentially irreversible. The overall system has a smaller amount of energy to overcome the transition state barriers and so the product with the smallest activation energy is preferred.
 |
 |
Diels-Alder reactions commonly show a preference for the kinetically formed endo-product (2). This preference can be explained by considering the frontier orbitals involved in the formation of the transition state. The endo-aligned intermediate is largely stabilized by the bonding interactions as shown by the orbitals, highlighted in orange in figure 1, and so forms the dominant product.
Dimerisation
From the MM2 energy calculations shown below it is clear that the exo-product (1) is lower in energy and thus the thermodynamic product whereas the endo-product (2) is higher in energy (by 2.12 kcal/mol) and forms the dominant kinetic product. This supports the Endo-Rule for Diels-Alder as discussed above. In addition, a difference of approximately 2kcal/mol can be seen between the torsional energies of the endo and exo forms. This can be seen visually by considering the dihedral angles in the two conformers (see the jmol links above). The exo conformer has a dihedral angle of 179° very close to a favorable 180° antiperiplanar configuration. In the endo form, this angle is compressed, 46° , and so a higher torsional energy is observed.
| Energy in (kcal/mol) | ||
| Exo-Product (1) | Endo-Product (2) | |
|---|---|---|
| Stretch | 1.29 | 1.25 |
| Bend | 20.58 | 20.85 |
| Stretch/Bend | -0.84 | -0.84 |
| Torsion | 7.66 | 9.51 |
| Non 1,4-VDW | -1.42 | -1.54 |
| 1,4-VDW | 4.23 | 4.32 |
| Dipole/Dipole | 0.38 | 0.45 |
| Total | 31.88 | 34.00 |
Hydrogenation
 | |
The hydrogenation of the endo-dimer can form 2 possible products (3 and 4). From the MM2 energy calculations it is clear that product 4, in which the remaining alkene bond forms part the cyclopentene ring, is lower in energy and thus thermodynamically favourable. This can be explained by comparing the ring strain of the two products. The cyclopentene product (4) has internal C-C-C alkene bond angles of 112.4o and 113.0o. The cyclohexene product (3) on the other hand has angles both of 107.8o . The ideal sp2 bond angle in both cases is 122o thus it is clear that product 3, with more compressed angles, will be more strained and hence less thermodynamically stable. This is reflected in the relative bending energies of the two products 19.87kcal/mol and 14.52kcal/mol for product 3 and 4 respectively. Using this method we have successfully predicted the thermodynamic product of the reaction however we do not have enough information to be able to predict the kinetic product.
| Energy in (kcal/mol) | ||
| Hydrogenation Product (3) | Hydrogenation Product (4) | |
|---|---|---|
| Stretch | 1.28 | 1.10 |
| Bend | 19.87 | 14.52 |
| Stretch/Bend | -0.83 | -0.55 |
| Torsion | 10.81 | 12.50 |
| Non 1,4-VDW | -1.23 | -1.07 |
| 1,4-VDW | 5.63 | 4.51 |
| Dipole/Dipole | 0.16 | 0.14 |
| Total | 35.69 | 31.15 |
Stereochemistry and Reactivity of an Intermediate in the Synthesis of Taxol
Taxol is a key drug used in cancer chemotherapy derived from the bark of Taxus brevifolia[3], a species of yew tree native to the pacific Northwest of North America. It was first isolated in 1967 by Monroe E. Wall and Mansukh C. Wani[4] and is now used to treat a range of cancers[5] as well as Kaposi's sarcoma[6].
Intermediate Atropisomers
 |
 | ||
A key intermediate in the total synthesis of taxol[7] is shown above and can have two possible conformations, atropisomers. Atropisomers are seen when a reaction has two or more minima in its potential energy surface which are separated by a large enough energy barrier so as not to readily interconvert. The two isomers shown above (9,10) are examples of atropisomers and can interconvert via a complicated sequence of rotations[8]. It is noted that the conformers shown here are in the chair configuration, however both also have isomeric twist-boat forms[9]. These have not been analyzed as they are known to be innately higher in energy.
The table shown below shows that of the two isomers the carbonyl down taxol intermediate (10) is the most thermodynamically stable. Although there is a large inconsistency between the MM2 and MMff94 calculations, the relative values for each conformer remains the same and thus allows us to be confident that (10) is the most stable isomer.
| Energy in (kcal/mol) | ||||
| Carbonyl Up (9) | Carbonyl Down (10) | |||
|---|---|---|---|---|
| Stretch | 2.79 | 2.60 | ||
| Bend | 16.54 | 10.42 | ||
| Stretch/Bend | 0.43 | 0.29 | ||
| Torsion | 18.26 | 19.370 | ||
| Non 1,4-VDW | -1.56 | -2.21 | ||
| 1,4-VDW | 13.11 | 12.92 | ||
| Dipole/Dipole | -1.72 | -2.01 | ||
| Total - MM2 | 47.84 | 41.38 | ||
| Total - MMFF94 | 70.55 | 60.56 | ||
Functionalisation of the Alkene

The alkene in the stable thermodynamic taxol intermediate (10), has been shown to have surprisingly slow reactivity. This observation can be explained by the hyper-stabilization of alkenes[10]. The alkene in compound 10, found at the bridge head, has a C-C=C bond angle of 123o. This is very close to the ideal value of 121o for an sp2 centre carbon and so the system has very little so-called strain energy. However, once hydrogenated the now saturated bond has a bond angle of 118o, a sizable distance from the an ideal sp3 bond angle of 109o. This leads to a large increase in strain energy making the functionalisation of bridge-head alkenes an unfavourable process. This is reflected by the relative bending energies of the two compounds. The hydrogenated compound has a much higher bending energy supporting the increased strain caused by the hydrogenation process.
| Energy in (kcal/mol) | ||||
| Compound 10 | Compound 10 Hydrogenated | |||
|---|---|---|---|---|
| Stretch | 2.60 | 3.15 | ||
| Bend | 10.42 | 15.86 | ||
| Stretch/Bend | 0.29 | 0.65 | ||
| Torsion | 19.37 | 22.36 | ||
| Non 1,4-VDW | -2.21 | 0.02 | ||
| 1,4-VDW | 12.92 | 15.38 | ||
| Dipole/Dipole | -2.01 | -1.76 | ||
| Total - MM2 | 41.38 | 55.65 | ||
| Total - MMFF94 | 60.56 | 81.55 | ||
Regioselective Addition of Dichlorocarbene
The Molecular Mechanics approach used thus far, whilst able to accurately calculate minimum energy conformations, cannot compute molecular orbital interactions. By using semi-empirical molecular modeling techniques we are able to model specific electronic distributions and hence more accurately describe bonds and reactivity as well as generate spectroscopic data.

The above reaction highlights this perfectly and shows the power of molecular modeling. It has been shown that the compound 12 reacts readily with electrophiles such as dichlorocarbene with high selectivity[11]. Studies have shown that attack occurs at the alkene syn to the Cl atom. This observation can be explained by examining the molecular orbitals and hence electron distribution in compound 12.
Molecular Orbitals
 |
 |
 |
 |
 |
 |
 |
 |
 |
 |
The molecular orbitals displayed above were generate using ChemBio3D Ultra. The lowest energy conformation of compound 12 was first found using MM2 calculations and then the molecular orbitals generated using MOPAC/PM6. It is noted that the generated wave functions do not completely match the symmetry of the compound. This is due to a programming bug and can be avoided by using GaussView, a quantum mechanical approach, the results of which are also shown above for comparison.
It is clear from the molecular orbital simulations that the HOMO lies predominantly on the syn-alkene whereas the LUMO lies almost exclusively on the anti-alkene. This means that the anti-alkene is electron deficient and hence a poor nucleophile. The syn-alkene on the other hand is clearly much more electron rich and so is able to act as the nucleophile in the reaction shown above.
In addition there is extra stabilization of the anti-alkene due to the overlap of the σ*C-Cl (LUMO+2) and the πC=C(anti) (HOMO-1)orbitals[12]. This interaction stabilizes the anti-alkene, relative to the syn-alkene, by approximately 0.08eV[13] rendering it less nucleophilic.
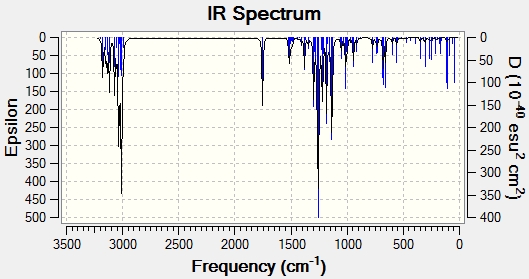
Infrared Spectroscopy
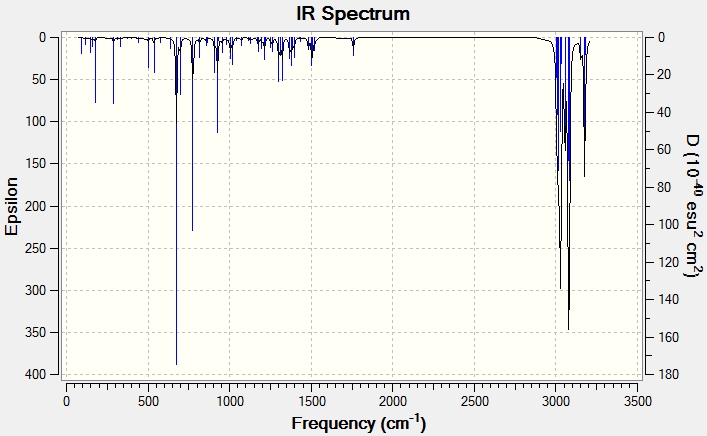
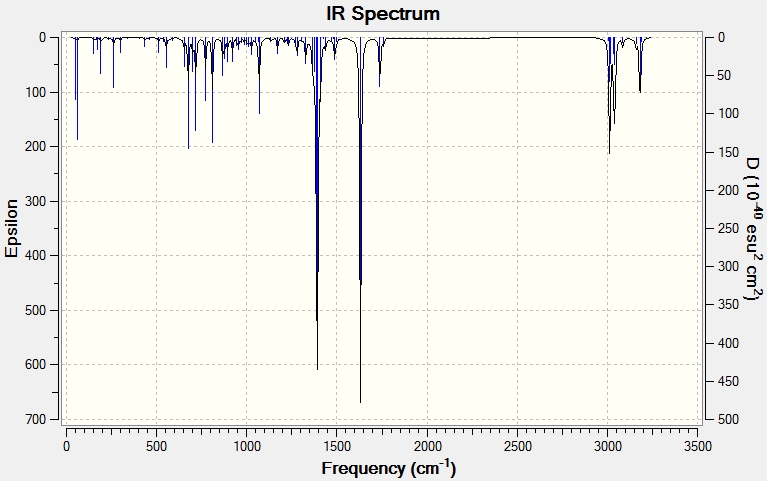
The IR data displayed below supports the presence of LUMO+2/HOMO-1 interactions. When the anti-alkene is present electron density is donated into the σ*C-Cl bond hence weakening it. This is observed in the IR spectra as a decrease in stretching frequency. The C-Cl frequency for the monoalkene is 4.15cm-1 higher ie. the bond is stronger as there is no donation into the σ*C-Cl bond. In addition, there is a small difference in the stretching frequencies of the two alkenes in the dialkene. The anti-alkene loses electron density due to the LUMO+2/HOMO-1 interaction and so is weakened causing it to have a lower stretching frequency.
| Stretch Frequencies (cm-1) | |||
| C-Cl | C=C (Syn) | C=C (Anti) | |
|---|---|---|---|
| Dialkene (12)- Display IR | 770.81 | 1757.42 | 1736.95 |
| Monoalkene (13)- Display IR | 774.96 | 1758.06 | - |
Substitution of the Anti-Alkene


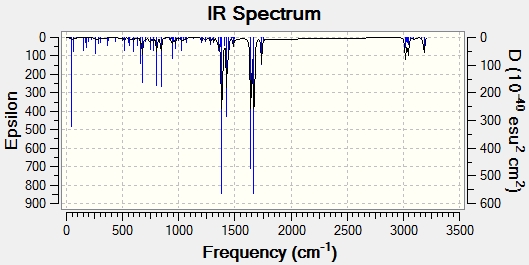
Modifying the substituents on the anti-alkene further supports the presence of LUMO+2/HOMO-1 interactions. The IR data below shows that when the anti-alkene is substituted with an electron withdrawing group (EWG) such as NO2, the C-Cl stretching frequency increases. This is because EWGs take electron density out of the alkene C=C bond hence reducing the donation into the anti-bonding σ*C-Cl bond making it stronger relative to the unsubstituted equivalent. This effect is further enhanced by an EWG di-substitution.
Conversely an electron donating group (EDG), such as OMe, donates electron density into the C=C bond, increasing the donation into the σ*C-Cl bond thus decreasing the bond strength and stretching frequency. An unexpected result was observed for the di-substitution using OMe. One would expect the effect to be enhanced as with EWGs, thus further decreasing the C-Cl bond strength. However, the C-Cl and C=C bond strengths were seen to increase. Perhaps more interestingly, upon modeling the MOs for the di-OMe-substituted compound, the HOMO was found to reside on the anti-alkene suggesting that it would be the anti-alkene bond that would react as a nucleophile with dichlorocarbene. In addition it can be seen that no electron density is found on the anti-alkene in the HOMO-1. This suggests that the aforementioned лC=C (anti) /σ*C-Cl interaction is no longer possible explaining why both the C-Cl and C=C(anti) IR frequencies are higher relative to the non-substituted compound (12).
| Stretch Frequencies (cm-1) | ||||
| C-Cl | C=C (Syn) | C=C (Anti) | ||
|---|---|---|---|---|
| EWG | Mono-NO2 Substitution (14)- Display IR | 771.53 | 1758.06 | 1738.87 |
| Di-NO2 Substitution (15)- Display IR | 776.76 | 1757.75 | 1737.69 | |
| EDG | Mono-OMe Substitution (16)- Display IR | 765.13 | 1756.34 | 1736.57 |
| Di-OMe Substitution (17)- Display IR | 772.90 | 1755.78 | 1751.67 | |
Monosaccharide Chemistry: Glycosidation
It is noted that for the purpose of this task OMe groups were used as the R-substituants. OMe is a small substituent and so will allow the minimized energy calculations to be processed more accurately and on a relatively short time scale. Larger groups lead to additional interactions that may disrupt the calculations and using H would lead to H-bonding interactions which also make the calculations more complicated. This system is also a key example for demonstrating the difference between MM2 and MOPAC calculations as discussed in the introduction to this module.

The glycosidation of monosaccharides is known to be highly selective due to the neighboring group effect[14] between the carbonyl oxygen in the OAc group and the carbon atom double bonded to the oxygen atom in the ring. When the OAc group is in the equatorial position (structure A), this neighboring group participation (C) causes the incoming nucleophile too attack from the top face adding into the equatorial position forming the α-anomer. Conversely, when the OAc group is axial (structure B), the incoming nucleophile attacks from below adding into the axial position, forming the β-anomer.
The neighboring group effect can be shown by examining the distances in A and B between the OAc carbonyl O and the carbon atom double bonded to oxygen in the ring. If this distance is observed to be bonding (<2Å) we can conclude that neighboring group participation is indeed taking place and structures C and D will form, hence determining the mode of nucleophilic attack. It must be remembered that distances calculated after MM2 minimization will always show non-bonding interactions as MM2 will not created new bonds within the molecule. MOPAC on the other hand is capable of creating 'new bonds' hence why we will only consider distances observed after using MOPAC calculations.
It is clear from the reported C-O distances below, that both compounds A and B are able to form this neighboring group bonding interaction and hence stabilize the structure before nucleophilic attack. For this reason we would expect, and do indeed observe, A and C as well as B and D to be extremely similar in energy as they are essentially the same. There is a small discrepancy between A and C, however this is most likely due to an error in the initial conformations.
In addition, it is clear that the ring flipped versions of both A and B, A' and B', are both higher in energy, thus less stable, and also cannot participate in neighboring group stabilization. This is shown by the non-bonding C-O distances, calculated using MOPAC/PM6, which are both >2 angstroms for the two ring flipped conformers. This inability to form bonding interactions between the C and O atoms suggests that conformers A' and B' are unable to achieve a conformation in which the Bürgi-Duntiz angle of 109° can be obtained. Visualizing the MOPAC conformations in 3D (see links below) further supports this, showing attack angles of 155.1° and 133.6° for A' and B' respectively, both of which are far from the ideal Bürgi-Duntiz angle. In addition conformers A and B show attack angles of 104.4° and 105.8° respectively, supporting the explanation of stabilization due to neighboring group participation.
| Energy in (kcal/mol) | Â | |||||||||||
| Visualise | Stretch | Bend | Stretch/Bend | Torsion | Non 1,4-VDW | 1,4 VDW | Charge/Dipole | Dipole/Dipole | Total MM2 | Total MOPAC | C-O Distance (MOPAC) | |
|---|---|---|---|---|---|---|---|---|---|---|---|---|
| A | 2.70 | 9.09 | 0.90 | 2.35 | 0.25 | 19.36 | -20.95 | 7.29 | 20.98 | -89.25 | 1.6 | |
| A' | 2.61 | 9.53 | 0.86 | 3.81 | -1.10 | 18.53 | -6.56 | 4.73 | 32.42 | -77.93 | 2.8 | |
| B | 2.82 | 10.72 | 0.99 | 2.55 | 0.85 | 18.93 | -21.46 | 5.51 | 20.89 | -88.73 | 1.6 | |
| B' | 2.39 | 9.87 | 0.84 | -0.20 | -1.79 | 17.52 | -5.64 | 3.90 | 26.88 | -75.35 | 4.2 | |
| C | 2.01 | 13.42 | 0.72 | 10.10 | -3.05 | 18.17 | -9.02 | -2.36 | 29.98 | -91.66 | - | |
| C' | 2.87 | 19.60 | 0.90 | 10.11 | -1.97 | 20.07 | -0.34 | -1.45 | 49.40 | -66.87 | - | |
| D | 1.83 | 19.26 | 0.82 | 8.85 | -3.20 | 17.27 | -7.53 | -1.45 | 35.85 | -88.53 | - | |
| D' | 2.74 | 21.06 | 0.88 | 7.34 | -2.30 | 18.00 | -2.55 | -1.23 | 44.06 | - 67.01 | - | |
Interestingly, the intramolecular charge/dipole interactions between the oxonium ion and carbonyl O(δ-) can be seen to vary dramatically between the 'normal' A and B structures and their ring flipped versions. It is clear from the 3D visualizations that the distance between this groups in the ring flipped conformers is much larger and so they do not experience the added stabilization found in their 'normal' counterparts.
This computational exploration of conformational stability has clearly shown the high dependence of a number of energetic properties on specific spacial orientations and hence displayed the power of computational chemistry in not only predicting but also explaining chemical reactivity.
Mini Project
Introduction
The power of computational chemistry is an invaluable tool for synthetic chemists. In most reactions there will be several possible isomeric products and it can often be difficult to distinguish them using analytical techniques alone. Computational predictions of analytical data can be extremely useful in determining which isomer has been synthesized and can be used to disprove the formation of another. This is what we will try to demonstrate here using an interesting compound known as Cubebol to do so.
Cubebol is a naturally occurring compound found in plants and insects. In fact, it has been found to be one of the major components in the bark of Pseudocedrela kotschyi, a savannah tree used in Togo as an ulcer treatment [15]. It is used in the food as a cooling-agent and was first patented only recently in 2001 by a large flavour company[16]. Its taste is described as cooling and refreshing and hence is used in chewing-gums, ice-creams, drinks and many more consumable products.
Its interested from a synthetic point of view comes in the high selectivity required for its synthesis. The overall synthesis of cubebol involves many steps and there are plenty of possible isomers that can be formed along the way [17]. Here we will focus on just one of these isomers, the so-called 10-epicubebol form.

For simplicity the full synthetic pathway for 10-Epicubebol has not been shown however is very similar and can be seen here DOI:10.1021/jo9022974 .
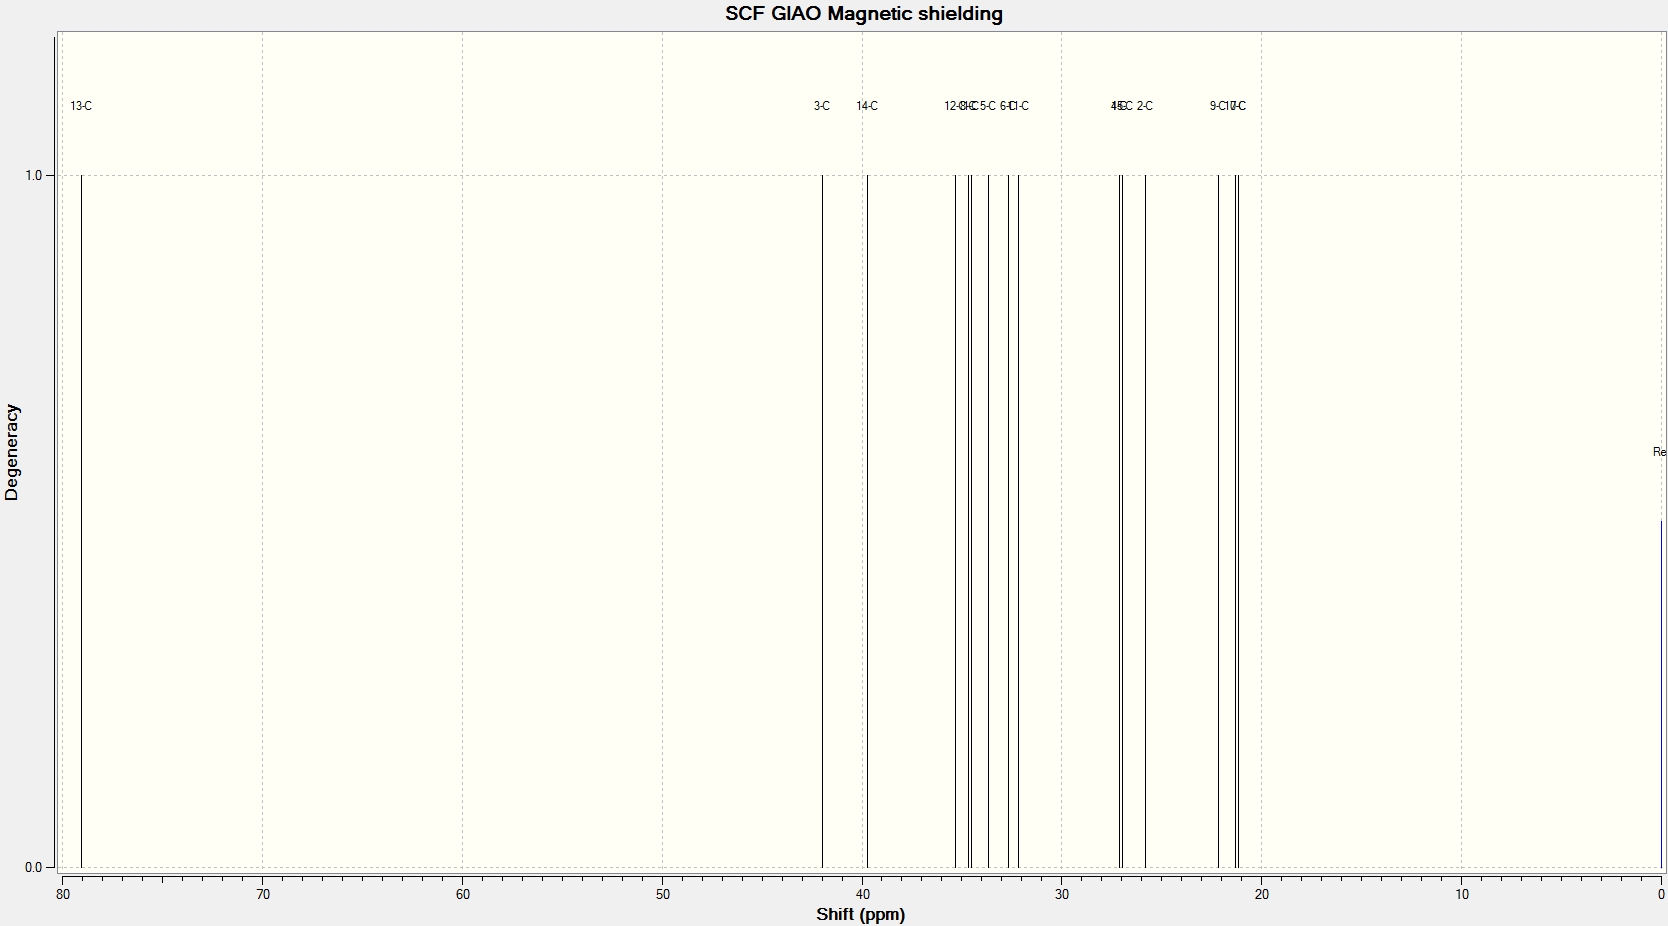
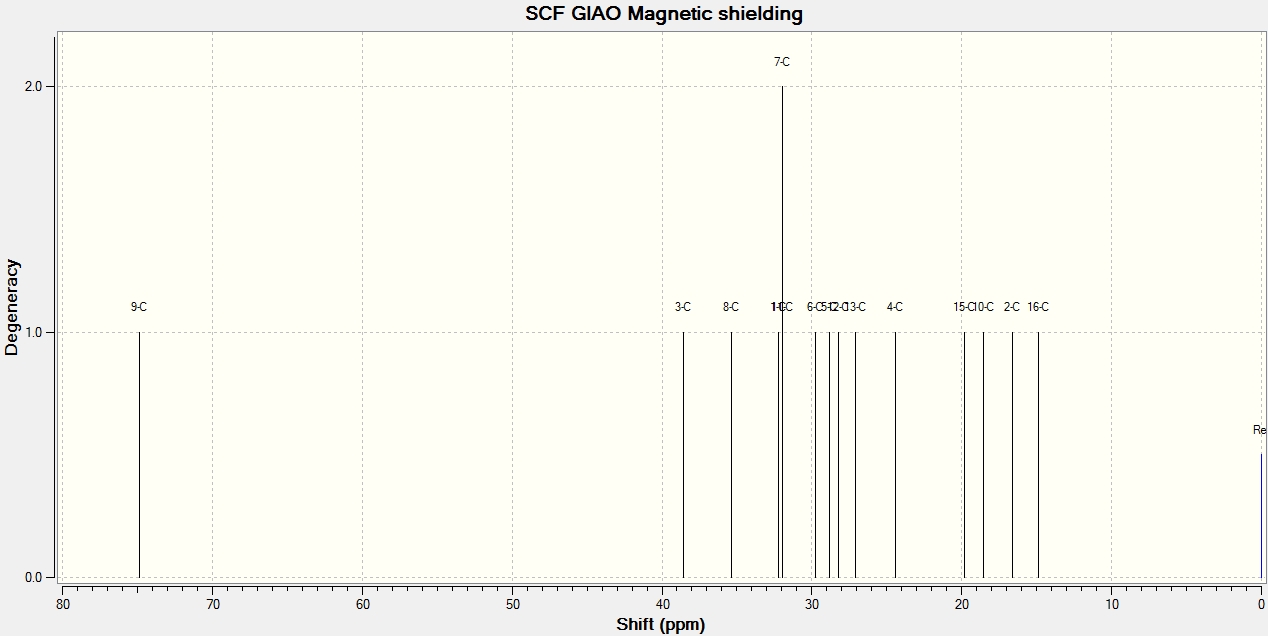
NMR Analysis


Before employing computational analysis as a tool to differentiate between to isomers by comparing spectroscopic data it is first necessary to verify that the data generated is in itself accurate. This can be done by comparing the generated spectra with experimental data from the literature. Whilst this does assume that the literature data is correct it is a valid way to check that the calculated data is at least reasonable.
|
| ||||||||||||||||||||||||||||||||||||||||||||||||||||||||||||||||||||||||||||||||||||||||||||||||||||||||||||||||||||||||||||||||||||||||
Most of the calculated data is within ±5ppm, the so-called NMR error range, of the literature data and so can be said to be reasonably accurate. The bar-charts to the right shows this graphically and suggests that for cubebol the error is most likely a systematic positive error in the DFT model whereas epicubebol shows systematic negative error.
Now that we are sure the computational data is reasonable we can look to use it as a method of differentiating between the two isomers 1 and 2. In order to use NMR data to differentiate between the two we must find a common carbon environment in which the corresponding peaks are different enough to be contrasted without falling into the so-called error range. We would expect carbon number 6 to be the most varied as it is the carbon site at which the geometry is altered however the computed data shows that they are only 4.0ppm apart and literature values show a difference of just 0.2ppm. This means that chemical shifts for carbon number 6, the data for which has been highlighted in red in both sets of tables, fall within the error range and so can not be used as a comparative tool.
Carbon number 2, at first appears to be different enough to allow comparison however upon further analysis we see that this is not the case. First of all we can see that the calculated data for these environments are very accurate when compared to the literature with only a 0.6 and 0.1ppm difference for cubebol and epicubebol respectively. However, comparing the NMR data for this carbon atom in both conformations shows that both the literature and calculated values again fall inside of the 5ppm error range and thus cannot be used.
Unfortunately we have found that carbon-NMR data, both computed and experimental, is not a valid comparative tool. Ideally the H1-NMR would be examine in the same manor to yield more useful comparative data as the H environments will be different enough to be used comparatively. Although this may sound straight forward, H-NMR calculations are far more complex and hence not entirely reliable so, at least for now, calculated H1-NMR would prove equally unhelpful.
|
| ||||||||||||||||||||||||||||||||||||||||||||||||||||||||||||||||||||||||||||||||||||||||||||||||||||||||||||||||||||||||||||||||||||||||
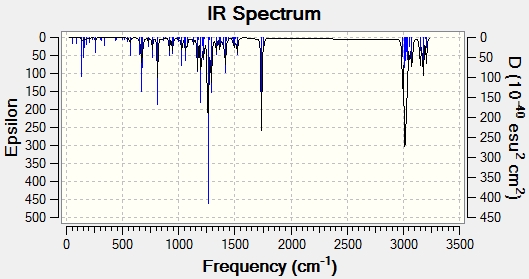
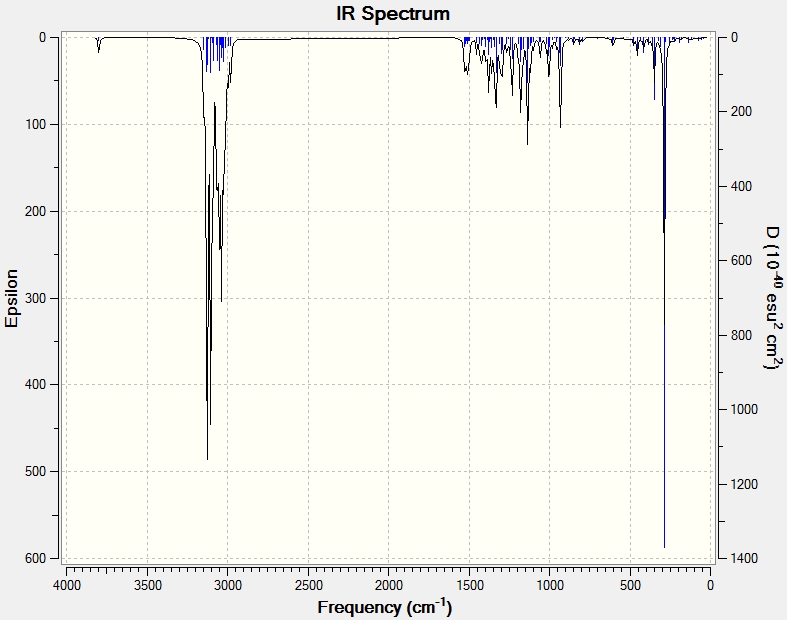
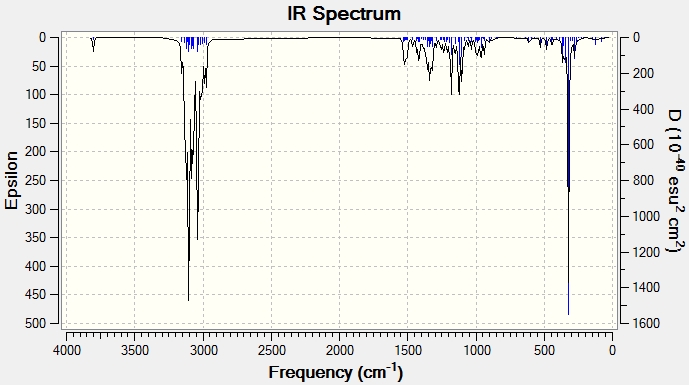
IR Analysis
The same process of data comparison can be applied to IR spectra however we would expect there to be very little difference between the spectra of the two isomers. Here we can see that the C-H2 frequencies (highlighted in red) are varied enough to act as a differentiating tool. One explanation for this possible difference could be that when the Me and CH(CH3)2 groups on the 6-membered ring are point in the same direction (epicubebol), the CH2 groups on carbon numbers 1 and 2 experience more steric crowding and so essentially vibrate less. This would support the observed lower frequencies for the CH2 groups in epicubebol.
|
| ||||||||||||||||||||||||||||||||||||||||||||||||||||||||
Additional Analysis
Although optical rotations can also be calculated using computational methods the values are often not as reliable as those for NMR and IR analysis. It is most useful when comparing two isomers that polarize light in opposing directions ie. - and +. As the two aforementioned isomers are both "negative", (-)-Cubebol and (-)-10-Epicubebol, optical rotation was not seen as a valid comparative technique and therefore has not been included.
In experimental analysis is it often useful to use melting points as indicators for which product has been synthesized. Of course it would therefore be extremely useful to be able to generate modeled melting points however this poses a significant problem for computational chemists and has not as of yet been achieved. The problem of phase boundaries is very difficult to tackle using computational methods, however perhaps in years to come melting points we be another key tool in every computational chemists arsenal.
Further Research
In 2006 Dr. Charles Fehr and José Galindo explored the problem of stereoselectivity in the synthesis of (-)-Cubebol. They found that the use of Pt-, Au- and Cu- catalysts achieved extremely high face-selectivity and they also revealed interesting characteristics of the intermediates and of the overall reaction itself DOI:10.1002/ange.200504543 .
References
- ↑ http://www.nobelprize.org/nobel_prizes/chemistry/laureates/1950/
- ↑ Nicolaou, K. C., Snyder, S. A., Montagnon, T. and Vassilikogiannakis, G., 2002, Angewandte Chemie International Edition, 41; DOI:10.1002/1521-3773(20020517)41:10
- ↑ DOI:10.1021/ja00738a045
- ↑ DOI:10.1021/ja00738a045
- ↑ DOI:10.1021/ja00738a045
- ↑ DOI:10.1016/S0140-6736(95)92654-2
- ↑ DOI:10.1038/367630a0
- ↑ http://www.rzepa.net/blog/?p=5345
- ↑ DOI:10.1016/S0040-4039(00)92617-0
- ↑ Wilhelm F. Maier, Paul Von Rague Schleyer, J. Am. Chem. Soc., 1981, 103, 1891. DOI:10.1021/ja00398a003
- ↑ DOI:10.1039/P29920000447
- ↑ DOI:10.1039/P29920000447
- ↑ DOI:10.1039/P29920000447
- ↑ DOI:10.1016/j.carres.2007.03.030
- ↑ DOI:10.1002/ffj.125
- ↑ M. I. Velazco, L. Wuensche, P. Deladoey (Firmenich SA), US patent 6214788, 1999; [Chem. Abstr. 2000, 133, 265959]
- ↑ DOI:10.1021/jo9022974
- ↑ DOI:10.1021/jo9022974
- ↑ DOI:10.1021/jo9022974
- ↑ DOI:10.1021/jo9022974
- ↑ DOI:10.1021/jo9022974
- ↑ DOI:10.1021/jo9022974