Rep:Module2:rp1207
Module 2: Inorganic Lab
BH3
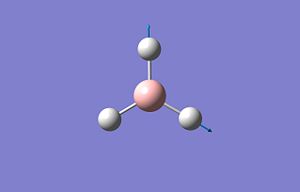
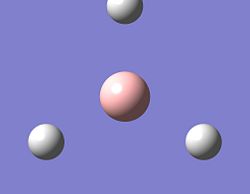
A planar BH3 molecule was modelled using GaussView 5.0 with the B-H bond lengths all set to 1.5Å. An optimisation was carried out using gaussian and a table summarising the results is shown below. All values are given to 2 d.p for the entire report unless otherwise stated.
| Bond Length (Å) | 1.19 | |
| Bond Angle(°) | 120 | |
| Total Enery (a.u.) | -26.46 | |
| Calculation Type | FOPT | |
| Calculation Method | RB3LYP | |
| Basis Set | 3-21G | |
| Charge | 0.00 | |
| Dipole Moment (Debye) | 0.00 | |
| RMS Gradient Norm (a.u) | 0.00 |
The exact root mean square gradient=0.00020672a.u.(8d.p)as this is <0.002 then the optimisation can be assumed to have been successful. The optimised B-H bond length also shows good agreement with literature values of 1.20Å1 (2d.p)
 |
 |
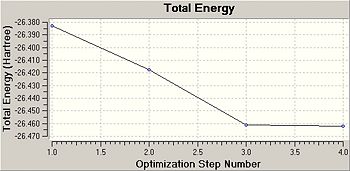
As can be seen from the above plots as the optimisation continues the total energy of the molecule decreases, optimisation is complete when the minumum total energy has been reached. Another variable that is measured during optimisation is the root mean square (RMS) gradient. The gradient represents the gradient of a Potential Energy vs Internuclear distance curve and should reach zero at the minimum energy where internuclear distance (r) is at equilibrium. As can be seen from the above plot the RMS gradient is close to zero when the optimisation of BH3 is complete.
Gaussview does not draw bonds between the B and H atoms in the BH3 molecule. This is because as a computer programme GuassView follows certain rules based on a set limit therefore if an internuclear distance falls above a set limit, in this case HOW MUCH?? then bonds will not be drawn. Obviously this does not mean that the B and H atoms have not formed a bond as this cannot be defined in an arbituary way and a set limit cannot be garunteed.
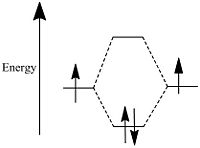
A bond can be defined as when the valence orbitals of two or more atoms overlap efficiently enough to produce n (n=number or atomic orbitals), molecular orbitals made up of bonding and antibonding moelcular orbital.
In the formation of a bond the total energy of the occupied molecular orbitals is lower than the total energy of the separate atomic orbitals, as shown pictorially in the diagram below.
Molecular Orbitals

The moelcular orbitals for the BH3 molecule was calculated using Gaussian and posted on D-space2. Molecular Orbital (MO) 4 is the Highest occupied molecular orbital and MO 5 is the Lowest Occupied molecular orbital (LUMO).
| Molecular Orbital Number | Image | Relative Energy | |
|---|---|---|---|
| MO 1 |  |
-6.81236 | |
| MO 2 |  |
-0.47602 | |
| MO 3 |  |
-0.32819 | |
| MO 4 |  |
-0.32819 | |
| MO 5 |  |
-0.08769 | |
| MO 6 |  |
0.04379 | |
| MO 7 | 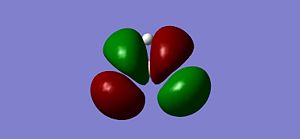 |
0.10608 | |
| MO 8 |  |
0.10608 |
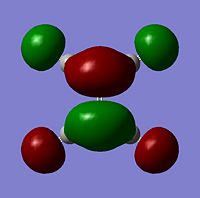
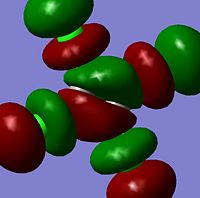
It can be seen that MO1 relates to the first S orbital on Boron and shows no interaction with the H orbitals. This can confirm that this is a non bonding orbital that plays no part in the molecular orbitals that hold the molecule together. As can be seen from the relative energies of the orbitals this orbital has a much lower energy than lose above it, this provides some explanation as to why thsi is a non bonding orbital as in order for efficient overlap to orrur atomic orbitals much have similar energies. MO to relates to a bondign between the B and all three of the H atoms which all have an electron density donated to them from this orbital. MO 3 and 4 are degenerate orbitals which occur due to the symmetry of the molecule. These are the HOMO of the molecule. As MO 5-8 are unoccupied they do not contribute to the overall energy of the molecule unless it undergoes any further interaction with other molecules.
Vibrational Calculations

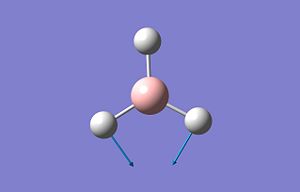
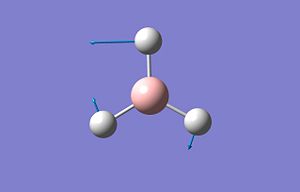
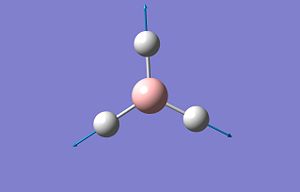
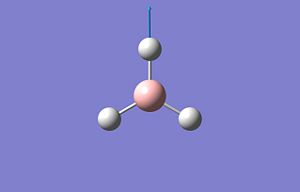
As can be seen from the above table each vibration corresponds to a symetry factor of the molecule. Vibration 4 is not seen as IR is only sensitive to changes in dipole moment, as can be seen from the image, the movement of vibration 4 does not result in any change of dipole moment hense has a intensiy of 0. Vibrations 2 and 3 as well as 5 and 6 are degenerate and therefore are superimposed on each other. The result of this is that although there are 6 vibrations predicted only three peaks are observed in the IR spectrum.
Natural Bond Orbital Analysis
Natural bond analysis was used both in Guassian and GuassView to good effect. Using this tool the natural charges for the Boron and Hydrogen atoms could be calculated. These figures can easily be compared with chemical intuition for example the Lewis deficient Boron atom will be expected to have a positive charge and as we know the the molecule has no overall charge it is expectd that the sum of the charges will be equal to zero.
The tool was used both qualitively and quantitatively and gave an output of the molecule both with colour representign charge and with numberial charge shown on the individual atoms as shown below.


As can be seen the Boron atom has been calculated to have a formal charge of 0.198 and the H atoms each have a formal charge of -0.066. As can be seen these values are spread as expected and have a total of 0.
References
1. DOI:10.1021/jp9726246 2. Reference the D-space MO calculation# 3. http://www.webqc.org/printable-symmetrypointgroup-ct-d3h.html 4. BH3 Opt; https://www.ch.ic.ac.uk/wiki/images/0/03/Bh3_optimisation.txt 5.BH3 Freq; https://www.ch.ic.ac.uk/wiki/images/8/8a/Rp1207_BCL3_FREQ.LOG 6. BH3 MO;https://www.ch.ic.ac.uk/wiki/images/6/60/Rp1207_BH3_MO.LOG
BCl3
A BCl3 molecule was modelled using GaussView and the point group fixed as Dh3, the molecules geometry was then optimised using Guassian and the results were summariesed in the table shown below;
| Bond Length (Å) | 1.87 | |
| Bond Angle(°) | 120 | |
| Total Enery (a.u.) | -69.44 | |
| Calculation Type | FOPT | |
| Calculation Method | RB3LYP | |
| Basis Set | LANL2MB | |
| Charge | 0.00 | |
| Dipole Moment (Debye) | 0.00 | |
| RMS Gradient Norm (a.u) | 0.00 |
As can be seen from the above table the gradient is ,0.002a.u. therefore the optimisation of the molecule can be assumed to be complete.
Although this molecule is of the same point group as BH3 and has the same geometry (ond angles, number of atoms) the B-Cl bond length is longer than the B-H bond length, this is expected as the Cl atoms are substantially larger than H atoms with more orbitals occupied by electrons hence more repulsion so that the equilibrium distance between the nuclei is longer.
Reference bond lengths for B-Cl in a BCl3 molecule show good agreement with the calculated value, reference=1.84Å (2d.p)1 which compared well with the calculated length of 1.87Å.
IR Analysis
| Image | Frequency cm-1 | Infrared | |
|---|---|---|---|
 |
214.13 | 3.9341 | |
 |
214.13 | 3.9343 | |
 |
376.94 | 43.7751 | |
 |
417.38 | 0.0000 | |
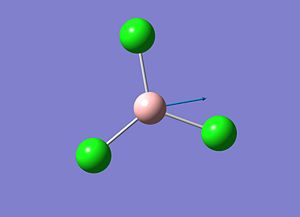 |
939.47 | 258.6856 | |
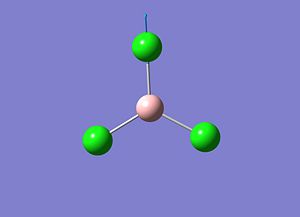 |
939.47 | 258.6884 |
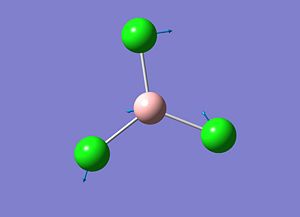
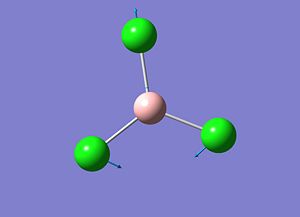
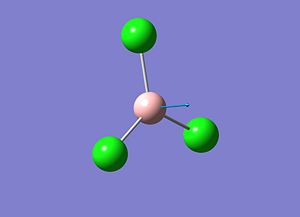
As can be seen from the above image the most striking aspect of the absorbances, is the degeeracy of the highest and lowest frequencies. This is probably because of the symmetry of the molecule which results in degenerate bonds which can be excited at the same frequencies. Also there is a lack of absorbtion in the fourth vibration due to the vibration not being responsibile for a change in dipole moment therefore this will not be detected in the IR spectra.
The frequencies obtained from both BH3 and BCl3 confirm that the optimisation is complete as not only did the enegry sufrace of optimisation have a value of 0 but also the IR analysis shows good agreement with what chemical intuition would predict for these molecules, for example there are no negative frequencies and those produced fall within a reasonable range.
References
1. DOI:10.1107/S1600536806047118 2.BCl3 Opt; https://www.ch.ic.ac.uk/wiki/images/1/18/PATCHETT_BCL3_OPT.LOG 3.BCl3 Frequency;BCl3 Opt;
Mo(CO)4L2 Isomers
During this section of the project the geometry, energies and IR frequencies of the cis and trans-Mo(CO)4(PCl3)2 isomers.
To begin with the ground state of each isomer was optimised "loosely" using a B3LYP method1,2. The optimised results return a structures no P-Cl bonds shown, this as before is because Guassview has a set length with constitutes a bond and the programme does not draw in bonds for atoms which exceed this length. This does not mean that a bond is not present between these two atoms just that the bonds are longer than Guassview recognises.
As this is a low level optimisation it is perfectly reasonable that the molecule may have optimised not to the correct orientation but another localised minima. In order to optimise the molecules to the correct minimer the geometry of the molecules were adapted using Guassview and then another optimisation was run in order to calculate the minima within the selected geometry. In order to see an improvement in the second optimisation of the Mo(CO)4(PCl3)2 molecules the geometry after the first optimisation was modified, for the trans isomer the P-Cl3 groups were drawn so that they ecliped each other and so that one P-Cl bond for each group eclipsed the Mo-C bond.
It was found suprising that the optimised trans molecule was eclipsed which is intuitively assocoiated with higher energy due to van der vaals repulsions however this optimisation can be rationalised as the distance between the eclipsed groups is relatively large and as van der vaals interations depend on the inverse of the distance this effect will be minimised. The other destabilising interaction to be taken into account is the dipole moment of the molecules. By eclipsing the PCl3 groups the dipole moment has been minimalised and the isomer stabilised1,2.
| Property | Cis | Trans | |
|---|---|---|---|
| Calculation Type | FOPT | FOPT | |
| Calculation Method | RBC3LYP | RBC3LYP | |
| Basis Set | LANL2DZ | LANL2DZ | |
| Charge | 0 | 0 | |
| Spin | Singlet | Singlet | |
| Energy a.u | -623.47707195 | -623.57603089 | |
| Energy KJ/mol | -2.7184 X 10⁻¹⁸ | -2.7188 X 10⁻¹⁸ | |
| RMS Gradient | 0.0000689 | 0.00001244 | |
| Dipole.Debye | 1.3102 | 0.3043 | |
| Point Group | C1 | C1 | |
| Computing Time | 1hr 19mins 4sec | 43min 42sec |
As can be seen from the above table, the isomers haev been calculated to have almost identical energies although the cis isomer has been calculated to be more energetically stable than the trans isomer this is only by approximately 0.0004KJ/Mol. The main difference between the two isomers is the Dipole moment. Although the Cis isomer has a lower total energy it's dipole moment ~1.31D compared to the trans isomer which has a dipole moment of ~0.30D.
Vibrations
After the optimisation of the isomers was completed the optimised structures were used to calculate the vibrations of the isomers. This was achieved using the same basis set LANL2DZ as the optimisation calculations the results obtained for any calculation are highly dependant upon the method used therefore consistancy is neccisary in order to obtain comparitable results. For example the basis set used was used to find the optimum geometry and a higher level basis set would calculate results for a different electronic state. The frequency analysis of the molecules were diposited in "D-Space" 3,4.
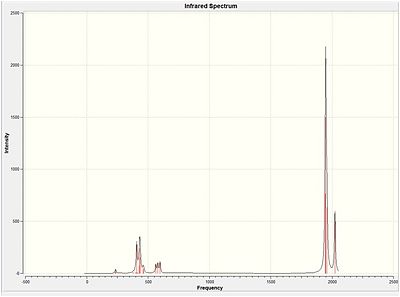
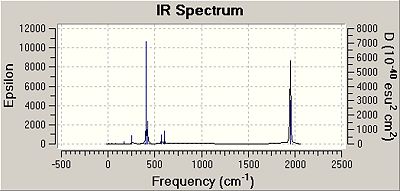
As can be seen below the spectra for these isomers....
| Cis Frequency | Infrared | Trans Frequency | Infrared | |
|---|---|---|---|---|
| 1945.29 | 763.1111 | 1950.35 | 1475.4171 | |
| 1948.63 | 1498.2580 | 1950.98 | 1466.7170 | |
| 1958.33 | 632.5576 | 1977.26 | 0.6112 |
As can be seen from the above table although only one C=O absorbtion would be expected for the trans isomer three are observed. Only one is expected as IR absorbtion corresponds to change in dipole moment, less of these are expected for a symettrical molecule like the trans isomer. The reason why three are observed may be because the trans isomer is not entirely symmetric and even a slight distortion would result in these vibrations causing a change in dipole moment that would be observable in an IR spectrum.
Low Frequency Analysis
Both isomers showed vibrations for low frequencies, the trans isomer showed vibrations at 4.94 and 6.02cm-1 and the cis isomer showed a vibration at 10.69cm-1, these have been amimated and the relating vibrations are shown below;
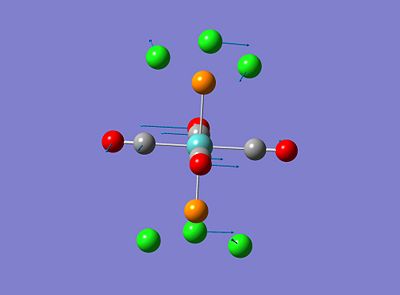
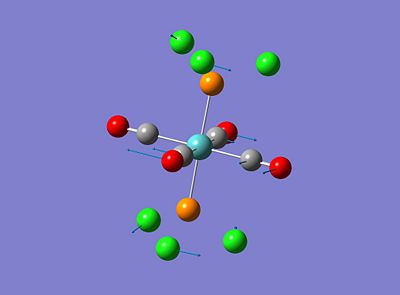
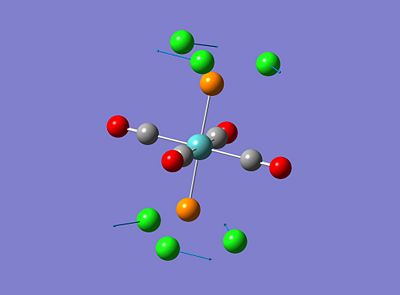
These vibrations occur at low frequencies therefore can be seen to be a result of low energy excitation. This means that these vibrations will be active at low twmperatures such as room temperature.
References
2.((DOI|10042/to-3100))
3.((DOI|10042/to-3098))
4.((DOI|10042/to-3097))
Mini Project
During this project the metal-alkene bonds have been investigated by modelling the following six molecules-in two sets of three, these are two sets of metals and increasing electron withdrawing alkene substituents. The C=C and C-M bond lengths, angles, relative energies, frequencies and molecular orbitals were calculated and results discussed. For simplicity throughout the project these will be known as molecule 1, 2, 3 etc as labelled below.
Free C2H4, C2Cl4 and C2(CN)4
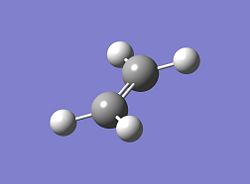
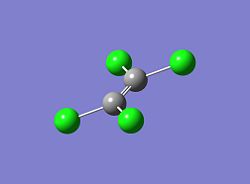
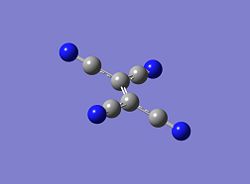
The first thing to consider in this investigation is the structure and bonding of free alkene molecules so that it can be compared with the coordinated equivelent. The alkene fragments were modelled on Guassview, the geometries were optimised using Guassian and using a LANL2DZ basis set-as will be used for the entire project so that results obtained may be fairly compared. The free fragments all have a C1 point group and are planarin structure with bond angles of ~120°. As can be seen in the images.
| C2H4 | C2Cl4 | C2(CN)4 | |
|---|---|---|---|
 |
 |
 |
The results of these optimisations are summarised in the table below;
| Variable | Calculated C2H4 | Calculated C2Cl4 | Calculated C2(CN)4 | |
|---|---|---|---|---|
| Calculation Type | FOPT | FOPT | FOPT | |
| Calculation Method | RBC3LYP | RBC3LYP | RBC3LYP | |
| Basis Set | LANL2DZ | LANL2DZ | LANL2DZ | |
| Charge | 0 | 0 | 0 | |
| Spin | Singlet | Singlet | Singlet | |
| Energy a.u | -78.578208 | -135.897517 | -445.055717 | |
| RMS Gradient | 0.0000000 | 0.00003397 | 0.00004562 | |
| C-C Bond Length/Å(2d.p.) | 1.35 | 1.35 | 1.37 | |
| C-X Bond Length/Å (2d.p.) | 1.09 | 1.79 | 1.42 |
As can be seen from the above table, as the groups on the alkene molcule grow the molecuel becomes more stable, the C=C bond length also grows slightly. This could be due to increasingly electronegativity of the groups which draw electronegativity from the C=C bonding orbital weakening the C=C bond. This can be confirmed by analysis of the IR absorbances which have been nvestigated below.
The C-X bond length varies simply on the overlap of the C and X orbital overlaps, for example C-Cl has much lower overlap due to the size difference between C and Cl so that overlap is weaker, therefore the bond is weaker and therefore longer however the C-H and C-C bonds shwo good overlap therefore are stronger and shorter in length.
The difference between the C-H and the C-C(N) bonds
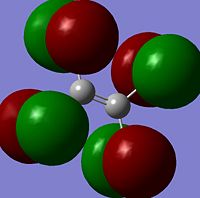
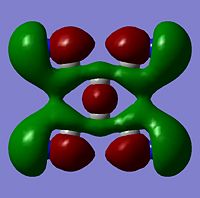
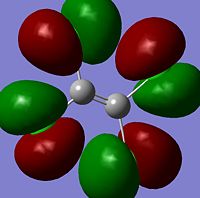
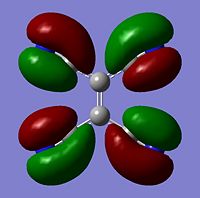
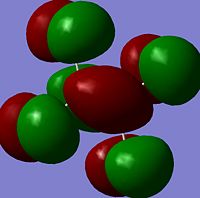
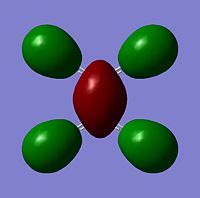
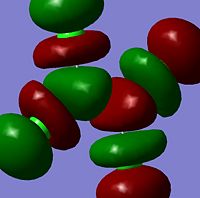
Molecular Orbitals The molecular orbitals of the molecule were modelled using guassview and are shown below;
As can be seen from the above table despite the changing of the groups the electron denity around the C=C atoms in the HOMO LUMO area remains relatively unchanged therefore similar behaviour can be expected from these molecules when they coordinate with the metals. As can be seen from the relative Molecular Orbital energies the alkene's with the electron withdrawing Cl and CN groups have lower energy-and according to these calculations even stabilising energies-therefore it can be expected that when coordinating with a metal these molecules will accept more back bonding into these orbitals which is expected to result in the weakening and therefore lengthening of the C=C bond.
IR Analysis
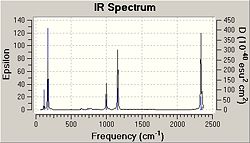
The IR spectrum for free ethene was calculated and the spectrum is shown here;
| C2H4 | C2Cl4 | C2(CN)4 | |
|---|---|---|---|
 |
 |
 |
The vibrations corresponding to this spectrum are as follows;
| C2H4 Frequency /cm-1 | Infrared | C2Cl4Frequency /cm-1 | Infrared | Literature Frequency/ cm-1 | C2(CN)4Frequency /cm-1 | Infrared | |
|---|---|---|---|---|---|---|---|
| 843.04 | 5.39 | 165.81 | 1.64 | 113.92 | 2.86 | ||
| 999.38 | 172.06 | 227.47 | 1.15 | 167.84 | 17.24 | ||
| 1487.06 | 17.96 | 298.18 | 0.001 | 171.34 | 7.91 | ||
| 3142.19 | 18.28 | 711.25 | 79.54 | 500.50 | 0.44 | ||
| 3274.81 | 54.55 | 832.96 | 193.40 | 555.09 | 0.44 | ||
| -- | -- | -- | -- | 639.60 | 0.87 | ||
| -- | -- | -- | -- | 734.78 | |||
| -- | -- | -- | -- | 997.31 | 11.94 | ||
| -- | -- | -- | -- | 1159.53 | 31.16 | ||
| -- | -- | -- | -- | 2337.65 | 37.91 | ||
| -- | -- | -- | -- | 2356.39 | 8.08 |
The IR spectrum confirms that the optimised geometry for all of the molecules are correct as they fall within reasonable values and no negative frequency values have been observed.
References
Metal Complexes
Now that the free fragments have been analysed the complexed fragments can be analysed and compared to their free structures. In order to complete this the molecules were each optimised to a loose approximation and this optimised structure was then optimised again using a LANL2DZ basis set, as well as an energy and dipole moment outputs the bond lengths and angles can be sought using Guasview, this can give a general impression of bond strengths and orbital overlaps before a full analysis of MO is completed. The Results of these optimisations1,2,3,4,5,6 are summarised in the table below; Note in this table X=Substituent On Ethene M=Metal (Pt/Pb)
| Variable | Molecule 1 | Molecule 2 | Molecule 3 | Molecule 4 | Molecule 5 | Molecule 6 | |
|---|---|---|---|---|---|---|---|
| Calculation Type | FOPT | FOPT | FOPT | FOPT | FOPT | FOPT | |
| Calculation Method | RBC3LYP | RBC3LYP | RBC3LYP | RBC3LYP | RBC3LYP | RBC3LYP | |
| Charge | 0 | 0 | 0 | 0 | 0 | 0 | |
| Spin | Singlet | Singlet | Singlet | Singlet | Singlet | Singlet | |
| Energy a.u | -300.51 | -357.81 | -669.33 | -308.10 | -365.40 | -676.91 | |
| Energy KJ/mol | |||||||
| RMS Gradient | 0.00007564 | 0.00012053 | 0.000037 | 0.00001809 | 0.00000905 | 0.00002626 | |
| Dipole/Debye | 4.3880 | 0.1353 | 3.9777 | 4.46 | 1.57 | 2.2996 | |
| Point Group | C1 | C1 | C1 | C1 | C1 | C1 | |
| C-C Bond Length/Å(2d.p.) | 1.42 | 1.47 | 1.49 | 1.39 | 1.42 | 1.45 | |
| C-X Bond Length/Å (2d.p.) | 1.09 | 1.83 | 1.45 | 1.09 | 1.82 | 1.44 | |
| M-C Bond Length/Å (2d.p.) | 2.20 | 2.10 | 2.16 | 2.31 | 2.19 | 2.24 | |
| M-X Bond Angle | 108.4 | 115.0 | 112.2 | 104.4 | 111.6 | 107.6 | |
| X-X Dihedral Angle | 158.5 | 143.1 | 150.8 | 166.7 | 151.1 | 160.4 |
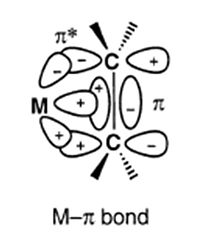
As can be seen from the above table, the C=C bond length increases along molecules 1-3 and 4-6 as the electron withdrawing group (EWG)strength increases. This could be directly due to the electron withdrawing group drawing electron density away from the C=C bonding orbital but also due to this effect the backbonding from the Pt into the C=C antibonding orbital is increased therefore weakening the C=C bond as the Pt bond is strengthened. This argument is supported by the calcualted lengths of the M-C bonds which are seen to be inversely proportional to the length of the C=C bond. The apparently linear relationship between the M-X bond angle and the C=C bond length also reinforces this inherent relationship. As the M-C bond length shortens (and the C=C widens) the angle between the Metal and X substituent increases, this could be due to increased steric repulsion which occurs due to increased electron density between the M and C=C atoms pushing the substituends further away from the centre of the molecule and into free space.
Other than the increased electronegativity the other factor that may be compared using this table is the change in Metal group from Pt to the less diffuse Pd. As can be seen due to the decreased overlap the M-C bond increases in length and the C=C bond shortens due to decreased backbonding from the metal into the π* anti bonding orbital.
The evidence from the table supports the Dewar-Chatt-Duncanson model for metal alkene bondign which can be summaried in the followign diagram7;
References
1. DOI:10042/to-3383
2.DOI:10042/to-3384
3.DOI:10042/to-3385
4.DOI:10042/to-3386
5.DOI:10042/to-3387
6.DOI:10042/to-3388
7.DOI:10.1016/S0022-328X(01)01066-X
IR Analysis
| Molecule 1 Spectrum | Molecule 2 Spectrum | Molecule 3 Spectrum | |
|---|---|---|---|
 |
 |
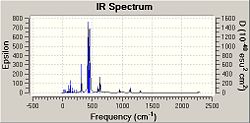 |
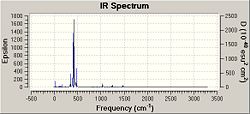
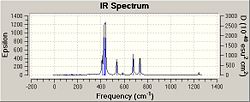
As can be seen from the above spectra the molecules show similar absorbances however these spectra show bond stretches that do not need to be taken into account in this investigations e.g. C-Cl stretches which could be analysed in an extension to this project and may be expected to become higher in energy as C=C bonds grow and as weakening of C=C bond may correspont to movement of electron density away from the C=C pi bond and into teh C-Cl bond. Due to unwanted factors appearing in the spectra the vibrations were animated and specific vibrations relating to M-C and C=C bonds were tabulated for comparison as seen below.
| Molecule 1 Frequency cm-1 | Infrared | Description | Molecule 2 Frequency cm-1 | Infrared | Description | Molecule 3 Frequency cm-1 | Infrared | Description | |
|---|---|---|---|---|---|---|---|---|---|
| 342.75 | 40.4738 | Pt-C Symettric Stretch | 361.36 | 0.8717 | Pt-C Symettric Stretch | 316.78 | 58.6445 | Pt-C Symettric Stretch | |
| 400.34 | 190.9148 | Pt-C Asymettric Stretch | --- | --- | --- | 338.60 | 1.4223 | Pt-C Asymettric Stretch | |
| 466.13 | 77.9726 | Pt-C Symettric Stretch | 433.37 | 57.2840 | Pt-C Symettric Stretch | 596.19 | 18.6157 | Pt-C Symmetric Stretch | |
| 1245.32 | 16.7160 | C=C Stretch | 1245.63 | 21.5432 | C=C Stretch | 1303.42 | 7.1938 | C=C Stretch |
It can be seen that as the group on ethene becomes more electron withdrawing the frequency increases, this increase is small from H to Cl and large (a difference ~58cm-1) from Cl to CN. These differences are probably because it is not only the electronegativity of the substituents that change but also the size and mass. This will effect orbital overlap.
| Molecule 1 Frequency cm-1 | Infrared | Description | Molecule 2 Frequency cm-1 | Infrared | Description | Molecule 3 Frequency cm-1 | Infrared | Description | |
|---|---|---|---|---|---|---|---|---|---|
| 260.75 | 13.3421 | Pd-C Stretch | 226.92 | 1.4204 | Pd-C Stretch | 262.15 | 86.9722 | Pd-C Stretch | |
| 294.65 | 3.7250 | Pd-C Asymettric Stretch | 311.28 | 0.5602 | Pd-C | ||||
| 1315.92 | 6.6728 | C=C Stretch | 1378.50 | 1.6508 | C=C Stretch | 1405.44 | 27.4065 | C=C Stretch |
References 1.DOI:10042/to-3390 2.10042/to-3391 3.10042/to-3394 4.10042/to-3395 5.DOI:10042/to-3397 6.10042/to-3398
MO Analysis
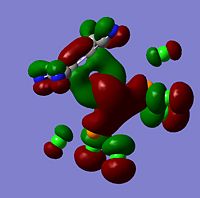
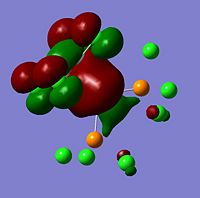
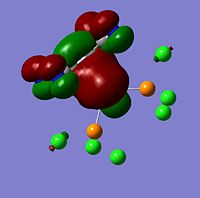
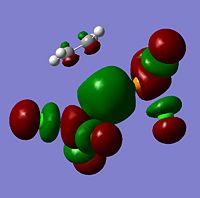
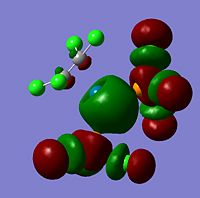
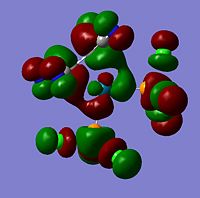
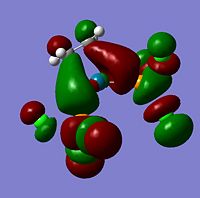
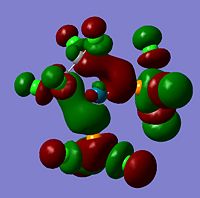
Molecular Orbitals The molecular orbitals of the six metal complexes were modelled using Guassview and a summary of these are shown below;
| (PCl3)2PtC2H4 Energy/a.u.(2d.p) | Image | Description | (PCl3)2PtC2Cl4Energy/a.u.(2d.p) | Image | Description | (PCl3)2PtC2(CN)4Energy/a.u.(2d.p) | Image | Description | |
|---|---|---|---|---|---|---|---|---|---|
| -0.29624 | 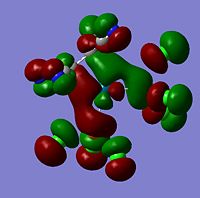 |
HOMO-1 | -0.31400 | 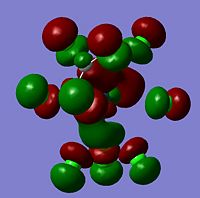 |
HOMO-1 | -0.33508 | 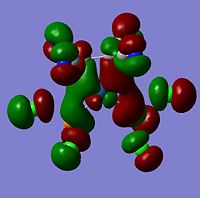 |
HOMO-1 | |
| -0.29624 | 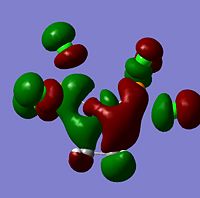 |
HOMO | -0.29114 |  |
HOMO | -0.32854 | 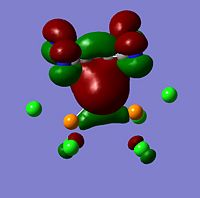 |
HOMO | |
| -0.17110 | File:.jpg | LUMO | -0.18308 |  |
LUMO | -0.20134 | 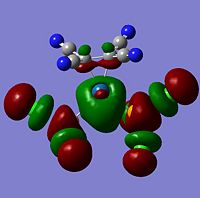 |
LUMO | |
| -0.15379 | 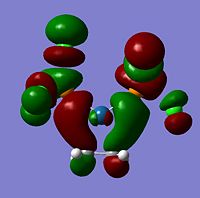 |
LUMO+1 | -0.17256 |  |
LUMO+1 | -0.19850 | 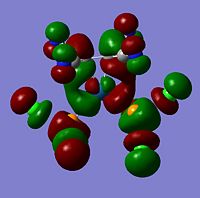 |
LUMO+1 |
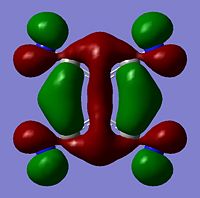
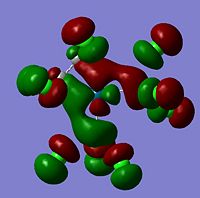
As can be seen from the above images the molecular orbitals around the coordinated ethene molecules are show fairly similar bonding. Those with more strongly electron withdrawing groups show more stabilisation in their HOMO and HOMO-1 orbitals this could be due to the greater electron density around the electron withdrawing groups as they are stabilised by increased electron density. As the HOMO orbitals will result in repulsion between the ethene group and the metal. Molecule 3 shows increased density in the orbitals lying between the C and the metal which forms a good explanation for the lengthening of the M-C bond. However, the spread in Molecule 2 results in shorter C-M bond lengths as the electron withdrawing group results in mroe diffuse electron density however directs it away from the central C-C therefore the distance between the orbitals is increased.
References 1.10042/to-3401
2.10042/to-3392
3.10042/to-3404
4.10042/to-3406
5.10042/to-3407
6.10042/to-3408
Conclusion
From the results it can be seen that electron withdrawign groups result in the lenghtening of the C=C bond in metal coordinated alkenes due to backbonding of electron density from the central metal. Although bulkier electron withdrawign groups pull electron density away from teh C=C bond they also result in more diffuse molecular orbitals which undergo more steric repulsion in the HOMO bond with the central metal, this results in a decreased change in Metal-Carbon and C=C bonds as these two sets of interactions counteact each other. An interestign extension to this experiment would be to inverstigate the change in C=C bond length caused by increase in R group size, from this investigation it would be expected that increased R group size would result in longer Metal carbon bonds due to electron repulsion (sterics) and therefore backbonding would be reduced resultign in a lower electron occupancy in the C=C antibondign orbital therefore shorter C=C bonds.


