Rep:Module2:jzhao
Module Introduction
This module shows the computational methods used to analyse the structure, energy, geometry, MOs and vibrations inorganic compounds. The first part illustrates all the techniques with an example BH3. Then the techniques are applied to analyse Cis-/Trans- isomers of Mo(CO)4Cl2, and complete a mini-project.
Studies on BH3 molecule
Geometry Optimisation
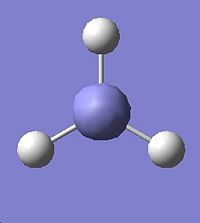
A BH3 molecule was created in Guassview and the three B-H bond lengths were set to 1.5Å. The DFT, B3LYP, 3-21G geometry optimisation (Calculate\Gaussian) was run using Gaussview on the laptop.The saved input file was opened with WordPad, showing:
# opt b3lyp/3-21g geom=connectivity

BH3 optimisation

0 1
 B
etc...
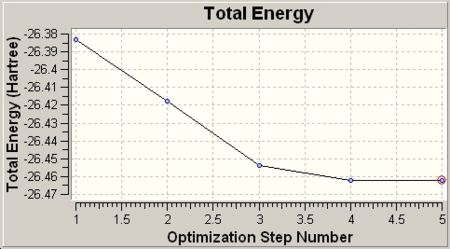
Upon completion of the optimisation, the convergence was checked by viewing the optimisation plot (Results\Optimization) and the output file (Results\View file).
 |
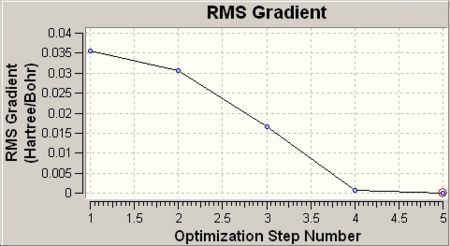 |
The total energy shows a minimum value at -26.46 a.u. and the RMS gradient approaches 0 after 5 step optimisation. The minimum of total energy curve and 0 RMS gradient indicates the optimisation is converged. The output file was also checked to confirm this conclusion.
  Item               Value     Threshold  Converged?
 Maximum Force            0.000006     0.000450     YES
 RMS     Force            0.000004     0.000300     YES
 Maximum Displacement     0.000022     0.001800     YES
 RMS     Displacement     0.000015     0.001200     YES
 Predicted change in Energy=-1.886451D-10
 Optimization completed.
The 4 "YES"s indicates forces and displacements optimisation were converged.
The optimised geometry shows a B-H bond length of 1.19Å and an H-B-H angle of 120o. The results This mathes the geometry of BH3 which has a point group of D3H.
MO Analysis
The .chk file from the optimisation was opened using Gaussview to create a new input file. The optimised BH3 molecule was subjected to MO and NBO analysis by selecting energy as job type and full NBO under NBO tab, and typing "pop=full" in the additional keywords section . The same basis set was used for calculation as in optimisation.
# rb3lyp/3-21g pop=(nbo,full) geom=connectivity

BH3 molecular orbitals

0 1
 B
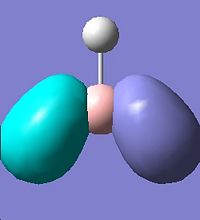
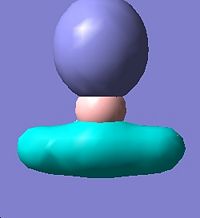
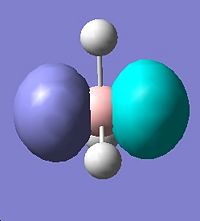
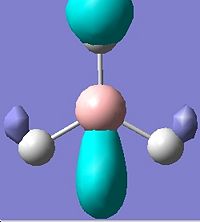
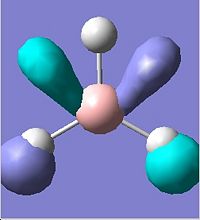
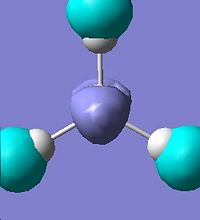
The first 8 molecular orbitals were visualised(Edit\MOs\Visualise)and displayed below:
It is noted that there are two sets of degenerate orbitlas HOMO-1 & HOMO (E=-0.356 a.u.) LUMO+1 & LOMO+2 (E=0.188 a.u.). These will be discussed later after the MO diagram. The MO diagram was constructed below, showing both the MOs from computational calculation and LCAO approach.

The MOs calulated using the computational techniques agree quite well with the orbitals obtained using the LCAO approach. The two sets of degenerate orbitals correspond to the two sets of degenerate orbitals constructed from the p orbitals of boron and hydrogen anti-bonding fragemnt orbital. The computational method also provides more detailed information on the shapes of the orbitals and energy of the orbitals. This advantage is very obvious when comparing the calculated and LCAO obtained two sets of degenerate orbitals.
NMO Analysis
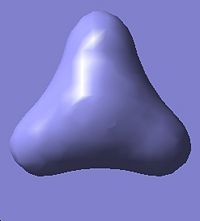
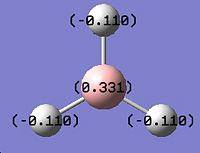
The .log file obtained from the MO analysis was opened with Gaussview. The atomic charge distribution was visualised (Results\Charges) and displayed (figure 1.4):
 |
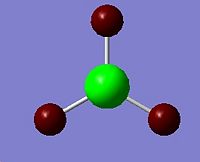 |
The charge numbers are 0.331 for boron atom (green) and -0.110 for hydrogen atoms (dark red).The more detailed information of charge distribution can be found in the Summary of Natural Population Analysis section in the log file.This indicates the boron atom is bearing partial positive charge and hydrogen atoms bearing a partial negative charge, which matches with the fact that boron (2.04)is slightly more electronegative than hydrogen (2.2).
The NBO analysis also gives information on the orbital contribution of each atom to form each bond, the percentages of s/p character in the bond and the the interactions between the variuos MOs by viewing the .log file.
Vibrational Analysis
The optimised geometry was used to create a new input file for vibrational calculation. For the input file, frequency was selected as job type and typing "pop=(full,nbo)" was added to the additional keywords section . The same basis set was used for calculation as in optimisation.
# freq b3lyp/3-21g geom=connectivity pop=(full,nbo)

BH3 frequency

0 1
 B

etc...
The vibrational modes can be viewed in the output file (Results\Vibrations). The 6 vibration modes and the associated frequency, intensity and symmetry were summarised in the table below:
| Table 1.1 - Vibration modes of BH3 molecule | |||||
|---|---|---|---|---|---|
| Number | Form of Vibration | Frequency / cm-1 | Intensity | Symmetry (D3h) | |
| 1 |  |
1146 | 93 | A2'' | |
| 2 | 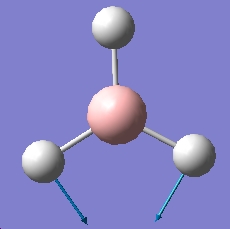 |
1205 | 12 | E' | |
| 3 |  |
1205 | 12 | E' | |
| 4 | 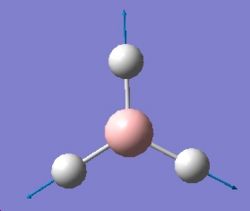 |
2593 | 0 | A1' | |
| 5 | 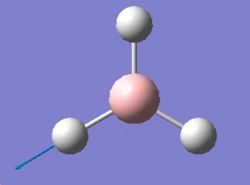 |
2731 | 104 | E' | |
| 6 |  |
2731 | 104 | E' | |
From the table, it can be seen that there are 3 stretching vibration modes (4-6) and 3 bending vibration modes (1-3) in the BH3 molecule. Although there are totally 6 vibration modes, only 3 peaks were observed in the IR spectrum (figure 1.5). This is because
- There are two sets of vibration modes that have the same frequency. As a result, the peaks overlap to give a single peak with higher intensity. This also explains the fact that the intensity of peaks at 2731 and 1205 are higher than any single mode.
- One vibration mode (mode 4) is IR inactive, which gives 0 intensity.

Analysis of BCl3 molecule
Geometry Optimisation
The structure BCl3 was drawn in GuassView. The symmetry of the molecule was restricted to D3h with very tight tolerance (0.0001) to D3h point group. The geometry of BCl3 was optimised using DFT-B3LYP/LanL2MB:
# opt b3lyp/lanl2mb geom=connectivity

BCl3 optimisation

0 1
 B
etc...
All three B-Cl bond lengths after optimisation are all 1.87Å and all Cl-B-Cl bond angles are 120°, which are very close to the literature values 1.85Å and 120°.
Vibrational Analysis
The vibrations were calculated based on the optimised structure using DFT-B3LYP/LanL2MB:
#  freq b3lyp/lanl2mb geom=connectivity

BCl3 freq

 0 1
 B
etc...
6 vibrations were observed for BCl3 molecule. The symmetry of the vibration modes are the same as BH3.
===Answers to Questions on BCl3===
The method used was DFT B3LYP and the basis set used was LanL2MB. The same method and basis set were used in both optimisation and frequency calculation in order to ensure the results are valid. The input file created for frequency calculation is based on the optimisation.
The frequency calculation is carried to view the vibration modes and predict the IR spectrum of BCl3 moleclue.
All three B-Cl bond lengths after optimisation are all 1.87Å and all Cl-B-Cl bond angles are 120°, which are very close to the literature values 1.85Å and 120°.[1]
In some structures gaussview does not draw in the bonds where we expect. This does not mean the bond does not exist. When the bond length is larger than a specific value set by Gasuuview, the bond will not be shown on the program. This often happens for inorganic moleclues as the bond lengths in inorganic molecules tend to be larger.
A bond can be described as sharing of electron density by two or more atoms.
The ground state symmetry of BCl3 is D3h. The geometry of BCl3 was restricted to D3h before optimisation, thus Gaussview uses this symmetry.
The geometry optimisation took 12 seconds to complete and the frequency analysis took 4 seconds. Because BCl3 molecule is very simple and small, only 4 atoms present, it requires very short time to complete the job.
Analysis of cis- and trans- Mo(CO)4(PCl3)2
Introduction
The isomers of Mo(CO)4L2 where L=PPh3 show different IR abosrption bands in vibrational spectra. The number of CO vibrational bands is related to the geometry of the complex. Four CO absorption bands are expected from the cis-complexe and only one band is expected from the trans-compound. This exercise is to investigate the above observations using computational techniques. As Cl has similar electron contribution to the bond as Ph group, Ph group is replaced by Cl to reduce expense in computing resources. The geometry and energy will also be discussed.
Geometry Optimisation
The structures cis- and trans- Mo(CO)4(PCl3)2 were drawn in GuassView. The geometries were initially optimised using DFT-B3LYP/LanL2MB on SCAN. "opt=loose" was added into the "additional keywords" section to obtained a roughly optimised geometry.
# opt=loose b3lyp/lanl2mb geom=connectivity

cis_isomer_optimisation

0 1
 Mo                0        -0.02739726      0.34246575      0.00000000
etc...
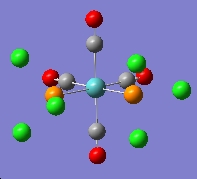
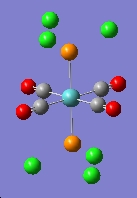
The output file was opened with Gaussview. It is noted that all the P-Cl bonds are gone. This is because the computed P-Cl bond are longer than the specific value set by Gaussiview. The bonds are actually present in the molecule, but the Gaussview does not show the bonds.
 |
 |
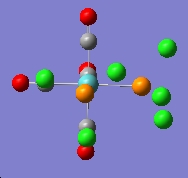
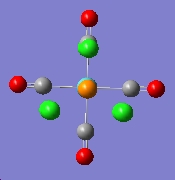
The more accurate geometry optimisation of the two isomers were then carried out. The geometries of were edited by rotating the PCl3 group before doing the optimisation on SCAN:
- for the cis isomer, one Cl points up parallel to the axial bond, and that one Cl of the other group points down
- for the trans isomer, one Cl of each group lies parallel to one Mo-C bond
The geometries was optimised using DFT-B3LYP/LanL2DZ on SCAN. "opt=loose" was replaced by int=ultrafine scf=conver=9 in the "additional keywords" section.
# opt rb3lyp/lanl2dz geom=connectivity int=ultrafine scf=conver=9

cis_isomer_optimisation2

0 1
 Mo
etc...
The convergence of the optimisations for both molecules are checked by viewing the log file:
For cis-isomer
         Item               Value     Threshold  Converged?
 Maximum Force            0.000011     0.000450     YES
 RMS     Force            0.000003     0.000300     YES
 Maximum Displacement     0.001445     0.001800     YES
 RMS     Displacement     0.000346     0.001200     YES
 Predicted change in Energy=-2.920010D-09
 Optimization completed.
For trans-isomer
         Item               Value     Threshold  Converged?
 Maximum Force            0.000004     0.000450     YES
 RMS     Force            0.000001     0.000300     YES
 Maximum Displacement     0.001181     0.001800     YES
 RMS     Displacement     0.000318     0.001200     YES
 Predicted change in Energy=-6.969317D-10
 Optimization completed.
 Optimization completed.
According to the log file, the forces and displacements for both of the isomer are converged. The geometries were optimised under the basis set chosen.
The finally optimised geometries were show below:
 |
 |
The log files can be found at D-space:[1][2]
Comparison of Energies
The summries of log files for both isomers were viewed. The cis-isomer shows an energy of -623.577 a.u. and the trans-isomer -623.576 a.u.. The difference in energy is very small, only 0.001 a.u.. The cis-isomer is slightly lower in energy and thus more stable . This matches the literature.[2]
Comparison of Bond lengths
The Mn-P and Mn-C bond lenghts for both isomers were viewed and displaced in the table below:
| Table 1.2 - Comparison of bond of the two isomers | ||
|---|---|---|
| cis- Mn(CO)4(PCl3)2 | trans- Mo(CO)4(PCl3)2 | |
| Mn-P bond / Å | 2.51 | 2.44 |
| Mn-C bond / Å | 2.06,2.01 | 2.06 |
As there are two different environments for the carbon atoms in cis-isomer, two different bond lengths are observed. The Mn-C bond cis to both PCl3 groups have a longer bond due to the stronger repulsion from the relative bulky PCl3 groups. The difference in Mn-P bond lengths can be explained using the same reason. The two bulky PCl3 groups cis to each other have stronger repulsion and hence the cis-isomer has longer Mn-P bond.
Frequency Analysis
The vibrational frequencies were calculated based on the optimised geometries. The input files were created with frequency being selcted as job type and int=ultrafine scf=conver=9 retained in the "additional keywords" section.
# freq rb3lyp/lanl2dz geom=connectivity int=ultrafine scf=conver=9

cis_isomer_freq

0 1
 Mo
etc...
The log files can be found at D-space:[3][4] All the frequencies of the vibrations for both isomers are positive, which further confirms that the optimisation is successful.
IR spectra
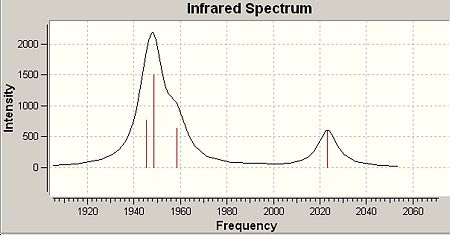
The IR spectra of both cis- and trans- isomers of the Mo(CO)4(PCl3)2 complex were viewed and the CO region of the spectra were displaced below:
 |
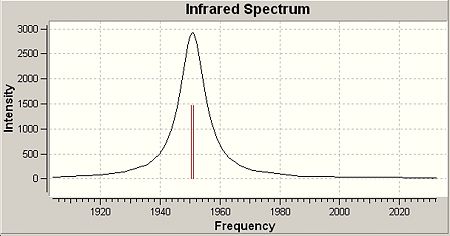 |
Four CO absorption bands were observed for cis-isomer(three bands have simlar wavelength and they overlap to give one broad peak)and only one band for trans-isomer as expected. This matches the literature (metioned in introduction section). The reason for this obesrvation can be explained:
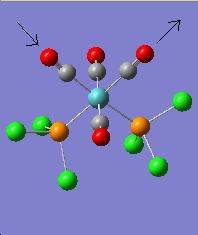
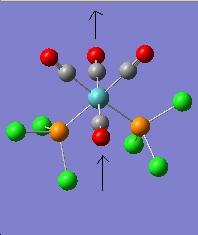
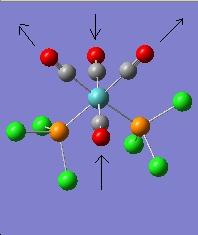
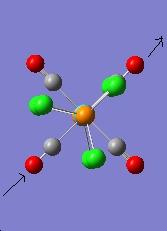
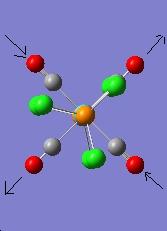
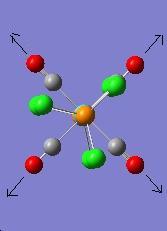
From the table, 4 vibration modes are seen for both isomers. For trans-isomer, two vibration modes have the same frequency and only one band will been shown in IR spectrum. The other two vibration modes have very high symmetry and the overall dipole moments do not change during vibration. Thus they are IR inactive and have very low intensity. As a result, only one single peak is seen in the IR spectrum. This is different for cis-isomer, which shows four different vibration modes, giving four peaks in the IR spectrum.
| Table 1.4 - CO vibration modes of the isomers | |||||
|---|---|---|---|---|---|
| Cis Vibration Number | Frequency / cm-1 | IR Intensity | Trans Vibration Number | Frequency / cm-1 | IR Intensity |
| 42 | 1945 | 763 | 42 | 1950 | 1475 |
| 43 | 1949 | 1498 | 43 | 1951 | 1467 |
| 44 | 1958 | 633 | 44 | 1977 | 1 |
| 45 | 2023 | 598 | 45 | 2031 | 4 |
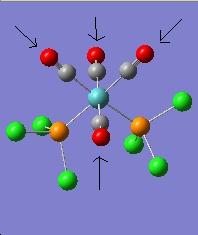
The vibration modes for both cis and trans isomers were shown below:
 |
 |
 |
 |
 |
 |
 |
 |
Mini-Project: Strcture of Borazine and Boron Phosphorus/Nitrogen Analogues of Borazine
Introduction
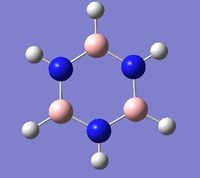
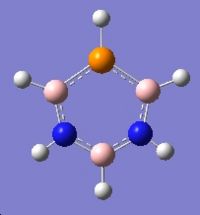
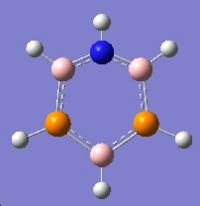
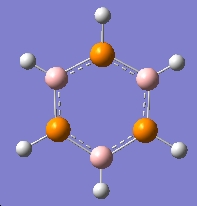
Borazine is an inorganic compound with the chemical formula (BH)3(NH)3. It is sometimes referred to as "inorganic benzene", as it is isostructural and isoelectronic with benzene.Borazine and its derivatives are potential precursors to boron nitride ceramics and to grow boron nitride thin film. Polyborazylene can be used as hydrogen storage medium in hydrogen fuel cell vehicle. [3] However,boron-phosphorus compounds have not been as thoroughly studied as boron-nitrogen compounds.
In this mini-project the structures, vibrational spectua and molecular orbitals borazine and boron phosphorus/nitrogen analogues of borazine will be studied using computational techniques.
 |
 |
 |
 |
Optimisation of Geometry
The planar borazine molecule was drawn in gaussview. The other three molecules can be obtained by replacing the nitrogen atoms in borazine by one, two or three phosphorus atoms respectively. All the molecules were intially optimised using DFT, B3LYP, 3-21G basis. As borazine and the analogues are small molecules, a much more accurate optimisation MP2, 6-311G(d,p) was then applied:
# opt rmp2/6-311g(d,p) geom=connectivity

Borazine_opt2

0 1
 H
 H                  1              B1
etc...
The log files for the optimisation of the four molecules can be found at D-space: [5] [6][7][8] All four molecules adopt planar geometry. The optimised geometries are shown in the introduction section. The bond lengthes of the bonds in these molecules after optimisation were concluded in the following table:
| Table 2.1 - Bond lengths for the four molecules (UNITS:Å) | |||||
|---|---|---|---|---|---|
| Bond type | Borazine | Borazine with 1 phosphorus | Borazine with 2 phosphorus | Borazine with 3 phosphorus | |
| B-H | 1.19 | 1.19* | 1.19* | 1.19 | |
| N-H | 1.01 | 1.01 | 1.01 | ||
| P-H | 1.39 | 1.39 | 1.39 | ||
| N-B | 1.43 | 1.43* | 1.43 | ||
| P-B | 1.84 | 1.83* | 1.83 | ||
The superscript * mark is used to indicate there are two slightly different bond lengths due to the different enviroments of the atoms. In both borazine and boron-phosphorus analogue of borazine, all the B-X (X = N or P) bond lengths are the same, 1.43Å for borazine and 1.84Å for boron-phosphorus compound. The 6 pi-electrons are delocalised in the whole ring systems, indicating the two molecules to be aromatic, which is consistant with experimental results. When one or two of the nitrogens in borazine were replaced by phosphorus atoms, the geometries of the molecules can no longer be regular hexagons as P-B bond (1.84Å )is longer than N-B bond (1.43Å ). It can also be noted that there is only very small changes to the N-B and N-H bond lengths after introducing phosphorus atoms to the borazine ring.
NBO Analysis
The four moleclues based on the optimised geometries were subjected to MO and NBO analysis by selecting energy as job type and full NBO under NBO tab, and typing "pop=full" in the additional keywords section . The same basis set was used for calculation as in optimisation.
# rmp2/6-311g(d,p) pop=(nbo,full) geom=connectivity

Borazine_pop

0 1
 H
 H                  1              B1
etc...
The log files can be found at D-space:[9][10][11][12]
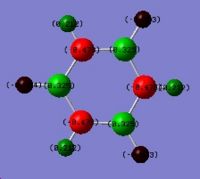
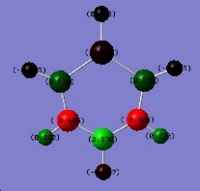
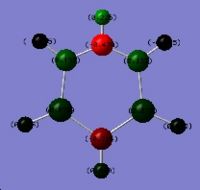
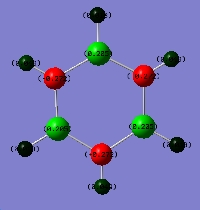
The atomic charge distribution was visualised (Results\Charges) and displayed (figure 2.4):
The charge numbers for borazine were discussed in detail and compared to benzene.
The charge numbers are 0.325 for boron atom (green) and -0.473 for nitrogen atoms (red). This indicates the boron atom is bearing partial positive charge and hydrogen atoms bearing a partial negative charge, which matches with the fact that nitrogen (3.04)is slightly more electronegative than boron (2.04). The effective positive charges on boron makes it more electrophilic and effective negative charges on nitrogen atoms make it more nucleophilic. This helps explain the nucleophilic reaction happened on boron and electrophilic reaction on nitrogen, which is not observed in benzene. In benzene, all the carbon atoms are equivalent and nucleophilc or electrophilic reactions can take places on the carbons equally.
MO Analysis
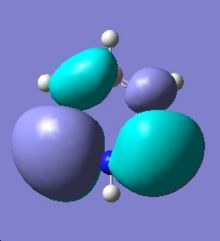
The .chk file obtained from MO and NBO analysis was opened. The molecular orbitals were viewed(Edit\MOs\Visualise). In this section, only the MOs of borazine were dicussed in detail and compared to the MOs of benzene. The molecular orbital diagrams (only pi orbitals were shown) for both borazine and benzene were constructed.
 |
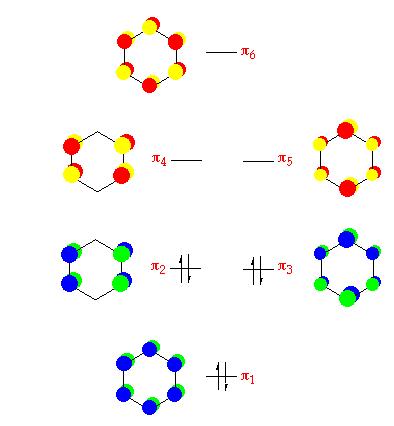 |
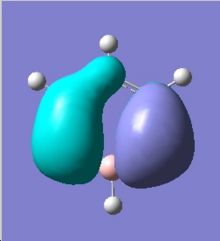
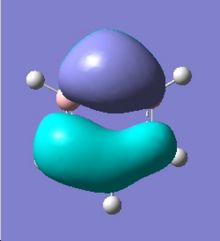
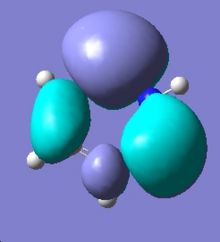
Comparing the two MO diagrams, it is easy to notice that they have very similar orbitals. The differences are due to the different atoms present in the ring (electronegativiy: N < C < B) and calculation errors. Looking into the energies of the orbitals of borazien, there are one set of degenerate pi bonding orbitals (E=-0.402 a.u.) and one set of degenerate pi anti-bonding orbitals (E=0.155 a.u.), which are also found in benzene. As borazine is isoelectronic to benzene, the occupation of MOs are very similar to benzene. As a result, the properties and reactions of borazine is very similar to benzene. The nucleophilicity of N and electrophilicity of B, which have already been discussed in the NMO analysis section, can also be rationalised by MO orbitals. The large lobs of HOMO orbitals lie mainly on the N, meaning the electrons are mainly on the N, so it is more likely to donate electrons (nucleophilic). The large lobs of LUMO orbitals lie mainly on the B, meaning the electrons will be mainly added to B (electrophilic).
 |
 |
 |
 |
Vibrational Analysis
The optimised geometry of borazine was used to create a new input file for vibrational calculation. For the input file, frequency was selected as job type and typing "pop=(full,nbo)" was added to the additional keywords section . The same basis set was used for calculation as in optimisation:
# freq rmp2/6-311g(d,p) geom=connectivity pop=(full,nbo)

Borazine_freq

0 1
 H
The IR spectrum of borazine was shown below:
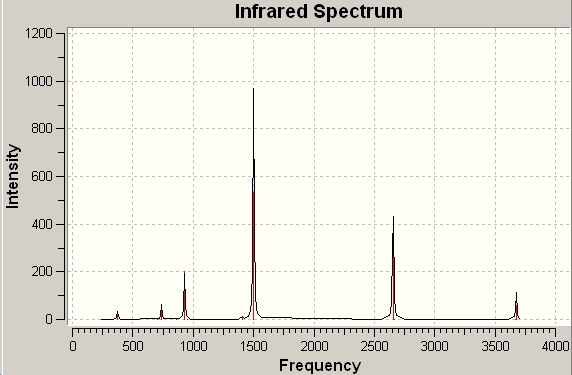 |
The vibrational modes of borazine were viewed and the bands with high intensities were displaced and compared to literature [4] in the table below:
| Table 2.1 - Comparison of vibrational modes of borazine from calculation and experiment | |||||
|---|---|---|---|---|---|
| Type of vibration | Calculated / cm-1 | Literature / cm-1 | |||
| N-H stretching | 3676 | 3440 | |||
| B-H stretching | 2655 | 2505 | |||
| B-N stretching | 1500 | 1430 | |||
The frequencies of N-H, B-H and B-N stretching calculated using computational techniques are slightly larger than the literature values. The computation calculation gives a quite good prediction for vibrations. This technique would be very useful when dealing with very toxic or short-lived compounds.
The log files can be found at D-space:[13]
References
- ↑ N. N. Greenwood, A. Earnshaw Chemistry of the Elements (2nd ed.), '1997'. ISBN 0-7506-3365-4
- ↑ A.D. Allen and P.F. Barrett. Canadian Journal of Chemistry,46:1649 1653, '1968'.
- ↑ B. L. Davis,Angewandte Chemie International Edition, 2009, 48, 2832 - 2838. doi:10.1002/anie.200900680.
- ↑ K. Moon, D. Min, and D. Kim, Journal of Ind.& Eng. Chemistry, '1997'.

