Rep:Module2:aiwobiezou
Preliminary Questions
Structural Analysis of BCl3
of BCl3
The D3h ground state structure of BCl3 was optimised using the B3YLP method the 3-21G basis set. The calculation took 18.0 seconds. The prodecure followed for optimisation can be found by clicking on the link.
Optimisation terminates once the gradient of the energy of the molecule reaches (almost) zero, however both a maximum (the transition state of a dissociation energy barrier) and minimum (the ground state) have a gradient of zero. Frequency analysis is important because it is the second derivative of the potential energy surface and hence gives the curvature of the function. If the calculated frequencies are positive we have a minimum and if the frequencies are negative we have a maximum. We can use this information to see whether the molecule has been optimised completely. Frequency analysis also provides the IR and Raman modes.
The same method and basis set must be used for both optimisation and frequency calculations becauase the same accuracy in the description of the molecular orbitals is required. If not it can lead to inaccurate results - i.e. when computing the molecular orbitals using different basis sets would lead to "excited" electron density.
In some structure GaussView does not draw in the bonds where we expect, however this does not mean there is no bond. GaussView draws bonds based on a distance critera so if the distance exceeds some pre-defined value the bond will not be present. Nevertheless this is not important because bonds are a structural convenience. What is important is the prescence of electrons and its intereactions with the the two nuclei.
A bond can be defined as an interaction between the nuclei and electrons of two atoms. Having opposite charges the nuclei and electrons attract each other via electromagnetic force. Bonds are often thought of as electrons between two nuclei because it is the most stable configuration and hence where electrons spend most of their time.
Output Files for b3lyp/3-21g BCl3 optimisation
Output Files for b3lyp/3-21g BCl3 frequency
| B-Cl Bond Distance
/Angstroms |
Cl-B-Cl Angle
/Degrees | |
|---|---|---|
| Calculated | 1.78 | 120 |
| Literature[1] | 1.75 | 120 |
The calculated Cl-B-Cl angle is what is expected. BCl3 is a simple, trigonal planar molecule where 120 degrees Cl-B-Cl angles would allow the three chlorine atoms to be furthest apart from each other. The calculated B-Cl bond distance, on the other hand, differs from the literature value. This is proabably due to the low accuracy of the basis set used combined with its error(s).
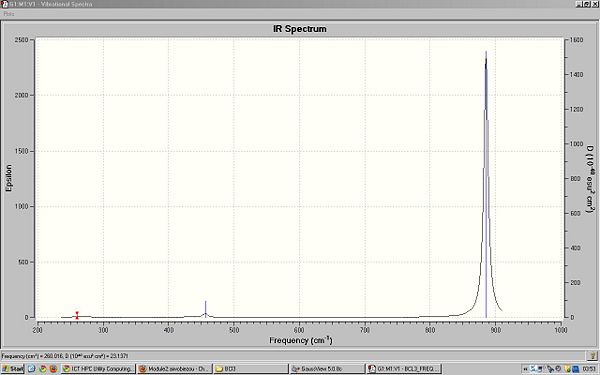
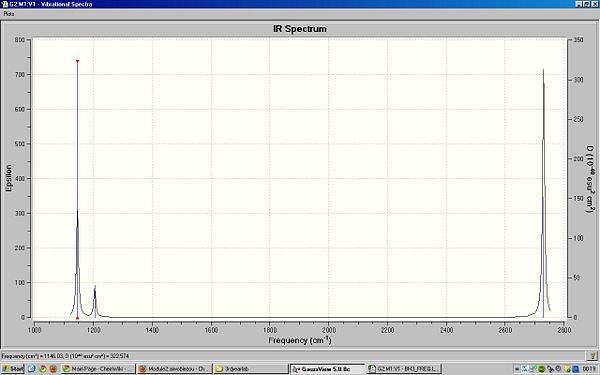
6 frequencies have been calculated but only 3 peaks can be seen in the spectrum because there are 2 sets of frequencies are degenerate and 1 frequency has zero intensity. The ground state structure has D3h symmetry.
MO Analysis of BH3
BH3 was optimised and the MOs were calculated using the B3YLP method the 3-21G basis set. The prodecure followed for optimisationand molecular orbital calculation can be found by clicking on the link.
Output Files for b3lyp/3-21g BH3 optimisation
Output Files for b3lyp/3-21g BH3 molecular orbitals
The prodecure followed for molecular orbital analysis can be found by clicking on the link.

Comparing the MOs in the above MO diagram we can see that there are no significant differences between the real and LCAO MO's. The quantitative or computed MOs are assumed to be very accurate, at least for the BH3 molecule using. This shows that qualitative MO theory is just as accurate and is very useful as for predicting the MOs of molecules to a relatively good degree of accuracy.
Transition Metal Complex
Optimisation
The ground state structures of cis and trans Mo(CO)4(PCl3)2 were optimised using the B3YLP method firstly using the LANL2MB basis set, and then again with the LANL2DZ basis set. The prodecure followed for optimisation can be found by clicking on the link.
Output Files for b3lyp/lanl2mb Cis-Mo(CO)4(PCl3)2 optimisation
Output Files for b3lyp/lanl2mb Trans-Mo(CO)4(PCl3)2 optimisation
Below are the Jmol of the optimised geometries.
of Cis-Mo(CO)4(PCl3)2
of Trans-Mo(CO)4(PCl3)2
Output Files for b3lyp/lanl2dz Cis-Mo(CO)4(PCl3)2 optimisation
Output Files for b3lyp/lanl2dz Trans-Mo(CO)4(PCl3)2 optimisation
Frequency Analysis
Output Files for b3lyp/lanl2mb Cis-Mo(CO)4(PCl3)2 frequency
Output Files for b3lyp/lanl2mb Trans-Mo(CO)4(PCl3)2 freqeuncy
The prodecure followed for vibrational analysis can be found by clicking on the link.
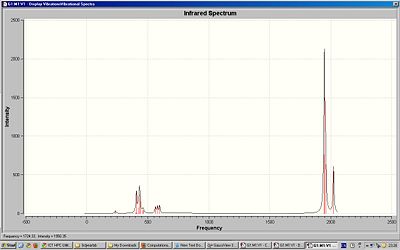
All of the frequencies were found to be positive showing that the optimisation was sucessfull and a minimum was otained.
 |
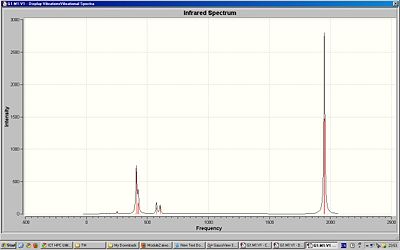 |
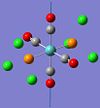
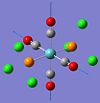
Although there are 4 stretching motions there are 2 visible peaks in the spectrum of the cis-isomer because 3 of the stretching motions have similar frequency. The trans-isomer only has 1 visible peak in the spectrum because 2 of the stretching motions are degenerate and 2 have almost zero intensity. The computed IR spectra show vibrations at very low energies/frequencies. At room temperature, where the energy is higher, we would expect there to be more vibrations present. Degeneracy occurs in molecules with high symmetry. The trans isomer has high symmetry and so using this information we can determine which of isomers are cis or trans.
Analysis of the energies of the isomers show that the cis isomer is lower in energy (more stable) than the trans imsomer by a small difference of 1kJ. This shows that the cis isomer should be the preferred isomer. This can be rationalised by stability of the generated dipole when the two PCl3 groups are cis.. However the literature states that the trans isomer is the most stable. This can be rationalised by the increased stability when there is less steric clash when in the trans conformation. Steric clash is the dominating factor and so hence the trans-isomer is the most stable. The most significant error for the calculation is probabaly the use of Cl atoms instead of phenyl rings. Although Cl atoms have a similar electronic contribution to the bonding they are much less bulky than phenyl rings and hence steric effects would be absent relative to phenyl rings. As with all calculations, using a better basis set would lead to more accurate results.[2][3][4]
The computed IR spectra show vibrations at very low energies/frequencies. At room temperature, where the energy is higher, we would expect there to be more vibrations present.
Mini Project
Introduction[5]
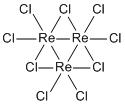
In this project I will study the ReCl3 molecule and its stable and preferred Re3Cl9 cluster. This project will involve optimisation of the molecules followed by vibrational analysis to confirm optimisation, and molecular orbital/natural bond orbital analysis. The energy of the products will also be looked at to determine whether the molecule or the cluster is more stable.
I will also study TcCl3 and its Tc3Cl9 cluster and compare this with the Re cluster.
Finally I will study ReBr3 and its Re3Br9 cluster.
To the right are the optimised structures of ReCl3 and the Re3Cl9 cluster. The other molecules have the same general structure but with substituted atoms.
 |
 |
 |
Optimisation
ReCl3, Re3Cl9 and the derivatives were optimised using the B3YLP method the LANL2DZ basis set. The general prodecure followed for optimisation can be found by clicking on the link. The clusters required 3 optimisations via SCAN before the energy converged. The output files of the final optimised structures are found below:
Output Files for b3lyp/lanl2dz ReCl3 optimisation
Output Files for b3lyp/lanl2dz Re3Cl9 optimisation
The energy of ReCl3 is -123.9 Hartrees, and the energy of Re3Cl9 is -372.1 Hatrees. The cluster has a lower energy than 3 individual molecules of ReCl3 and hence the cluster is preferred and formed.
Output Files for b3lyp/lanl2dz ReBr3 optimisation
Output Files for b3lyp/lanl2dz Re3Br9 optimisation
In comparison the energy of ReBr3 is -118.6 Hartrees, and the energy of Re3Br9 is -356.1 Hatrees. In this case the cluster has a higher energy than 3 individual molecules of ReBr3 and hence the cluster is not formed.
Output Files for b3lyp/lanl2dz TcCl3 optimisation
Output Files for b3lyp/3-21g Tc3Cl9 optimisation
Similar the energy of TcCl3 is -124.9 Hartrees, and the energy of Tc3Cl9 is -375.0 Hatrees. Again the cluster has a higher energy than 3 individual molecules of TcCl3 and hence the cluster is not formed.
Vibrational Analysis
Note: The following bond lengths are given in Angstroms, Å, and the stretching frequencies are given in wavenumbers, cm-1.
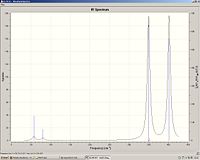
The log file of optimisation only told us that the energy has convereged to zero gradient. Vibrational analysis allows us to determine whether obtimisation to MINIMUM energy has been achieved. Here all the calculated frequencies are positive which shows all optimisations have suceeeded.
Output Files for b3lyp/lanl2dz ReCl3 frequency
Output Files for b3lyp/lanl2dz Re3Cl9 frequency
 |
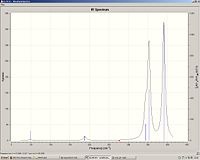 |
ReCl3
Re-Cl bond length: 2.25
Re-Cl stretch: 349 and 402.
Re3Cl9
Re-Cl bond length: 2.32
Re-Re bond length: 2.42
Re-Cl stretch: 344 (degenerate), 353 (degenerate) and 390
We can see that the Re-Cl bond length has increased in the cluster and hence the stretching frequency has decreased.
Output Files for b3lyp/lanl2dz ReBr3 frequency
Output Files for b3lyp/lanl2dz Re3Br9 frequency
 |
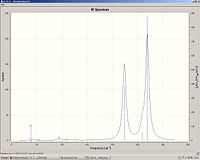 |
ReBr3
Re-Br bond length: 2.43
Re-Br stretch: 241 and 279.
Re3Br9
Re-Br bond length: 2.47
Re-Re bond length: 2.44
Re-Br stretch: 224 (degenerate), 259 (degenerate) and 269
We can see that the Re-Br bond length is greater than the Re-Cl as expected due to Br having more electrons and being larger. Again the Re-Br bond length increases in the cluster however to a lesser extent compared with Re-Cl. The lower stretching frequencies, again, correspond to the increase in bond lengths.
Output Files for b3lyp/lanl2dz TcCl3 frequency
Output Files for b3lyp/3-21g Tc3Cl9 frequency
 |
 |
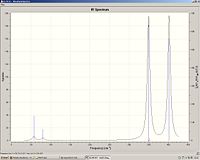
TcCl3
Tc-Cl bond length: 2.28
Tc-Cl stretch: 332, 390 and 425.
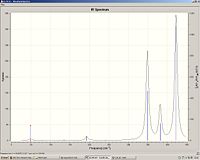
Tc3Cl9
Tc-Cl bond length: 2.31
Tc-Tc bond length: 2.41
Tc-Cl stretch: 348 (degenerate), 381 (degenerate) and 422
We can see that the Tc-Cl bond length is lower than the Re-Cl as Tc is smaller than Re. It can also be rationalised by molecular orbital overlap; Tc and Cl have similar sized orbitals compared with Re-Cl. Again the Tc-Cl bond length increases in the cluster and to a much lesser extent compared with Re-Cl and Re-Br. Comparison of the stretching frequencies however show no correlation between the bond length and stretching frequencies. I can only suggest that this may be due to inaccuracy of the calculated frequencies or maybe the overall structure of the cluster will have an effect on the stretching frequency eg Tc-Tc bond length.
The prescence of degenerate stretching frequencies tell us that the structure of the cluster must be symmetrical.
Molecular Orbital Analysis
Output Files for b3lyp/lanl2dz ReCl3 MO
Output Files for b3lyp/lanl2dz Re3Cl9 MO
Output Files for b3lyp/lanl2dz ReBr3 mo
Output Files for b3lyp/lanl2dz Re3Br9 MO
Output Files for b3lyp/lanl2dz TcCl3 MO
Output Files for b3lyp/3-21g Tc3Cl9 MO
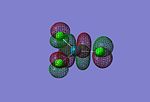
| Molecule | HOMO | LUMO | Cluster | HOMO | LUMO |
|---|---|---|---|---|---|
| ReCl3 | 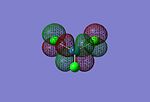 |
 |
Re3Cl9 | 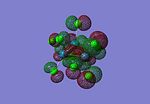 |

|
| ReBr3 | Same as ReCl3 | Same as ReCl3 | Re3Br9 | 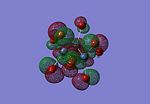 |

|
| ReBr3 | Same as ReCl3 | Same as ReCl3 | Re3Br9 | Same as Re3Cl9 | Same as Re3Cl9 |
| Molecule | Cluster | ||
|---|---|---|---|
| ReCl3 | 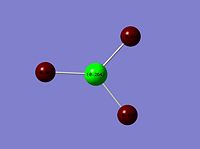 |
Re3Cl9 | 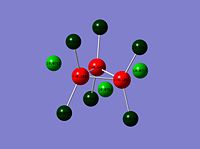
|
| ReBr3 | 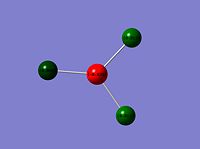 |
Re3Br9 | 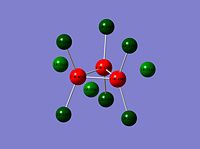
|
| TcCl3 | 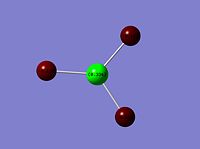 |
Tc3Cl9 | 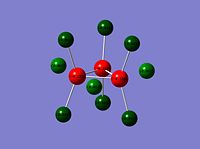
|
NBO analysis shows that there is more electron density present on the Re atoms of Re3Br9 relative to those of Re3Cl9. At the same time the Br atoms are more positively charged than the Cl atoms. This is strongly non prefered in both molecules.
Conclusion
The Re3Cl9 cluster is more stable than individual ReCl3 molecules and hence exist. Re3Br9 and Tc3Br9 clusters is less stable than individual molecules and hence do no exist.
All optimisations and calculations were sucessful (frequencies were positive) however some molecules required a second or third optimisation before there was convergence. To improve speed and reliability of calculations, the MM2 optimisation method in ChemBio3D was used, and could be used in future, to optimise the geometry of the molecules before they are optimised with Gaussian. In addition it is much easier to draw and edit molecules in Biochem3D than in GaussView.
References
- ↑ F. Bessac, G. Frenking, Inorg. Chem. 2003, 42, 7990-7994. DOI: 10.1021/ic034141o
- ↑ F. A. Cotton, D. J. Darensbourg, S.. Klein, B. W. S. Kolthammer, Inorg. Chem., 1982, 21 (1), 294–299. DOI:10.1021/ic00131a055
- ↑ L. Hirsivaara, M. Haukka, J. Pursiainen, Inorg. Chem. Comm. 3 (2000),508–510 DOI:10.1016/S1387-7003(00)00131-3
- ↑ D. W. Bennett, T. A. Siddiquee, D.T. Haworth, S.E. Kabir, F. K. Camellia, Journal of Chemical Crystallography, Vol. 34, No. 6, June 2004 ( 2004), 353-359 DOI:http://dx.doi.org/10.1023/B:JOCC.0000028667.12964.28
- ↑ Andrzej Kochel, Inorganic Chemistry Communications, Volume 10, Issue 12, December 2007, 1440-1443 DOI: 10.1016/j.inoche.2007.09.007


