Rep:Module2:JYX08
Part I: Small Molecule Optimisation
BH3
Optimisation
BH3 is optimised using Gaussian, this was done using the B3LYP method with basis set of 3-21G. This is a rather "simple" basis set. It works well when it is applied to small molecules, when it is applied to large or complicated molecules will result in an inaccurate calculation. However, for this calculation for BH3, it is enough to obtain a good approximation. The molecule was drawn in Gaussview, and each BH bond was adjusted to 1.5Å first in prior of taking the optimisation to set ourselves a good starting point.
A summary of the optimisation is shown in the table below:
| File Type | .log |
| Calculation type | FOPT |
| Calculation method | RB3LYP |
| Basis set | 3-21G |
| Charge | 0 |
| Spin | singlet |
| E(RB+HF-LYP) | -26.4622 a.u (-69.475 kJ/mol) |
| RMS Gradient Norm | 0.00 a.u. |
| Dipole Moment | 0.00 Debye |
| Point Group | D3h |
| Job cpu time | 10.0 sec |
| B-H Bond length | 1.19Å |
| HBH Bond angle | 120.0° |
The log file can be viewed here: https://www.ch.ic.ac.uk/wiki/images/4/46/BH3_OPTJYX.LOG
As we can see here, the optimised bond length is 1.19Å while the bond angle is 120.0°, which agrees well with the literature[1] experimental observations, which has proven that BH3 adopts a trigonal planar structure of bond length 1.21Å and bond angle 120.0°.
The RMS and Energy curves can be viewed after the run. The graphs represent the change in energy and RMS gradient against the calculation step. As the RMS gradient converges to 0, means that the total energy is minimised and the geometry of the molecule is therefore fully optimised.

We can see from the graph above, that it took 5 steps of calculation for the geometry of BH3 to be fully optimised, and the gradient has successfully converged to 0.
Molecular Orbital Analysis
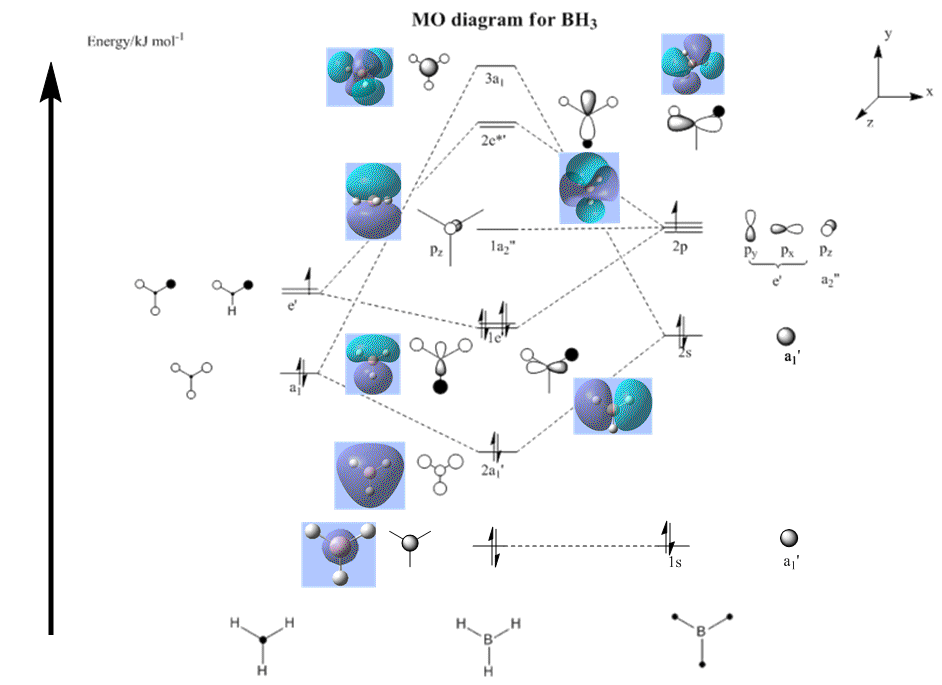
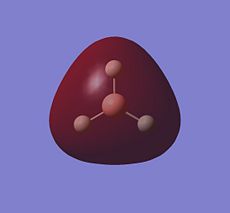
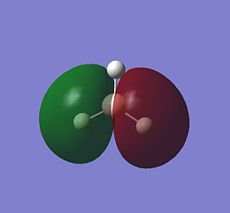
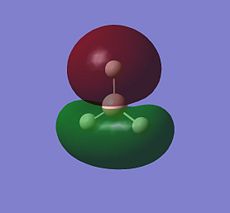
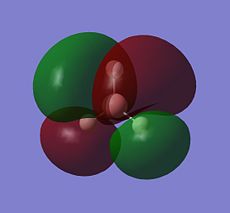
The molecular orbital of BH3 was generated computationally. The result of this was then compared with the predicted molecular orbitals using linear combination of atomic orbitals (LCAO) method, and the two were found matches quite well. This indicates that the qualitative MO theory is quite accurate in terms of determining the shape of the MOs. However the downside is that it cannot predict the energies for the MOs quantitatively as the computational method.
The comparison of the MOs are shown below:
The job was published in D-space: http://hdl.handle.net/10042/to-6885
NBO Analysis
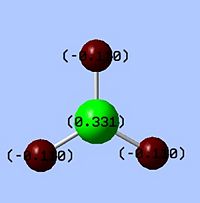 |
The Natural Bond Orbital (NBO) analysis investigates the charge distribution in a molecule. From the log file, the overall charge is zero as we expect. All three of the H atoms have full s orbital contribution, where as for B atom, it has 33% contribution from the s, and 66% from the p orbitals. The colour appeared on the molecule corresponds to the charge distribution in this molecule. Bright green indicates highly positive charge and bright red highly negative charge. As expected the boron atom which is Lewis deficient is highly positively charged.
Vibrational Analysis
On the optimised BH3 molecule, a frequency analysis was performed:
Log file for this calculation can be viewed here: https://wiki.ch.ic.ac.uk/wiki/images/3/33/JYX_BH3_FREQ.LOG
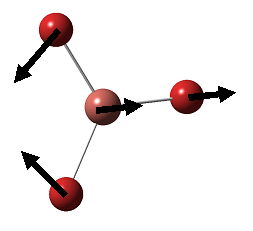
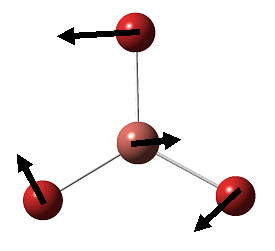
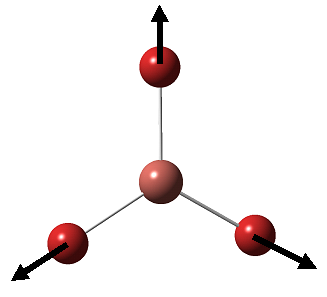
| Mode | Vibration | Description | Freq/cm-1 | Intensity | Symmetry (D3h) | Literature Freq /cm-1[2] |
| 1 | 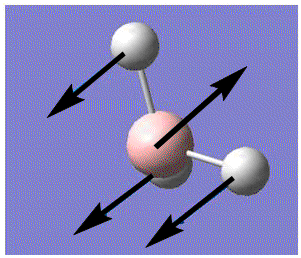 |
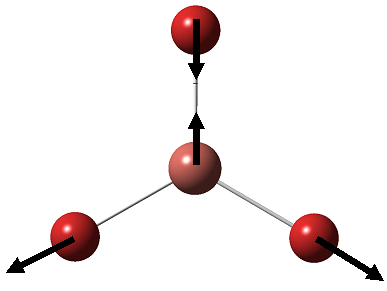
Out of plane wagging: All H move in direction of arrow while B moves in the opposite direction. | 1145.7 | 92.7 | A2" | 1159 |
| 2 | 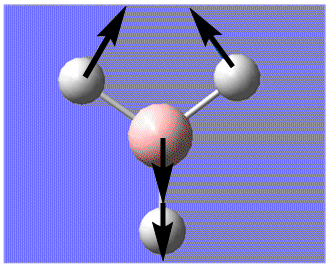 |
In-plane Scissoring: 2 H move in the scissors-like fashion while B and the third H moves downwards as one unit, away from the 2H's. | 1205 | 12.4 | E' | 1204.7 |
| 3 |  |
In-plane Rocking: 2H and B rock concertedly in plane as one unit, while the third H swings in opposite direction with larger amplitude. | 1205 | 12.4 | E' | 1204.7 |
| 4 |  |
Symmetric Stretching: All three H move away from B within the BH3 plane, while the central B remains still. | 2592.8 | 0 | A1' | NA |
| 5 |  |
Asymmetric stretching: two H moves, one away from the B center, and the other one comes towards B wagging in the plane of the molecule, while the third H remains still. | 2731.3 | 103.8 | E' | 2616 |
| 6 | 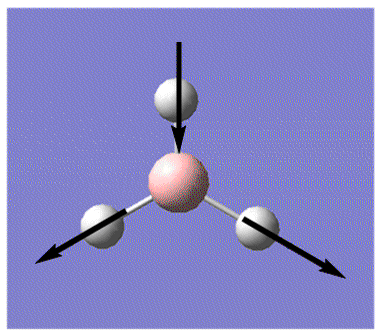 |
Asymmetric stretching: two H move away (or toward) B in concerted motion, while third H moves towards (or in -- opposite to the two H), all in the plane of screen. B moves towards and away from this third H. | 2731.3 | 103.8 | E' | 2616 |
After the vibrational frequency analysis was done, a predicted vibrational spectrum can be viewed.
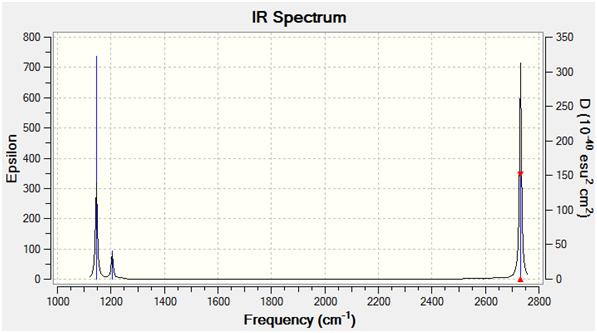
From the vibrational frequency analysis, 6 vibrational modes were identified. However from the graph above, only 5 peaks can be oberved. This is due to the vibrational spectrum is highly dependent on the symmetry hence the dipole moments of the vibration modes. Therefore for symmetric vibrations, i.e. for vibration 4, due to the overall dipole moment is cancelled out by individual stretches, hence it does not appear on the IR spectrum.
TlBr3
Optimisation
The structure of TlBr3 was optimised again by Gaussian, the method we employed this time was slightly different from the one we used to carry out the optimisation for BH3. We have used a higher level of basis set (LanL2DZ) due to the heavier atoms being present.
Log file for the optimisation can be viewed here: https://wiki.ch.ic.ac.uk/wiki/images/a/ab/Jyx_TLBR3_OPTIMISATION.LOG
| File Type | .log |
| Calculation type | FOPT |
| Calculation method | RB3LYP |
| Basis set | LANL2DZ |
| Charge | 0 |
| Spin | single |
| E(RB+HF-LYP) | - 91.2181 a.u (-239.264 kJ/mol) |
| RMS Gradient Norm | 0.00 a.u. |
| Dipole Moment | 0.00 Debye |
| Point Group | D3h |
| Job cpu time | 34.0 sec |
| Tl-Br bond length | 2.58Å |
| Br-Tl-Br angle | 120.0° |
Bond length reported in literature[3] is 2.52Å and bond angle is 120.0Å, which agrees well with calculated values obtained, the bond angle in our model also obeys the ideal geometry of a trigonal planar compound. Slight deviations could be accounted for, that the simulated conditions done by Gaussian are different from the conditions of measurement done experimentally.

From the graph above, we can see that the gradient has successfully converged to 0, and the total energy is also minimised, which corresponds to the most stable geometry of the molecule.
Vibrational Analysis
The log file can be viewed here: https://wiki.ch.ic.ac.uk/wiki/images/e/e3/Jyx_TLBR3_FREQUENCY.LOG Vibration frequency analysis was done using the same method and basis set as we used to optimise the structure. This is essential as to ensure the results maintaining accuracy and consistency.
- Low frequencies reported in the log file for this calculations are:
-3.4226 -0.0026 -0.0004 0.0015 3.9361 3.9361 - Real low frequencies actually start at:
46.4288 46.4291 52.1449
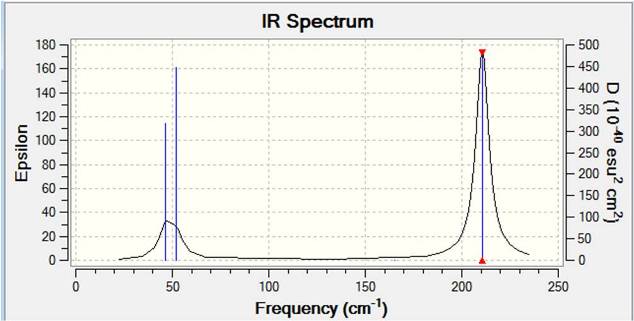
For symmetrical molecules, 3N-6 vibrational modes should be present, where N is the number of atoms. For non-symmetrical molecule, 3N-5 vibrational modes should be seen. Therefore, for both BH3 and TlBr3 symmetrical compounds, 6 vibrational modes should be observed, corresponding to Gaussian calculated results. However from the spectrum, only 3 peaks can be observed. This is due to two of the peaks corresponds to degenerate vibration motions, and there is also a symmetric vibration mode which will not be observed from the spectrum.
Why Do a Frequency Analysis?
In the optimisation step, the derivative of the total energy curve has reached zero. However this does not indicate whether it is a maximum or a minimum turning point. The frequency analysis is essentially the second derivative of the curve. It is important that all values we obtained need to be positive in order to confirm that it is a minimum turning point. Any negative values would indicate maximum turning point being present, and thus optimisation has failed.
Missing Bonds in Guassview
Some molecules after being optimised by Gaussian, some of the bonds have disappeared. This doesn't not mean that there is no bonds between the atoms, it simply means that the bond length has exceeded the limit that was originally set for Gaussview. Thus Gaussview does not recognise this as a bonding interaction, hence does not draw the bonds in, but there are certainly bonding interactions present.
Definition of a Bond
A bond would be regard as a force of attraction between two or more atoms which stabilise the energy of the system. Sufficient overlap of orbitals of at least two atoms would result in formation of a bond. Bonding can also be described as a result of electromagnetic interaction between positively charged nuclei and negatively charged shared electrons (covalent bond), electrostatic interaction due to large difference in electronegativity(ionic bond).
Part II: An Organometallic Complex
Mo(CO)4(PCl3)2 Cis-Trans Isomerism
Optimisation
The cis and trans isomers of Mo(CO)4(PCl3)2 are optimised by the method B3LYP in Gaussian. They were pre-optimised using the pseudo potential/basis set of LanL2MB to get close to the structure with the minimal energy (opt=loose), and subsequently optimised a second time while manually rotated the bonds to force the molecule in a geometry close to the low energy conformation, with the pseudo potential being LanL2DZ. Pseudo potentials are applied here to provide a higher level of optimisation for these heavier atoms. LanL2DZ is an even higher level optimisation than LanL2MB, more suited to this large complex with heavy atoms like Mo.
| (1st optimisation) | ||
| cis-isomer | trans-isomer | |
| Jmol | ||
| D-space link | DOI:10042/to-6894 | DOI:10042/to-6893 |
| File Type | .fch | .fch |
| Calculation type | FOPT | FOPT |
| Calculation method | RB3LYP | RB3LYP |
| Basis set | LANL2MB | LANL2MB |
| Charge | 0 | 0 |
| Spin | singlet | singlet |
| E(RB+HF-LYP) | - 617.5252 au (-1637.923 kJ/mol) | - 617.5221 au (-1637.915 kJ/mol) |
| Dipole Moment | 8.42 Debye | 0.00 Debye |
| Point Group | C1 | C1 |
| Job cpu time | 10min 56sec | 03min 07sec |
| (2nd optimisation) | ||
| Jmol | ||
| D-space link | DOI:10042/to-6895 | DOI:10042/to-6896 |
| File Type | .fch | .fch |
| Calculation type | FOPT | FOPT |
| Calculation method | RB3LYP | RB3LYP |
| Basis set | LANL2DZ | LANL2DZ |
| Charge | 0 | 0 |
| Spin | singlet | singlet |
| E(RB+HF-LYP) | -623.5771 a.u. (-1653.976 kJ/mol) | -623.5760 a.u. (-1653.973 kJ/mol) |
| Dipole Moment | 1.31 Debye | 0.31 Debye |
| Point Group | C1 | C1 |
| Job cpu time | 18min 38sec | 11min 38sec |
Looking solely at the second optimisation, the energy of the cis isomer is ~3Jmol-1 higher than for the trans isomer, which means that the trans isomer is a thermodynamically favoured structure in relative to the cis isomer. This effect can be rationalised in terms of the steric effects. The PCl3 group can be considered relatively bulky and spatially demanding. The molecule will be in its low energy state when two groups are kept as far apart as possible in a trans geometry. This theory was in fact backed up by the experimental observation reported in a literature paper [4]. However the trans-isomer is no longer perfectly symmetric after the second optimisation. The bond angle between the two trans P groups has shifted from 180° to 177.4°, which the molecule results in having a very slight dipole moment of 0.31 Debye. The Mo-C bond has a distance of 2.06 Å and Mo-P with a distance of 2.44 Angstroms(corresponding well with 2.5Å in literature [5]). In the case of cis-isomer, Mo-C bond length is about 2.06Å and Mo-P is ~2.51Å .
Table.6 Geometry data of trans-isomer compared to literature values
| lit.[6] trans [Cr(CO)4(PPh3)2] | trans [Mo(CO)4(PCl3)2] | |
| mean Mo-P bond length / Å | 2.36 | 2.44 |
| mean Mo-C bond length / Å | 1.87 | 2.06 |
| P-Mo-P bond angle/ ° | 176.7 | 177.4 |
| P-Mo-C bond angle / ° | 89.5 | 90(averaged) |
Table.7 Geometry data of cis-isomer compared to literature value
| lit.[7] cis [Mo(CO)4(PPh3)2] | cis [Mo(CO)4(PCl3)2] | |
| mean P-Mo bond length / Å | 2.51 | 2.48 |
| mean Mo-C bond length / Å | 2.03 | 2.03 |
| P-Mo-P bond angle / ° | 94.2 | 95.6 |
| P-Mo-C (trans to P) bond angle / ° | 176.1 | 174.4 |
| P-Mo-C (cis to P) bond angle/ ° | 90.1 | 87.3 |
From the table above, the calculated data values agrees well with the literature.
Frequency/IR analysis
Trans frequency output file on D-space: |DOI:10042/to-6942 Cis frequency output on D-space: |DOI:10042/to-6941
All the low frequencies are positive which indicates that both molecule are at the energy minima, and the geometry is successfully optimised.
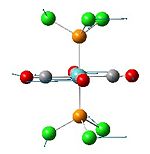
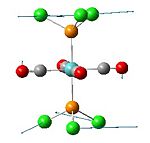
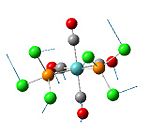
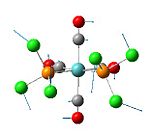
The low frequencies vibrations of both Mo(CO)4(PCl3)2 isomers are shown below:
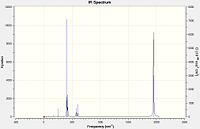
The carbonyl stretch vibrations are shifted about 40-50 cm-1, this is because the triphophine groups used in the experimental measurement are now replaced by PCl3 for this calculation. Due to symmetry of the vibrations for the trans-isomer, there are 2 IR inactive modes which does not appear on the spectrum.
| Isomer | Calculated Frequency / cm-1 | Calculated Intensity | Experimental Frequency | Point Group (C2v Symmetry)[8] |
|---|---|---|---|---|
| cis | 1945.3 | 762.7 | 1986 | B2 |
| cis | 1948.7 | 1948.5 | 1994 | B1 |
| cis | 1958.3 | 633.0 | 2004 | A1 |
| cis | 2023.3 | 597.5 | 2072 | A1 |
| trans | 1950.5 | 1475.4 | 1896 | Eu |
| trans | 1951.1 | 1466.7 | 1896 | Eu |
| trans | 1977.4 | 0.63 | - | B1g |
| trans | 2031.1 | 3.8 | - | A1g |
 |
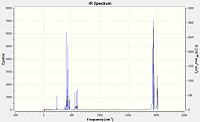 |
All four CO vibrations were observed in the spectrum for the cis-isomer, while only one peak was obersved for the trans-isomer due to the degenerate vibration states, thus only one CO stretch peak was seen for the IR spectrum of the trans-isomer.
Part III: Mini-Project
NH3
Optimisation
| File Type | .log |
| Calculation type | FOPT |
| Calculation method | RB3LYP |
| Basis set | 6-31G |
| Charge | 0 |
| Spin | singlet |
| E(RB+HF-LYP) | -56.531 a.u (-43.402 kJ/mol) |
| RMS Gradient Norm | 0.00 a.u. |
| Dipole Moment | 0.00 Debye |
| Point Group | C3 |
| Job cpu time | 12.0 sec |
| B-H Bond length | 1.006Å |
| HBH Bond angle | 116.251° |
Log file for this calculation can be viewed here: https://wiki.ch.ic.ac.uk/wiki/images/f/fa/JyxNH3_OPT.LOG

MO Analysis
Log file for this calculation can be viewed here:DOI:10042/to-7047
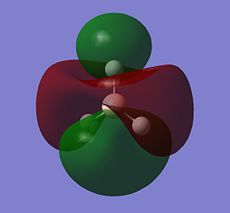
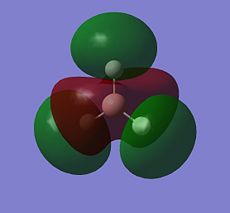
| Orbital | MO of NH3 | MO of BH3 |
| A1' | 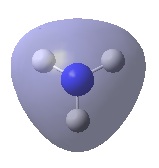 |
|
| E' | 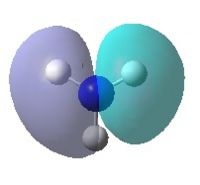 |
|
| E' | 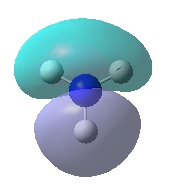 |
|
| A2" |  |

|
| A1' | 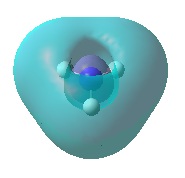 |
|
| E' | 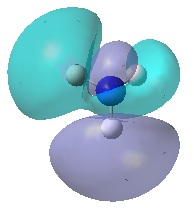 |
|
| E' | 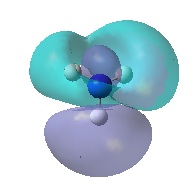 |
|
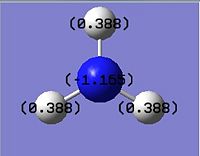 |
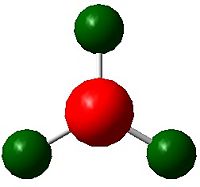 |
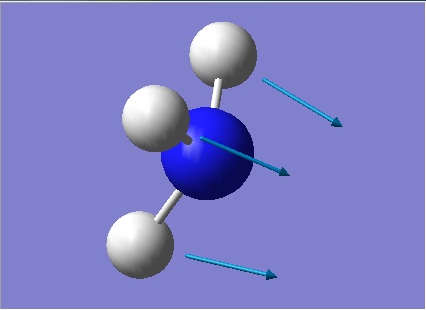
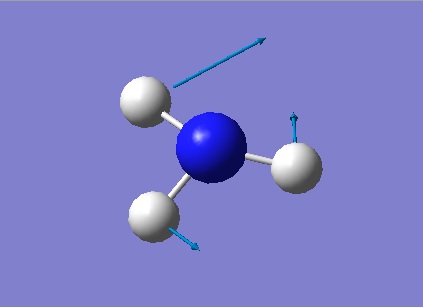
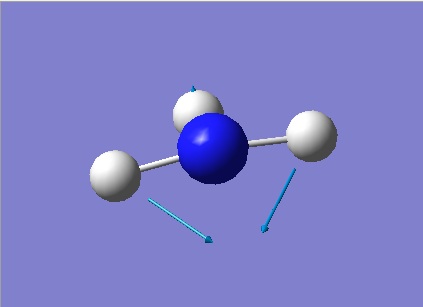
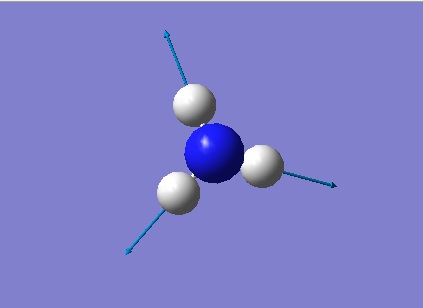
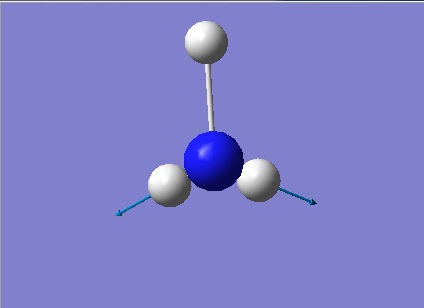
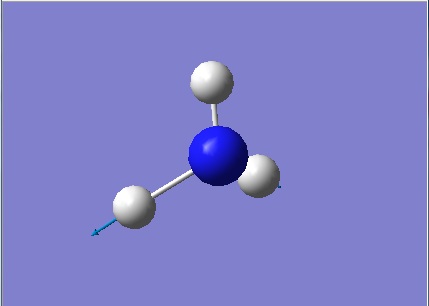
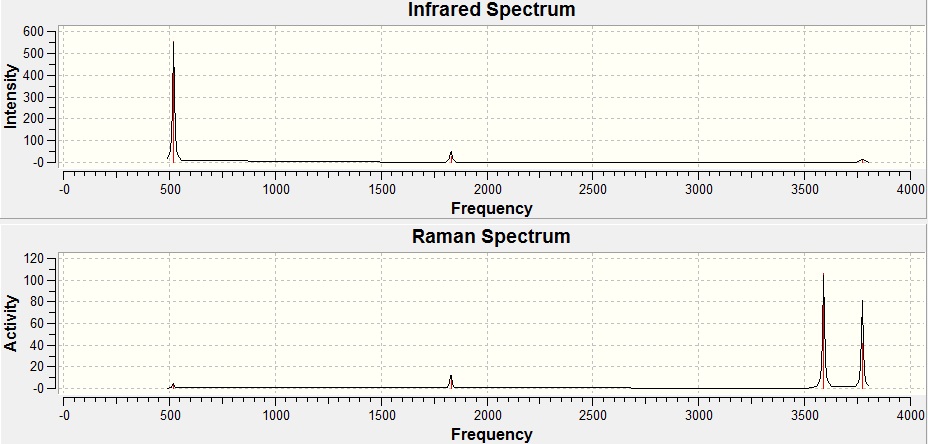
Frequency Analysis
Log file for this calculation can be viewed here:https://wiki.ch.ic.ac.uk/wiki/images/7/79/JYX_NH3_FREQ.LOG
References
- ↑ M. R. Hartman, J. J. Rush, T. J. Udovic, R. C. Bowman Jr and S. J. Hwang J. Solid State. Chem., 2007, 180, 1298 - 1305 DOI:10.1016/j.jssc.2007.01.031
- ↑ M.S. Schuurman, W.D. Allen, H.F. Schaefer III, J. Comput. Chem., 2005, 26, 1106: DOI:10.1002/jcc.20238
- ↑ J. Glaser, Acta Chem. Scand. A, 1979, 33, 789
- ↑ D. J. Darensbourg, Inorg. Chem., 1979, 18, 14. DOI:10.1021/ic50191a003
- ↑ Structural characterizations of cis-Mo(CO)4(PPhMe2)(NHC5H10) and cis-Mo(CO)4(PPhMe2)(PPh3) and their solution reactivities toward carbon monoxide F. Albert. Cotton, Donald J. Darensbourg, Simonetta. Klein, Brian W. S. Kolthammer, Inorg. Chem., 1982, 21 (4), pp 1651–1655. Inorganica Chimica Acta, Volume 254, Issue 1, 1 January 1997, Pages 167-171, Crystal structures of trans-[Mo(CO)4(PPh3)2] and 1,4-bis (diphenylphosphino)-2,5-difluorobenzene, Graeme Hogarth and Tim Norman
- ↑ D. W. Bennett, T. A. Siddiquee, D. T. Haworth, S. E. Kabir, F. K. Camellia, J. Chem. Crys., 2004, 34, 353-359.DOI:10.1023/B:JOCC.0000028667.12964.28
- ↑ D. J. Darensbourg, R. L. Kump, Inorg. Chem., 1978, 17, 2680-2682. DOI:10.1021/ic50187a062
- ↑ F.A. Cotton, Inorg. Chem., 1964, 3, 702: DOI:10.1021/ic50015a024

