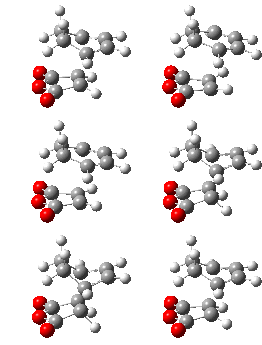
Rep:Mod 3: Tom Campling
Transition States and Reactivity
The Cope Rearrangement
The diagram shown below illustrates the isomerisation of 1,5-hexadiene - a [3,3]-sigmatropic shift rearrangement. This is known as the Cope Rearrangement:

It is now widely accepted that this rearrangement occurs in a concerted fashion via a transition state (structure of maximum energy) when alternating between the isomers. There are two possible transition state structures for this reaction, the boat and the chair, shown below:

The transition state of lowest energy is most likely to be the one which the reaction will proceed through. This section will focus on using computational methods to compare the two transition states and thereby determine the reaction mechanism of the Cope Rearrangement.
Optimisation of 1,5-hexadiene
The structure of 1,5-hexadiene was drawn in Gaussview with the four central Carbon atoms having a dihedral angle of 180o (antiperiplanar linkage). This structure was then optimised using the Hartree-Fock method and 3-21G basis set (NOTE: Structure named upon comparison with table of conformations of 1,5-hexadiene [1]) . The properties of the optimised molecule are shown below:
Energy: -231.69260237 a.u.
Point Group: C2
The structure of 1,5-hexadiene was re-drawn in Gaussview, but this time with a dihedral angle of 60o (Gauche linkage). This was then optimised using the HF/3-21G level of theory as used previously. The properties of the optimised molecule are shown below:
Energy: -231.69166700 a.u.
Point Group: C2
Based on the properties of the two molecules above, it can be expected that the structure of lowest energy will be an anti conformer. Also, one would expect the conformer of lowest energy to have an antiperiplanar structure by simple visual analysis of the steric interactions of the molecule. Therefore a structure where all the carbon atoms are kept as far away from each other as possible should have the lowest energy. Based on these assumptions, the HF/3-21G optimized anti structure shown below was expected to be the lowest energy conformer of 1,5-hexadiene:
Energy: -231.69253528 a.u.
Point Group: Ci.
When compared with the anti 1 structure, it can be seen that the structure shown above is not the lowest energy conformation. This suggests that the hypothesis previously suggested is incorrect. Upon examination of a table of conformations of 1,5-hexadiene [2], it is noticed that the lowest energy conformation is in fact a Gauche conformation. The HF/3-21G optimised structure of this conformation is shown below:
Energy: -231.69266121 a.u.
Point Group: C1
The reason for this conformation being lowest can be seen upon comparison of the molecular orbitals for the gauche and anti forms. In the anti form the pi bonds are far away from each other and unable to interact, however, in the gauche form they are close enough to have a small interaction which lowers the energy a small but significant amount in order to make this conformation that of the lowest energy.
The anti-2 structure was then optimised for a second time at the B3LYP/6-31G(d) level of theory. This should give a more accurate picture of the optimised structure. A comparison of the geometries of the structures is given in the table below (some bonds involving atoms 4, 5 and 6 are not seen in the table below due to the molecule having a point of inversion - they are identical to the corresponding bonds in the other half of the molecule):
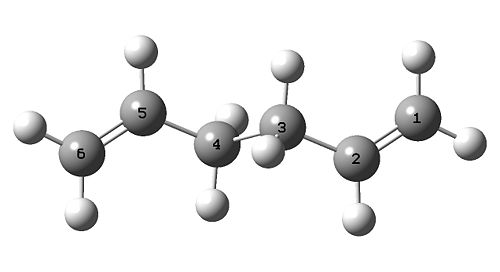
| Property | Bond | 1st Opt (HF/3-21G) | 2nd Opt (B3LYP/6-31G*) |
|---|---|---|---|
| Dihedral Angle (o) | C1-C2-C3-C4 | 114.68 | 118.58 |
| Dihedral Angle (o) | C2-C3-C4-C5 | 180.00 | 179.96 |
| Bond Angle (o) | C1-C2-C3 | 124.81 | 125.29 |
| Bond Angle (o) | C2-C3-C4 | 111.35 | 112.67 |
| Bond Length (Å) | C1=C2 | 1.316 | 1.334 |
| Bond Length (Å) | C2-C3 | 1.509 | 1.504 |
| Bond Length (Å) | C3-C4 | 1.553 | 1.548 |
The energy calculated for the molecule was -234.61171035 a.u.
The table above shows that both the C-C and C=C bond lengths change very little between the two methods (all between 0.02 Å of each other). The bond angles are also consistent, with the most significant being a change of 4o around the C1-C2-C3-C4 dihedral angle. This shows that the two methods give extremely similar structures for the same molecule indicating that either method could be used to determine the lowest energy conformer.
Frequency calculation
In order to confirm the structure optimisation has been a success, a frequency analysis was carried out using the same method and basis set. Some of the frequencies calculated are shown in the table below, followed by the calculated IR spectrum:

The presence of no negative frequencies confirms the structure found is at a minimum. The following table includes a few of the important vibrations found:
| Frequency | Vibration | Description |
|---|---|---|
| 3136.7 | 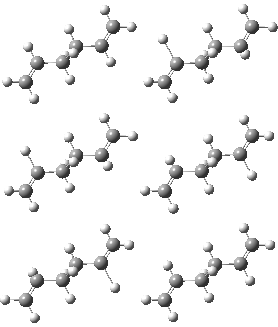 |
C-H Stretch |
| 1724.3 | 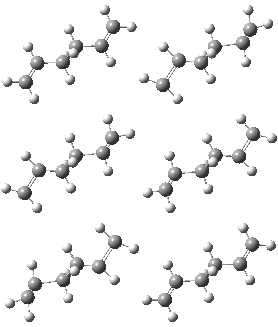 |
C=C Stretch |
| 940.0 | 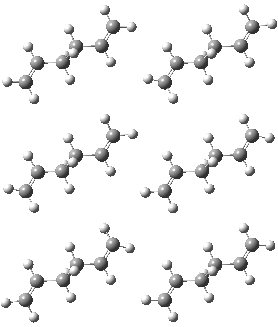 |
C-H Bend |
Thermochemistry
The data shown in the table below is found from the log file of the calculation.
The first of the energy values is the potential energy at 0 K including the zero-point vibrational energy (E = Eelec + ZPE). The second is the energy at 298.15 K and 1 atm of pressure including contributions from the translational, rotational, and vibrational energy modes at this temperature (E = E + Evib + Erot + Etrans). The third contains an additional correction for RT (H = E + RT). The last includes the entropic contribution to the free energy (G = H - TS):
| Property | Energy (a.u.) |
|---|---|
| Sum of electronic and zero-point Energies | -234.469203 |
| Sum of electronic and thermal Energies | -234.461857 |
| Sum of electronic and thermal Enthalpies | -234.460913 |
| Sum of electronic and thermal Free Energies | -234.500776 |
Optimising the Transition Structures
Following the optimisation of the starting products, the boat and chair transition states were optimised. In order to do this, an allyl (CH2CHCH2) fragment was created in Gaussview and optimised using the HF/3-21G level of theory. A duplicated of this fragment was then made and placed next to the original fragment. The two fragments were then arranged to look roughly like the chair transition state as shown in the picture below. The distance betwen the terminal ends of the allyl fragments were made to be ~2.2 Å apart. This new structure was then optimised in two different ways using the same level of theory (HF/3-21G).

TS(Berny) method
The transition state shown below was optimised using Gaussian. During the calculation set-up the calculation type was changed to an "Opt + Freq" calculation, as well as choosing to optimise to a "Transition State (Berny)" rather than optimising to a minimum as before. "Opt=NoEigen" was included in the "Additional Keywords" section in order to prevent the calculation from crashing should more than one imaginary frequency be detected during the optimisation.

|
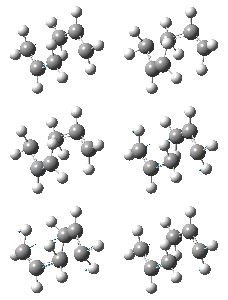
The above molecule is in the chair transition state. It was confirmed to be so from the imaginary vibration calculated at -817.95 cm-1 (shown below).
Frozen Coordinate Method
The transition state structure shown below was optimised using a different approach known as the "Frozen Coordinate Method". This method requires two optimisation calculations to be run in Gaussian. The same starting molecule was used as in the previous method, however this time the bond length between the two terminal carbon atoms were fixed at 2.2 Å. The calculation was then set up and submitted to Gaussian as a "normal" optimisation, to optimise the structure to a minimum but with "Opt=ModRedundant" included in the input line.
Following the first optimisation, the constraints on the terminal bond lengths were lifted and the molecule was optimised again to find the actual bond lengths. The calculation was changed to an "Opt + freq" type and selected to optimise to a "Transition State (Berny)". "Opt=NoEigen" was included in the additional keywords.

|
The above molecule is also in the chair transition state as confirmed by the imaginary vibration at -817.76 shown below.
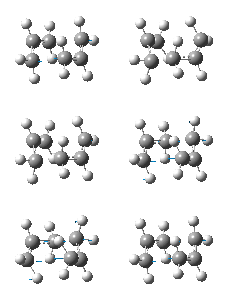
The geometries of the final optimised structures of the different techniques were analysed and presented in the table below:
| Property | Bond | 1st Opt (Computing Force Constants) | 2nd Opt (Frozen Coordinate Method) |
|---|---|---|---|
| Dihedral Angle (o) | C2-C1-C4-C5 | 54.963 | 54.982 |
| Bond Angle (o) | C1-C2-C3 | 120.509 | 120.492 |
| Allyl Bond length (Å) | C1-C2 | 1.389 | 1.389 |
| Bridge-Head Bond Length (Å) | C1-C4 | 2.020 | 2.021 |
The table shows that there is no significant difference between the structures optimised using the different methods. This shows that either method is equally valid for determining a transition state. The first method is quicker, requiring only one optimisation, however it requires quite a good starting guess of the optimised structure. This might not be available when trying to determine transition states for lesser known reactions and in that circumstance the "Frozen Co-ordinate Method" is more useful. This second approach still has its limitations however and is heavily reliant on a good estimation of the terminal carbon bond distances.
QST2 Method
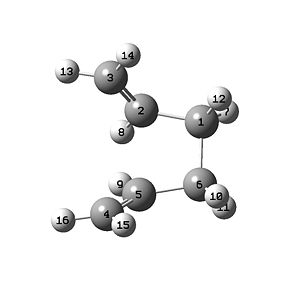
The QST2 method was used to find the optimised boat structure [3] by placing the two molecules shown below into the same molGroup:
 |
|
The molecule shown above on the left is the reactant and on the right is the product of the reaction. The QST2 calculation can be used to interpolate between the two structures to find the transition state between them. The molecule below shows the structure found following the calculation of this method at the HF/3-21G level of theory.

|
The energy of this molecule was found to be -231.60280 a.u.
The single imaginary vibration found at -840.02, confirming that the structure has been successfully optimised, is shown below:

Intrinsic Reaction Coordinate Method
By simply looking at the transition structures, it is almost impossible to predict which conformer will lead to which transition state. The IRC method follows minimum energy paths of reactions. In this instance it follows a reaction along its potential surface from a transition state in the forwards direction to its local minimum (product). This will help to predict which conformer leads to the transition state in question.
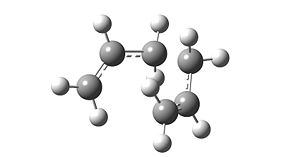
The first IRC job was run to find the molecule shown below after 23 steps:
|
The molecule shown above had a final energy calculated at the HF/3-21G level of -231.68682321 a.u.

The above graphs show that this molecule is not at a minimum energy.
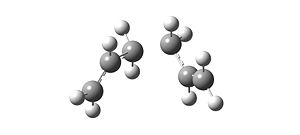
The IRC was attempted for a second time. This time force constants were set to be calculated at every step and the max number of points along the IRC was set to 100. The resulting molecule is shown below:
|
The molecule shown above had a final energy, calculated at the HF/3-21G level, of -231.69166434 a.u. This structure and energy corresponds to the gauche 2 structure shown in the table of conformations of 1,5-hexadiene. The graphs shown below confirm that a minimum energy has been reached after 47 steps:

Calculation of Activation Energies
The activation energies for the reaction via both transition structures was calculated. In order to do this to a reasonable degree of accuracy a higher level of theory is required. The transition state structures previously optimised using the HF/3-21G level of theory, were re-optimised at the B3LYP/6-31G* level. The tables below compares the geometries and energies of the transition states before and after the re-optimisations:
| Property | Bond | 1st Opt HF/3-21G(Computing Force Constants) | 2nd Opt B3LYP/6-31G* |
|---|---|---|---|
| Dihedral Angle (o) | C2-C1-C4-C5 | 54.963 | 54.033 |
| Bond Angle (o) | C1-C2-C3 | 120.509 | 119.953 |
| Allyl Bond length (Å) | C1-C2 | 1.389 | 1.407 |
| Bridge-Head Bond Length (Å) | C1-C4 | 2.020 | 1.968 |
| Energy (a.u. / kjmol) | - | -231.61932 / -6.081165x10⁵ | -234.55698 / -6.15829 x10⁵ |
| Property | Bond | 1st Opt HF/3-21G | 2nd Opt B3LYP/6-31G* |
|---|---|---|---|
| Dihedral Angle (o) | C2-C1-C4-C5 | 0.116 | 0.007 |
| Bond Angle (o) | C1-C2-C3 | 121.679 | 122.268 |
| Allyl Bond length (Å) | C1-C2 | 1.3139 | 1.39323 |
| Bridge-Head Bond Length (Å) | C1-C4 | 2.13971 | 2.20619 |
| Energy (a.u. / kjmol) | - | -231.60280 / -6.08073x10⁵ | -234.54309 / -6.15792 x10⁵ |
The tables above shows that there is no significant difference in geometry of the two structures after the second optimisations. The energy of the molecules are compared with experimental data below.
| HF/3-21G | B3LYP/6-31G* | Experimentally Determined Activation Energy | |
|---|---|---|---|
| Chair (kcal/mol) | 45.4 | 34.3 | 33 ± 0.5 |
| Boat (kcal/mol) | 58.1 | 43.1 | 44.7 ± 2.0 |
The table above shows that the molecule with the lowest activation energy is the chair transition state and is therefore the transition state through which the reaction occurs due to the near degeneracy of the starting and ending conformers.
Diels-Alder Cyclo-Addition
Optimisation of Cis-Butadiene and Its Molecular Orbitals
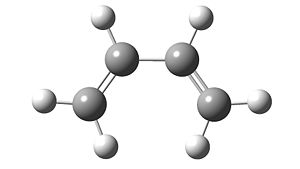
The following structure of cis-butadiene was constructed in Gaussview and optimised using the AM1 semi-empirical molecular orbital method.
|
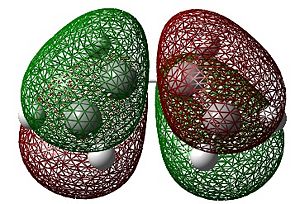
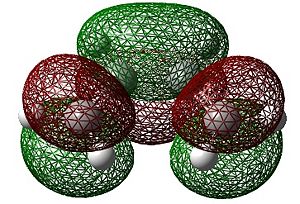
The HOMO and LUMO shown below were visualised using Gaussview:
 |
 |
| HOMO | LUMO |
As can be seen above, the HOMO of cis-butadiene is anti-symmetric whilst the LUMO is symmetric.
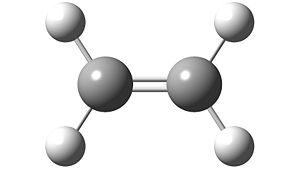
The Following Structure of ethylene Was Constructed in Gaussview and Optimised Using the AM1 Semi-empirical Molecular Orbital Method.
|
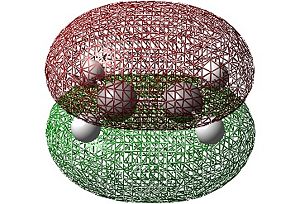
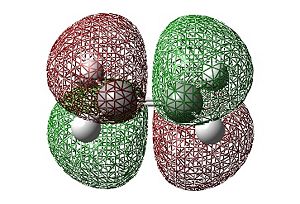
The HOMO and LUMO shown below were visualised using Gaussview:
 |
 |
| HOMO | LUMO |
In the case of ethylene it can be seen that the HOMO is symmetric whilst the LUMO is antisymmetric (with respect to the horizontal plane). This is the opposite symmetry arrangement to cis-butadiene as mentioned previously. These symmetry arrangements of the orbitals allow for symmetry allowed transitions between the MOs of the two molecules to occur. Thus, donation of electron density from the symmetric HOMO of the ethylene to the symmetric LUMO of the cis-butadiene (at the same time as the donation of electrons from the antisymmetric HOMO of cis-butadiene to the antisymmetric LUMO of ethylene) is allowed resulting in the concerted cycloaddition reaction depicted below.
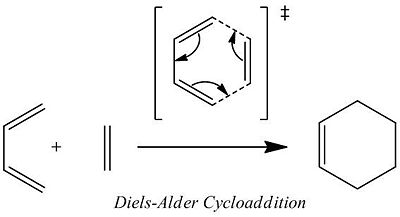
The reaction passes through a transition state involving the concerted formation of two new sigma bonds. The structure of this transition state and its molecular orbitals are examined in the next section.
Computation of the Transition State Geometry for the Prototype Reaction and an Examination of the Nature of the Reaction Path
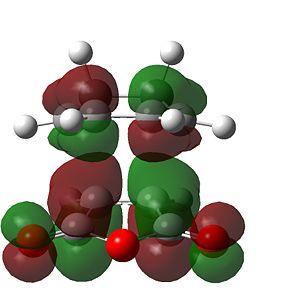
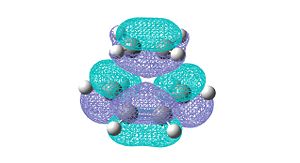
The structure of the transition state of the reaction was found using the frozen coordinate method at the AM1 level of theory. The two reactant molecules were optimised and were then fixed at a distance of 2.2 angstroms away from each other. The structure was then optimised to a minimum. A second calculation was run on the newly optimised structure. This time the fixed bond length condition was removed and an opt+freq calculation was run to optimise to a transition state. The HOMO and LUMO for the transition state found are shown below.
 |
|
| HOMO | LUMO |
The symmetric HOMO of the TS shows the HOMO of cis-butadiene and the LUMO of ethylene overlapping and illustrates the formation of the two σ-bond orbitals in the product molecule. The antisymmetric LUMO of the TS shows the LUMO of cis-butadiene overlapping with the HOMO of ethylene illustrating the formation of the σ*-antibonding orbitals. Both of these interactions are between either two symmetric orbitals, or two anti-symmetric orbitals meaning that the reaction is symmetry allowed.
The bond lengths of the newly formed C-C bonds were both found to be 2.12 A.
Comparing this length to typical carbon sp2-sp2 bonds (1.34A) and sp3 sp3 bonds (1.54A) it is clear that the bond in the transition state cannot be classified as covalent. The van der Wall's radius of a carbon atom is 1.71 A. This means at a nuclear distance of more than 3.42 A there will be no real electron density overlap. The bonds being formed are well within this distance meaning that electron density is being shared between the two molecules. The fact that both bonds are the same length goes further to show that the bonds are formed in a concerted manner.
Maleic anhydride
The following reaction scheme shows the Diels Alder cycloaddition between maleic anhydride and cyclohexa-1,3-diene. The reaction can result in two different products, the endo product and the exo product. It is found experimentally that the endo product is the major product and the aim of this section is to give a reason why using computational methods.
 |
|
The two products shown above have been optimised at the semi-empirical AM1 level of theory. The calculated energy values for both molecules are shown below:
Endo: -0.16023 a.u.
Exo: -0.15997 a.u.
It can be seen there is not a large difference in final energy of the molecules suggesting that the reason for the ratio of the products is not thermodynamic/kinetic. The marginally more stable molecule is the endo form. One would expect this to be the case due to the reduced steric interactions of the endo form - there are fewer hydrogens on the alkyl bridge facing the anhydride functional group.
This small difference in final energy however is not enough to explain the overwhelming majority of the endo molecule being found in the experimental reaction product. Therefore the transition states of the molecules were investigated in order to find a reason for the high selectivity of the reaction.
In the first instance, the reactants were drawn in Gaussview and optimised at the semi empirical AM1 level of theory. The Frozen Co-ordinate method was then used to calculate the transition states of the endo and exo reactions. This was done by recreating the orientations of the product molecules shown above with the reactant molecules and setting a distance to 2.2 Angstroms. The molecules were then optimised to a minimum energy. With these newly optimised structures, the fixed bond distance parameter was removed and Opt+Freq calculations were run to a transition state at the semi empirical AM1 level of theory. The results of these calculations follow.

|
The energy of the above molecule was calculated to be -0.05050316 a.u.

|
The energy of the above molecule was calculated to be -0.05247481 a.u.
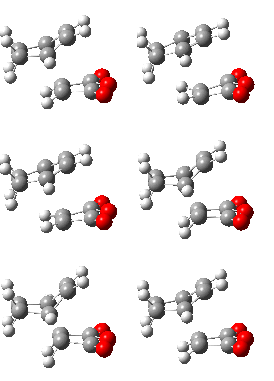
The single imaginary vibrations shown below confirm that both of the transition states have been found.
 |
|
| endo:-806.2 cm -1 | exo: -812.4 cm -1 |
Thus the transition state of the endo molecule was found to be more stable than that of the exo molecule. The reason for this extra stability can be seen upon examination of the molecular orbitals.
The molecular orbitals of the exo form can be seen below:
 |
|
| HOMO | LUMO |
The molecular orbitals of the endo form can be seen below:
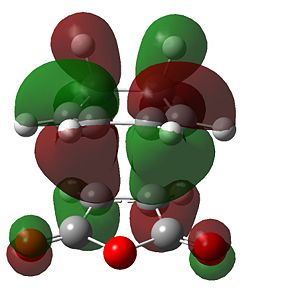 |
|
| HOMO | LUMO |
It can be seen that there is a much better overlap of the sets of pi overlap in the endo form than the exo form. This is a result of the way the orbitals are aligned. Secondary orbital overlap occurs in the endo TS, causing a stabilising effect. This overlap is between the in-phase orbitals on each of the fragments - the π orbitals in the cyclo-1,3-hexadiene fragment and the π* orbitals of the C=O of the maleic anhydride. This interaction is impossible in the maleic anhydride as the distance between the two sets of orbitals is too great.
Conclusion
Gaussian calculations have been used to find the transition states (and their respective activation energies) of pericyclic reactions. This information can be used to rationalise the products of such reactions and indeed predict the products of other similar reactions. Information on stereoselectivity can also be gleaned from such analysis. This technique, however, cannot conclusively tell us which product will be the major, and which will be the minor in a reaction - this must be confirmed experimentally.
Improvements to the Gaussian model used would include the use of better basis sets (at a cost), and the inclusion of solvents and other reactant molecules. In conclusion, these computational techniques are an extremely useful advisory tool for the chemist, but the results they give should be treated with a pinch of salt, as they are based on approximations and they also depend on the accuracy of the initial model input by the computational chemist.


