Rep:Mod 3: CouchMA
Introduction
Cope Rearrangement of 1,5-hexadiene
Optimisation of conformers
1,5-hexadiene can exist in many conformations, each with its own energy. In this section, different conformations of 1,5-hexadiene are drawn and optimised using the Hartree-Fock method with a 3-21G basis set.
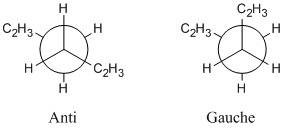
Both anti and gauche conformations were drawn, changing the conformation of the C2H3 group to make a variety of different conformations all with differing energies, trying to locate the lowest energy conformation.
|
Intuitively, one might expect the anti conformers to be lower in energy than the gauche conformers due to an absence of steric effects. Looking at Table 1, it can be seen that Gauche 3 is actually the lowest energy conformer, with a stabilisation of 0.2 kJ/mol compared to the Anti 1 conformer. This surprising observation could be due to a favourable overlap between the C=C π orbital and the vinyl C-H σ* antibonding orbital leading to an overall stabilisation in the energy of the molecule. With a calculation accuracy of ±10 kJ/mol, this observation is somewhat negligible.
The Anti 2 conformation was then taken and optimised using the DFT/B3LYP method and a 6-31G* basis set, giving a total energy of -234.61171 atomic units[5]. Although the total energy may not be used to compare the different optimisations (due to the different methods using different energy scales), the geometry of the conformation may be used as a comparison.
The main change in the geometry of the conformer is the 3,4,5,6 and 1,2,3,4 C-C-C-C dihedral angles, which change from 115° to 119° when the higher level method is applied. This widening of the angle brings the molecule into such a conformation such that steric interactions are reduced.
Vibrational Analysis of the Anti 2 Conformation[6]
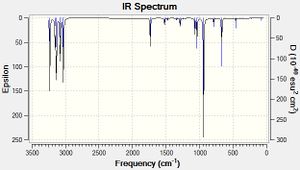
A vibrational analysis of the optimised Anti 2 conformation was carried out using the DFT/B3LYP method and 6-31G* basis set. This was performed in order to ensure that the optimisation reached a minimum, and is confirmed by the absence of any vibrations of negative frequency. The first vibrational energy is shown in the second line of the excerpt from the log file below, where it can be seen to be positive, thus proving that the optimisation proceeded to a minimum.
 Low frequencies ---  -28.7051   -0.0009   -0.0007   -0.0006    4.0904    8.2138
 Low frequencies ---   75.1151   80.4523  122.1479
The following extract from the log file contains the thermochemical data, which was recorded for later use.
 -------------------
 - Thermochemistry -
 -------------------
 Sum of electronic and zero-point Energies=           -234.469203
 Sum of electronic and thermal Energies=              -234.461859
 Sum of electronic and thermal Enthalpies=            -234.460915
 Sum of electronic and thermal Free Energies=         -234.500768
Transition state analysis
In this section both the chair and boat transition states of the [3,3]-sigmatropic cope rearrangement were optimised and analysed. Different methods of transition state optimisation were explored so that the advantages and disadvantages of each method could be observed.
Chair Transition State
|
|
Generating the Allyl Fragment
An allyl (CH2CHCH2) fragment was drawn and optimised using HF 3-21G[7].
TS (Berny) Method[8]
The optimised allyl fragment was copied and pasted twice into GaussView before being adjusted to resemble the chair transition state, with the allyl fragments approximately 2.2 Å apart. This was then optimised to a TS (Berny) before having a frequency analysis performed on it (Opt+Freq). It was selected for the force constant to be calculated once and the keywords "Opt=NoEigen" were added. The optimised distance between the fragments was 2.02 Å and the total energy of the transition state was -231.61932 atomic units.
The presence of a transition state was confirmed by the single negative frequency present at -818cm-1.
 Low frequencies --- -817.9061   -3.1571   -1.4472    0.0007    0.0009    0.0010
 Low frequencies ---    1.4776  209.5361  396.0094
 ******    1 imaginary frequencies (negative Signs) ******

                     1                      2                      3
                     A                      A                      A
 Frequencies --  -817.9061               209.5361               396.0094
Frozen Coordinate Method
In this section the bonds made/broken in the transition state are frozen to a length of 2.2 Å whilst the rest of the molecule is optimised to a minimum[9]. This produces a structure which looks like the transition state from the previous exercise, but whose inter-fragment bond lengths are 2.2 Å.
This structure is then taken and optimised to a TS (Berny)[10], as done in the previous section. The bond lengths can now be seen to have reduced down to 2.02 Å, as was seen in the previous exercise. The overall energy of the molecule was -231.61932 atomic units, indicating the same structure as the one generated previously had been found.
Boat Transition State
 |
QST2 Optimisation
In this method of transition state optimisation the reactants and products are input into the program, which then calculates the transition state between them. For this method it is critical that the atoms in the reactants and products are labelled correctly so that they match one-another.
The initial optimisation failed, creating a transition state more closely resembling the chair TS[11].
This occurred because the program cannot determine that a rotation around the central C-C bond would be beneficial. In order for the transition state to be correctly computed, the reactants and products must first be made to look more like the boat transition state. The central C-C-C-C dihedral angle was therefore set to 0° and the external C-C-C angles were set to 100°, both on the reactants and the products.
This time, the Opt+Freq QST2 calculation completed[12], giving a transition state with an energy of -231.60280 atomic units and an inter-fragment separation of 2.14 Å.
The presence of a transition state was confirmed by a single imaginary vibration at -839cm-1.
 Low frequencies --- -839.4164   -3.9043   -0.0020   -0.0001    0.0003   10.0180
 Low frequencies ---   10.8264  155.9993  382.1728
 ******    1 imaginary frequencies (negative Signs) ******
                     1                      2                      3
                    B1                     A2                     A1
 Frequencies --  -839.4164               155.9993               382.1728
|
It can be clearly seen from the table above that the boat structure is higher in energy than the chair transition state by approximately 40 kJ/mol, which is a large energy difference, especially seeing as they are simply different conformers of the same molecule!
Intrinisic Reaction Coordinate
Chair IRC
In this section the optimised chair transition state structure is taken and followed down the reaction coordinate to a minimum energy structure which should correlate to one of the minima obtained in the first exercise of the module.
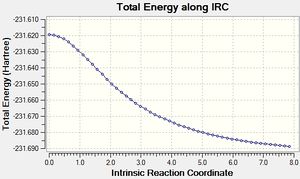
The IRC calculation does this by displacing the atom coordinates slightly along the forward direction of the imaginary vibration and optimising the energies of the other atoms. This process is what happens in one step of the IRC calculation; and the number of steps was set to 50[13]. In order to prevent the IRC from moving the structure too far down the potential energy surface in one go, the additional keywords "irc=stepsize=5" were set. This prevention of larger step sizes negated an error encountered whereby the structure could not be further optimised after 26 steps.
 |
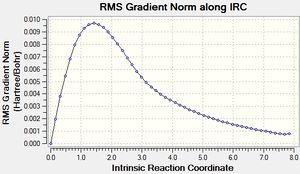 |
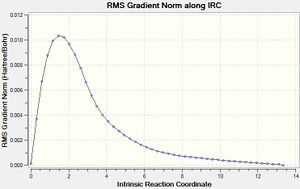
The initial IRC calculation failed to reach a minimum because the number of steps was constrained to 50, which was not enough to allow the calculation to reach the bottom of the potential energy surface. In light of this, the calculation was run again, this time setting the program to calculate a new force constant after each step[14]. This made each step a lot more accurate in terms of following the reaction coordinate, and allowed the calculation to reach a minimum energy of -231.69166 atomic units, which is the same as the Gauche 2 conformation seen previously.
 |
 |
Boat IRC
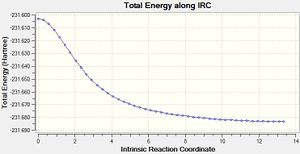
The same method as above was employed on the boat transition structure, but this time skipping out the initial calculation where the force constant was only calculated once, instead starting with a 50 step force always calculation[15]. The minimum reached had an energy of -231.68303 atomic units and had a synperiplanar conformation about the central C-C bond. Such a conformation was not considered in the initial section of this module.
 |
 |
Activation Energies
In this section the chair and boat transition states were re-optimised using the DFT/B3LYP method and 6-31G* basis set in order to more accurately model the activation energies of the Cope Rearrangement. The results are summarised below in Table 3 where it can be seen that the calculated activation energies at 0 K for the DFT method match those given in the literature of 33.5 ± 0.5 kcal/mol for the chair transition state and 44.7 ± 2.0 kcal/mol for the boat transition state. It can also be seen that the DFT method used is more accurate than the HF method used.
| |||||||||||||||||||||||||||||
Eact at 298.15 K
The activation energies were also calculated using the thermally corrected energy values given in the output files. These values are shown in Table 4 and show that, whilst this may be more accurate for the chair activation energy, it was less accurate for the boat activation energy.
| |||||||||||||||||
As expected, the activation energy for the Cope Rearrangement is lower for the chair transition state, both at 0 K and at 298.15 K, indicating that the reaction is more likely to proceed via this pathway. This is due to a increased amount of torsional strain in the boat structure which raises the energy of the transition state.
The Diels-Alder Cycloaddition
Diels-Alder cycloaddidions are quite possibly the most common of the pericyclic reactions. A Diels-Alder reaction involves the concerted creation of two σ C-C bonds from the overlapping π orbitals of a diene and dieneophile in a [2+4] cycloaddition.
Simplest Reaction
The simplest Diels-Alder reaction is that between ethene and cis-butadiene, where ethene is the dieneophile and cis-butadiene the diene.
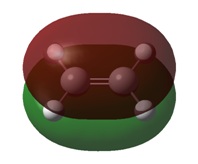
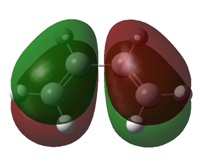
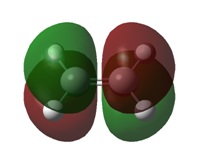
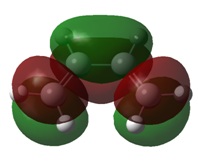
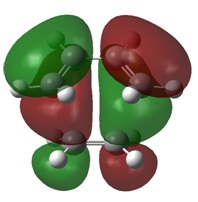
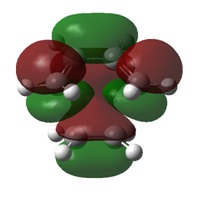
The formation of new bonds is subject to decent overlap of the HOMO on one reactant and the LUMO on the other, with the reaction only being allowed if the orbitals are of the same symmetry and overlap well with one-another. The relevant MOs of ethene and cis-butadiene are illustrated below in Table 5
|
It can be seen from the table above that the HOMO of ethene and the LUMO of cis-butadiene are of the same symmetry and vice-versa. This, combined with the good overlap between the fragments, indicates that the Diels-Alder reaction will proceed. Symmetry was looked at from the perspective of the plane which intersects the central C-C bond.
Transition State
The ethene and cis-butadiene fragments were positioned 2.2 Å apart and the frozen coordinate method was employed to optimise the molecules to a transition state[20]. The AM1 semi-empirical molecular orbital method was used to compute the transition state, which was proven by the presence of a single imaginary vibration at -956cm-1.
|
| ||
|
|
The vibrational visualisation clearly shows how the sp2 centres are transforming to sp3 during the transition. It also shows the shortening of the central C-C bond in cis-butadiene as it becomes a double bond and the lengthening of the terminal C-C bonds as they move from being double to single bonds. The Jmol button shows that the double bonds are longer than the normal C=C length of 1.34 Å and also that the single bonds are slightly shorter than the usual C-C bond length of 1.54 Å. The inter-fragment bond length of 2.12 Å is much longer than a normal bond length, but this is to be expected due to the structure being a transition state, where bonds are in the process of being formed.
 Low frequencies --- -956.0777   -5.5032   -2.0749   -0.8189   -0.0032    0.0327
 Low frequencies ---    0.0736  147.0702  246.7489
 ******    1 imaginary frequencies (negative Signs) ******

                     1                      2                      3
                     A                      A                      A
 Frequencies --  -956.0777               147.0700               246.7489
The molecular orbitals of the transition state clearly show the interactions between the MOs of the reactant molecules, also showing the retention of symmetry from the fragment molecular orbitals.
|
Here is can be seen that the LUMO of ethene has combined with the HOMO of cis-butadiene, both anti-symmetric atomic orbitals, to create the antisymmetric HOMO in the transition state. Similarly, the HOMO of ethene and the LUMO of cis-butadiene have combined to give the symmetric LUMO in the transition state.
The transition state MOs provide a useful insight into the bonds made during the [2+4] cycloaddition. The HOMO shows a donation from the π orbitals of the cis-butadiene to the π* orbital of ethene, thus depicting the formation of a C-C bond in the product. The LUMO shows donation from the π orbital of ethene into the π* orbitals of cis-butadiene, which forms forms a π bond across the central bond in cis-butadiene.
1,3-Cyclohexadiene with Maleic Anhydride
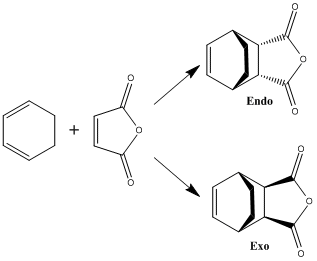
The reaction of maleic anhydride with 1,3-cyclohexadiene can proceed through either an endo or exo transition state, forming the two products illustrated above. Studies have shown that the endo product is formed preferentially, being the kinetic product of the reaction.
A reaction's kinetic product is that which is formed the fastest, due to a lower energy transition state. This exercise will study the endo and exo transition states in order to ascertain whether or not this hypothesis is true.
Optimisation
Both structures were optimised to a transition state using the AM1 semi-empirical molecular orbital method and the frozen coordinate method.
The transition states were confirmed by vibrational analysis, where one imaginary vibration was indicative of a transition structure. The inter-fragment distance is illustrated in the Jmol and is approximately 2.2 Å for both the endo and exo transition states, with the endo distance being marginally smaller.
It is also clear from the Jmols that the exo fragment is more sterically strained than the endo fragment because the maleic anhydride fragment clashes with the sp3 hydrogens of the 1,3-cyclohexadiene fragment, which does not happen in the endo transition state. This steric clash is more obvious if the spacefilling schematic is turned on (Right click -> Scheme).
Endo Transition State Vibration[21]
 Low frequencies --- -806.6444   -3.5098   -1.1912   -0.3320   -0.0104    0.5043
 Low frequencies ---    2.4321   62.4893  111.7554
 ******    1 imaginary frequencies (negative Signs) ******

                     1                      2                      3
                     A                      A                      A
 Frequencies --  -806.6444                62.4890               111.7553
Exo Transition State Vibration[22]
 Low frequencies --- -813.1006   -8.1142   -4.7800   -2.9133   -0.0049    0.0910
 Low frequencies ---    0.4772   60.0049  123.9592
 ******    1 imaginary frequencies (negative Signs) ******

                     1                      2                      3
                     A                      A                      A
 Frequencies --  -813.1006                59.9859               123.9589
IRC
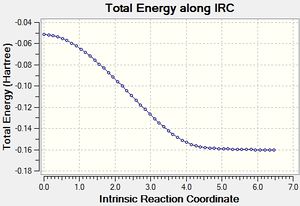
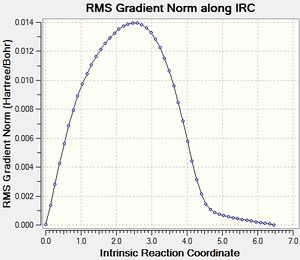
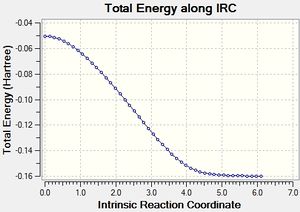
In order to confirm that the transition states shown above are true transition states, IRC calculations were performed on each transition state. The products were then visualised to make sure that the transition states were correctly assigned. The IRC calculations were set to follow the path forwards only to a maximum of 100 points, always calculating force constants and the additional keywords of "irc=stepsize=5".
Endo IRC[23]
 |
 |
Exo Product[24]
 |
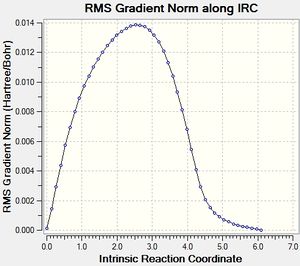 |
These IRC trajectories show that the transition states have been correctly assigned to their relevant products, and that the transition states obtained were true transition states.
Molecular Orbitals
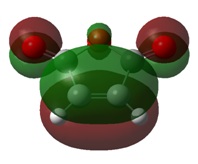
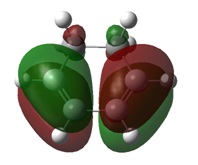
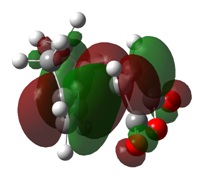
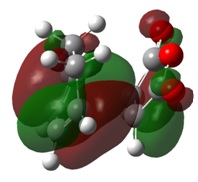
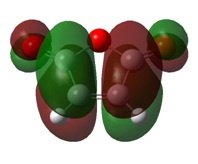
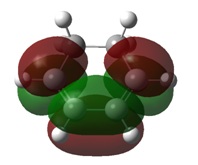
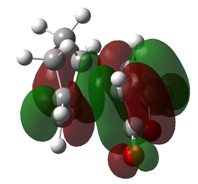
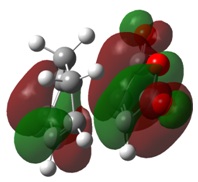
Once the transition states had been correctly identified, the molecular orbitals of the starting products and the transition states were visualised.
|
As with the simple example looked at previously, the MOs of this Diels-Alder reaction show the bond formation by overlap of HOMO π orbitals with the LUMO π orbitals of the other fragment.
MO analysis also indicates a stabilisation of the endo transition state, caused by the secondary orbital overlap of the oxygen lone pairs on maleic anhydride with the π orbitals of the 1,3-cyclohexadiene fragment. This secondary overlap is not clearly visible on the diagrams due to the use of a low computational method.
Activation Energy
The DFT/B3LYP method was used with a 6-31G* basis set to calculate the energies of each reactant and the overall energy of the transition state. These energies are given below in Table 9 and show definitively that the endo transition state is lower in energy. This lower activation energy is the reason for which the endo product is formed exclusively as the kinetic product of this Diels-Alder reaction.
| |||||||||||||||
This table confirms that the endo pathway is favoured in a kinetic sense and therefore explains the reaction's selectivity for the endo product.
Conclusion
In ths module, Hartree-Fock and AM1 semi-empirical molecular orbital method methods were used to optimise reactants to a transition state. Vibrational analyses of the transition states were performed and the imaginary frequencies explored. IRC trajectories were also visualised in order to show that the transition states related to the desired products. Finally, activation energies were looked at and interpreted to explain why certain reaction mechanisms were favoured over others.
The first part of the module looked at the different transition structures involved in the [3+3]-sigmatropic Cope rearrangement and attempted to analyse different conformational products of the rearrangement. This exercise gave a thorough understanding of all the different methods and analytical techniques used when investigating transition states, the knowledge of which was applied in the following exercise.
The second part of the module explored the transition states of Diels-Alder reactions with the ultimate aim to be able to rationalise why the endo product dominates over the exo product. The techniques learnt in the first half of the module were employed, as well as looking closely at molecular orbitals. This analysis of the endo and exo transition states gives a definitive rationalisation as to why one product is formed preferentially.
Overall the module went well, with only a few minor hitches encountered during the IRC calculations, easily resolved by the addition of "irc=stepsize=5" to the keywords. The major caveat of these calculations is the need to roughly know the structure of the transition state before starting the calculations however, given the time constraints and level of computing power available, these methods used were altogether acceptable.
References
- ↑ 1.0 1.1 Anti 2 Optimisation Log File
- ↑ Anti 1 Optimisation Log File
- ↑ Gauche 1 Optimisation Log File
- ↑ Gauche 3 Optimisation Log File
- ↑ 5.0 5.1 Anti 2 Optimisation Repository DOI:10042/to-8046
- ↑ Anti 2 Freq Repository DOI:10042/to-8045
- ↑ Allyl Fragment Optimisation Log File
- ↑ 8.0 8.1 TS(Berny) Opt+Freq Log File
- ↑ Frozen Coordinate Log File (Chair TS)
- ↑ Frozen Transition State Log File
- ↑ Failed QST2 Optimisation Log File
- ↑ 12.0 12.1 Boat Transition State Optimisation Log File
- ↑ 50 step chair IRC Log File
- ↑ Forcealways chair IRC Repository DOI:10042/to-8055
- ↑ Boat IRC (Force Always) Repository DOI:10042/to-8057
- ↑ 16.0 16.1 Chair Transition State DFT Optimisation Log File
- ↑ 17.0 17.1 Boat Transition State DFT Optimisation Log File
- ↑ Ethene MO DOI:10042/to-8132
- ↑ Cis Butadiene MO Repository DOI:10042/to-8131
- ↑ Ethene, Cis-butadiene TS Optimisation Repository DOI:10042/to-8134
- ↑ 21.0 21.1 21.2 Endo Transition State Opt+Freq Repository DOI:10042/to-8136
- ↑ Exo Transition State Opt+Freq Repository DOI:10042/to-8137
- ↑ Endo IRC Repository DOI:10042/to-8138
- ↑ Exo IRC Repository DOI:10042/to-8139
- ↑ Maleic Anhydride MO Repository DOI:10042/to-8143
- ↑ Cyclohexadiene MO Repository DOI:10042/to-8144
- ↑ Endo DFT Optimisation Repository DOI:10042/to-8140
- ↑ Exo DFT Optimisation Repository DOI:10042/to-8141


