Rep:Mod 2: Tom Campling
Module 2: Bonding (Ab Initio and Density Functional Molecular Orbital)
BH3
Optimization of BH3
A BH3 molecule was created in Gaussview and optimized using the Gaussian interface. Below is the summary of the results of the optimization of the BH3 molecule: [1]
| File Type | .log |
| Calculation Type | FOPT |
| Calculation Method | RB3LYP |
| Basis Set | 3-21G |
| RMS Gradient (a.u) | 0.00000285 |
| Dipole Moment (D) | 0.0000 |
| Bond Angle (°) | 120.0 |
| Bond Length (Å) | 1.19 |
| Point Group | D3H |
| Energy (a.u. / kj/mol) | -26.46226 / -69477 |
| Calculation Time (s) | 27.0 |
A .log file is created containing all the information from the calculation. The basis set used for the calculation was 3-21G. This is not a particularly accurate basis set however it gives good starting point for looking at the geometries and bond lengths of the molecule after only a very short computing time (27 seconds). The RMS Gradient gives us an insight into whether or not the molecule has been optimized using the basis set in question - the smaller the RMS gradient the more optimized the molecule. The value for this calculation is much smaller than 0.001 and it can therefore be assumed that the optimization has completed. Clicking on the button below will open up an interactive interface of the optimized structure of BH3.
NBO Analysis
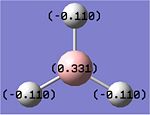
A natural bond orbital analysis was carried out on the BH3 molecule using Gaussview. The NBO charges calculated for the atoms in BH3 can be seen on the diagram below. [2] It shows the central Boron atom to have a charge of +0.331 and each of the hydrogen atoms to have a charge of -0.110. This shows the electron density resides nearer the hydrogen atoms than the central Boron atom. This is illustrative of how electron rich Boron is relative to hydrogen. The fact that the charge is equally spread over the three hydrogen atoms demonstrates the symmetry of the molecule.
Examination of the .log file tells us that in each Boron-Hydrogen bond, slightly more of the electron density making up the bond comes from the hydrogen (55.51%) compared to the boron (44.49%). This is indicative of Boron's higher electronegativity, which withdraws electron density from the hydrogen atoms.
Molecular Vibrations of BH3
An analysis of the molecular vibrations of BH3 was carried out. [3]
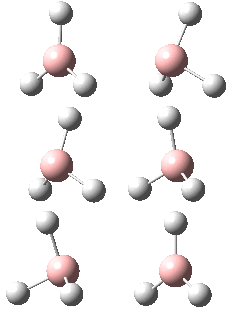
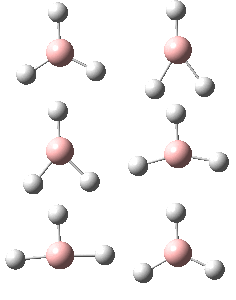
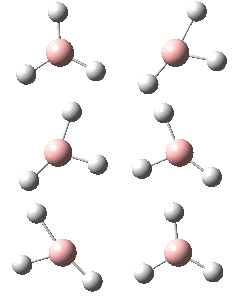
The following table shows the vibrations of the BH3 molecule found using the Gaussian interface:
The table above shows that six vibrations have been calculated. This makes sense due to there being 3N-6 modes of vibration (N = 4 in this case due to Borane having 4 atoms). The .log file shows there are 6 vibrations at low frequencies (the top line shown below). These are attributed to the movement of the centre of mass of the molecule and can be thought of as the -6 in the 3N-6 equation. The fact that there are no negative frequency vibrations shows that the calculation has been a success. The following screen shot of the .log file shows the calculation had been done to a reasonable degree of accuracy due to these low frequency vibrations being so close to zero:

The following IR spectrum was calculated for the same molecule:
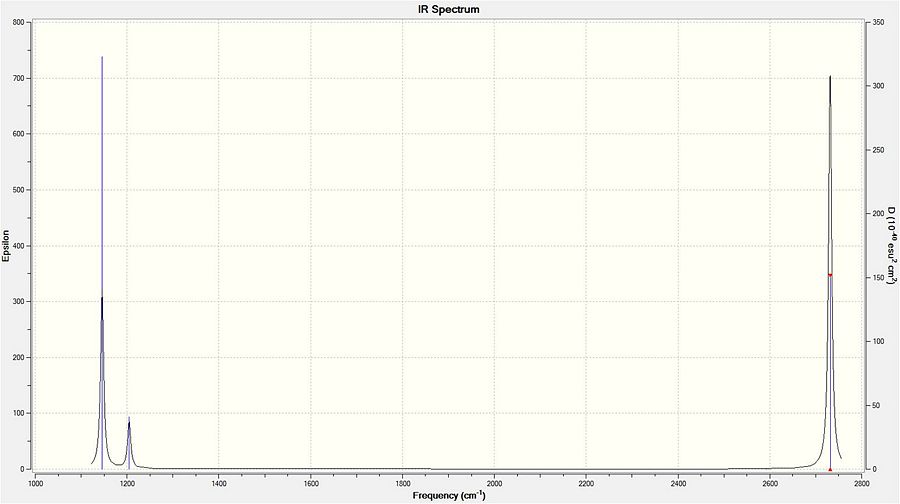
The above spectrum shows only three peaks when 6 vibrations have been calculated. This is a result of two phenomena. The first is degenerate vibrations. There are two sets of degenerate vibrations: 2 & 3 and 5 & 6. These pairs of vibrations will each appear as single peaks on an IR spectrum (with a much higher intensity than a vibration without degenerate vibrations). The second is due to a vibration with an intensity of zero - a symmetric stretch. A symmetric stretch has no overall dipole moment and therefore doesn't give a vibration.
Molecular Orbitals of BH3
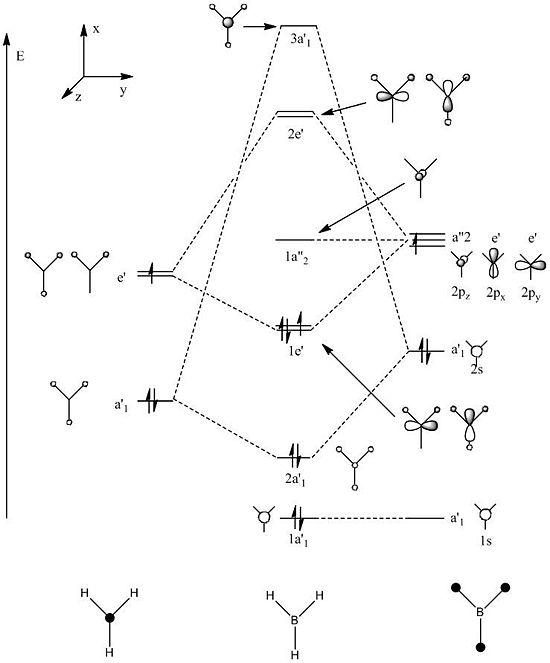
The molecular orbital diagram of BH3 containing the LCAO molecular orbital representations is shown below. Illustrated to the right of it are the "real" molecular orbitals calculated using Gaussian. [4]
 |
|
Both the appearance and order (in terms of energy) of the molecular orbitals calculated here match up extremely well with the orbitals predicted using the LCAO approach. This is indicative of how accurate and powerful the LCAO approach can be - it avoids the use of long, time consuming calculations to get to a good approximation of the real picture just by following a few simple rules. The energies of the orbitals calculated are shown below.
| Orbital | Energy / a.u. |
|---|---|
| LUMO+3 | 0.191 |
| LUMO+2 | 0.188 |
| LUMO+1 | 0.188 |
| LUMO | -0.074 |
| HOMO | -0.356 |
| HOMO-1 | -0.356 |
| HOMO-2 | -0.517 |
| HOMO-3 | -6.730 |
The energies given above confirm the LCAO prediction of two sets of degenerate orbitals.
TlBr3
Optimizing A Molecule of TlBr3
The following data was found from the optimization calculation of a TlBr3. [5]
| File Type | .log |
| Calculation Type | FOPT |
| Calculation Method | RB3LYP |
| Basis Set | LANL2DZ |
| RMS Gradient (a.u) | 0.00000090 |
| Dipole Moment (D) | 0.0000 |
| Point Group | D3H |
| Energy (a.u. / Kj/mol) | -91.218 / -239490 |
| Bond Angle (°) | 120.0 |
| Bond length (Å) | 2.65 |
The LANL2DZ basis set was used to perform the calculation. This takes into account the D-orbitals of the Tl atom and also uses a psuedo-potential to approximate interactions of electrons in low-lying orbitals.
It is important that the frequency calculation used the same basis set and method as the optimization calculation due to the frequency being the second derivative of the energy analysis.
Vibrational Analysis of a Molecule of TlBr3
A Vibrational Analysis of TlBr3 was carried out. [6] The Low frequencies found in the log file are all close to zero indicating a successful optimization. The following table shows all of the low frequency vibrations found.
| Low frequencies cm-1 |
|---|
| -3.423 |
| -0.003 |
| -0.000 |
| 0.002 |
| 3.936 |
| 3.936 |
The lowest real normal frequencies were found to be 46.429, 46.429 and 52.145 cm-1. These are all positive values confirming the optimized structure is at a minimum energy.
In some structures Gaussview does not draw in a bond. This is due to one of the defining characteristics of a bond that is written into Gaussview being that the internuclear distance of two atoms must be within a certain distance for a bond to exist. Gaussview has been developed largely to perform calculations on organic molecules that will have bond lengths within a certain range and will therefore not recognise an internuclear distance outside of this normal range. This does not mean that the optimized structures studied in this report suddenly lose bonds.
A bond is an area of electron density found between two nuclei that allows an entire system of nuclei and electrons to lower their overall potential energy. The optimum separation distance (bond length) for the two nuclei is the distance at which the energy is a minimum. This can be demonstrated by the Lennard-Jones potential energy curve which plots nuclear separation (r) against potential energy (V): [7]
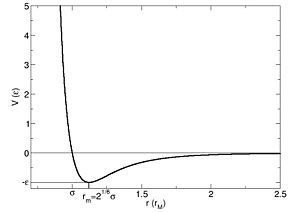
The minimum point on this graph would correspond to the optimum nuclear separation and bond length.
Isomers of Mo(CO)4(PCl3)2
The first optimizations of the cis[8] and trans[9] isomers were run with basis set....
Second optimizations of the cis [10] and trans [11] isomers were run using modified geometries.
A vibrational analysis of each isomer [12] [13] was then carried out. The results are in the tables that follow:
The vibrations of the two isomers shown above have similarities and differences. Both isomers have two low frequency vibrations relating to the rotation of the two PCl3 groups around their P-Mo bonds. In each case, one vibration has the two groups rotating in phase whilst the other vibration has the two rotating in antiphase.
Both isomers exhibit C=O stretches. The Cis-isomer shows 4 intense peaks resulting from Carbonyl stretches whereas the trans-isomer only has two intense vibrations which are degenerate. This is a result of the difference in symmetry of the two molecules. The trans molecule has D4h symmetry and as a result has planes of symmetry along all three axes. This results in two of the vibrations becoming symmetric stretches which have a dipole moment of zero and therefore no peak on the IR spectrum. It causes the anti-symmetric vibrations to be degenerate.
 |

|
| cis | trans |
trans D4h cis C2v
Mini Project
This mini project will look at three different variations of AlPCl3X3 shown below.
The aim of the project is to analyse the effect of the X3 group on the lewis basicity of the phosphorous atom. The structures of the molecules will be optimized before any analysis takes place. This can be done by analysing the length of the Al-P bond for structures with phosphorous substituted with 3 Fluorine, Chlorine or Bromine atoms. An NBO analysis will also be carried out to compare how much electron density is donated by the phosphorous in the Al-P bond.
The molecules were constructed in Gaussview and then optimized [14][15][16] using the Gaussian interface using a 3-21G (d) basis set followed by the 6-31G (d,p) basis set. The B3LYP method was employed for both calculations. A population analysis was then carried out [17][18][19] in order to map the molecular orbitals.
Phosphorous is a lewis base, and therefore donates a pair of electrons to form a dative bond with the aluminium. It is expected that electronegative atoms, if placed around the phosphorous, will prevent electron density being donated to the aluminium as much as normal due to their electron withdrawing effects. This will therefore keep more electron density much closer to the phosphorous atom. The more electronegative the substituent atoms placed on the phosphorous, the stronger this effect will be. Therefore it is expected that the P-Al bond will become stronger (and therefore shorter) as the electronegativity of the substituent X atoms decreases.
The results of the optimizations, along with the Al-P bond lengths and the HOMO and LUMO visualisations of the molecules in question, are shown below.
|
| |||
| Al-P Bond Length (A) | 2.542 | 2.619 | 2.561 |
| LUMO |  |
 |
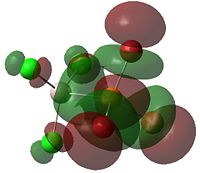
|
| HOMO |  |
 |
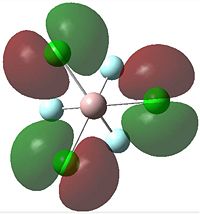
|
The .log file was checked to confirm that all of the optimizations had converged.
It was noticed in the log file that the symmetry had been set too high and was unable to break and therefore optimize fully.
| X Substituent | Local Charge on P | Local Charge on Al |
| F | 1.093 | 0.444 |
| Cl | 0.718 | 1.356 |
| Br | 0.508 | 0.513 |
The trend predicted is realised in the table above. However, the electron density on the aluminium does not follow the opposite trend suggesting that aluminium becomes less electron rich when phosphorous is substituted with chlorine compared to fluorine. Fluorine has a lone pair of electrons lying in a p-orbital perpedicular to the plane. These electrons could potentially be donated into a vacant d-orbital on the phosphorous allowing the lone pair on the phosphorous to donate to the aluminium atom. This would explain
Conclusion
It has been shown by NBO analysis that an increase in electronegativity on phosphorous substituted compounds reduces the lewis basicity of the phosphorous atom.
References
- ↑ BH3 Optimization .log File
- ↑ Link to DSpace Repository
- ↑ BH3 Vibrational Analysis .log File
- ↑ Link to DSpace Repository
- ↑ TlBr3 Optimization .log File
- ↑ Vibrational Analysis of TlBr3 .log File
- ↑ Lennard Jones Potential Ref
- ↑ Link to DSpace
- ↑ Link to DSpace
- ↑ Link to DSpace
- ↑ Link to DSpace
- ↑ Link to DSpace
- ↑ Link to DSpace
- ↑ http://hdl.handle.net/10042/to-7972
- ↑ http://hdl.handle.net/10042/to-7973
- ↑ http://hdl.handle.net/10042/to-7974
- ↑
http://hdl.handle.net/10042/to-7975 - ↑ http://hdl.handle.net/10042/to-7976
- ↑
http://hdl.handle.net/10042/to-7977

