Rep:Mod 2: CouchMA
Introduction
This module aims to instruct on good usage of the GaussView program as a portal to Gaussian calculations. It builds upon module 1, looking more closely at the different basis sets available for use by users of GaussView, providing a generic overview such that after having studied the module, it is possible to go away and apply this new knowledge to foreign situations.
The module starts of with the basics, allowing for self-familiarisation with the new programs and slowly develops the user's knowledge and skills such that by the end of the module these skills may be implemented on a mini-project.
The mini-project itself is a platform for exploration and it is thoroughly encouraged to get stuck in and try to understand the deeper meaning of pseudo-potentials and learn the differences in basis sets and convergence criteria.
Program Familiarisation
BH3
Boron is the first of the group 3 elements and as such has 3 valence electrons. The borane structure BH3 therefore has 6 valence electrons, meaning that an empty p orbital is present. It is this vacant p orbital which gives BH3 its Lewis acidity.
 |
This section of the module looks at how to familiarise oneself with the use of GaussView and gives an understanding of the basic methods and basis sets used to optimise molecules, generate molecular orbitals and do a frequency analysis.
Optimisation
 |
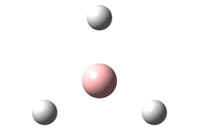
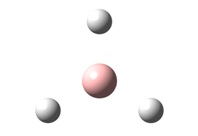
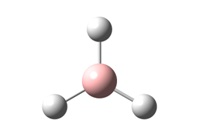
GaussView 5 was used to draw a planar BH3 molecule and all B-H bond lengths were manually set to 1.5Å. The DFT/B3LYP method was employed using a 3-21G basis set to minimise the energy of the molecule. This is the most basic method / basis set combination and is not very accurate at all. It is generally used as a starting optimisation to clean up molecules before they are submitted to more complex, accurate methods. The main advantage of the combination used is the fact that it is not at all time consuming and requires little computational power, which is why it is used in complex molecules as a clean-up tool.
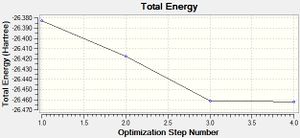
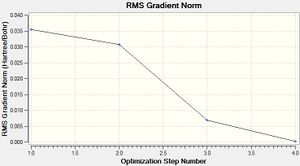
Gaussian uses this method to determine the energy of the BH3 molecule both before and after having moved the nuclear positions of the atoms. If the energy of the molecule is less after having moved the atoms, the calculation starts again from this step until the root mean squared (RMS) gradient of the total molecular energy has reached zero (any gradient less than 0.01 Hartree/Bohr).
|
The optimised molecule has bond lengths of 1.19Å, is trigonal planar in structure and has H-B-H angles of 120°. The molecule starts with an energy of -26.383 a.u. and is optimised to an energy of -26.462 a.u. - This is a decrease in energy of approximately 200 kJ/mol, taking into account the accuracy in the method of ±10 kJ/mol. This is a significant decrease in energy!
Table 1 shows each step in the optimisation process executed by Gaussian and the figures to the right show how the total energy changes during the optimisation and also the change in RMS Gradient of the energy optimisation. The RMS gradient minimises to 0.0002 Hartree/Bohr during the optimisation process and this is seen as sufficiently small to say the energy has been minimised.
The following is an excerpt from the text of the log file which proves that the optimisation reached a minimum. The most important part of the text to note is the bit under "Converged?", which shows that the optimisation steps converged to a minimum RMS gradient. The box below that show the output length, angle and dihedral angle of the optimised molecule.
      Item                 Value      Threshold  Converged?
 Maximum Force            0.000413     0.000450     YES
 RMS     Force            0.000271     0.000300     YES
 Maximum Displacement     0.001610     0.001800     YES
 RMS     Displacement     0.001054     0.001200     YES
 Predicted change in Energy=-1.071764D-06
 Optimization completed.
    -- Stationary point found.
                           ----------------------------
                           !   Optimized Parameters   !
                           ! (Angstroms and Degrees)  !
 --------------------------                            --------------------------
 ! Name  Definition              Value          Derivative Info.                !
 --------------------------------------------------------------------------------
 ! R1    R(1,2)                  1.1935         -DE/DX =    0.0004              !
 ! R2    R(1,3)                  1.1935         -DE/DX =    0.0004              !
 ! R3    R(1,4)                  1.1935         -DE/DX =    0.0004              !
 ! A1    A(2,1,3)              120.0            -DE/DX =    0.0                 !
 ! A2    A(2,1,4)              120.0            -DE/DX =    0.0                 !
 ! A3    A(3,1,4)              120.0            -DE/DX =    0.0                 !
 ! D1    D(2,1,4,3)            180.0            -DE/DX =    0.0                 !
 --------------------------------------------------------------------------------
 GradGradGradGradGradGradGradGradGradGradGradGradGradGradGradGradGradGrad
Molecular Orbital and Natural Bond Order Analysis[1]
MO Analysis
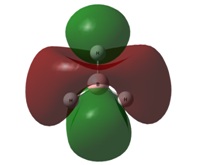
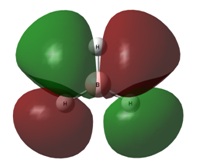
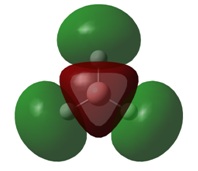
| 1a1' | 2a1' |
 |  |
| 1e' | 1a2" | |
 |  |  |
| 2e' | 3a1' | |
 |  |  |
|
The same method / basis set combination (DFT/B3LYP 3-21G) was used with the parameter pop=full to generate the molecular orbitals of BH3.
Firstly, the energy of the borane molecule was checked post-MO calculation to ensure that the calculation had not altered the molecule in any way. The energy was still -26.462 a.u. and thus it was fine to carry on with the MO analysis.
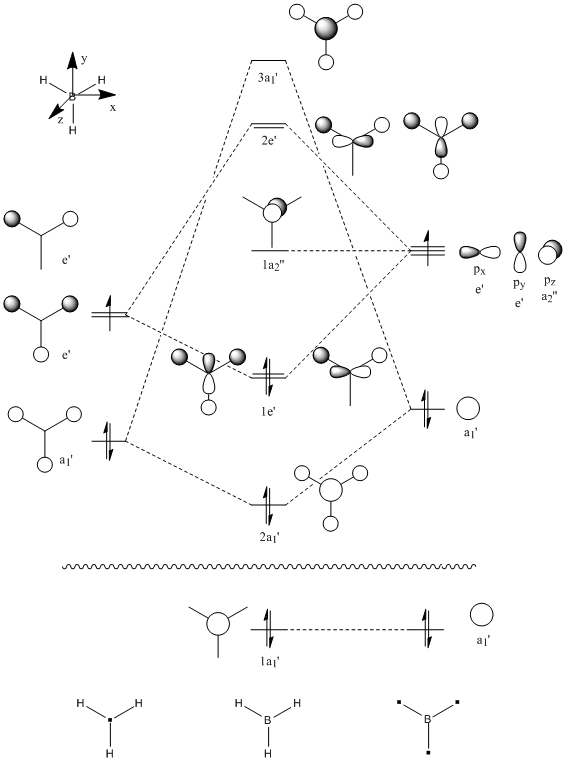
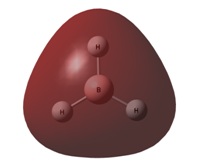
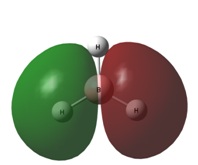
It can be seen by direct comparison of the generated MO diagrams and those predicted by the Linear Combination of Atomic Orbitals approach that they bear a great resemblance to one another. It can be seen that 8 Atomic orbitals combine to give 8 Molecular Orbitals. The ordering of the MOs has been established by looking at the energies generated by Gaussian. The 1a1' orbital corresponds to the boron 1s orbital, which is far too low in energy to interact in any way with the H3 fragment. the 2a1' and 1e' orbitals show the bonding orbitals of the combination of the boron s and p orbitals with the H3 fragment respectively. These three orbitals make up the BH3 bonding orbitals where the 6 valence electrons are situated.
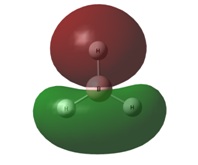
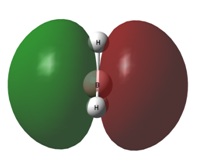
The 1a2" orbital is the empty pz orbital and is non-bonding because its energy is so close to 0 atomic units. It is this orbital which accepts electrons and, because it is non-bonding, it does not destabilise the BH3 molecule by doing so. This orbital is the Lewis acid electron accepting orbital.
The final orbitals, 2e' and 3a1' are the antibonding orbitals. Looking at Table 3, it can be seen that they are both very close in energy to one another and sometimes appear the other way around, with 2e' being the highest in energy. This is arbitrary for the purposes of this course, seeing as a very basic basis set was used. Were a higher accuracy basis set to be used, the differences may become more pronounced.
NBO Analysis
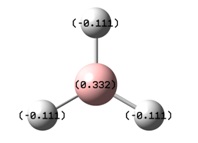
When computationally generating the molecular orbitals of BH3, an additional parameter (Full NBO) was added which made Gaussian calculate the Natural Bond Order (NBO) of the molecule. The results of this additional calculation were observed by looking at the log file from the MO calculation.
The image to the right shows how the charge is distributed throughout the molecule and shows that the boron atom is positive compared to the hydrogen atoms. This indicates that the electron density is skewed to lie more about the hydrogen atoms than the boron. the electron density is equally spread out over all three hydrogen atoms, agreeing with the D3h symmetry. This analysis also confirms the Lewis acidity of the molecule, showing that the boron atom will accept electron density from a donor species.
The NBO analysis also shows that each B-H bond has 33% s character and 66% p character, meaning that each bond is sp2 hybridised. It is also noted that each B-H bond has a 55.52% contribution from the hydrogen atom and a 44.48% contribution from the boron atom, again proving the skew of electron density towards the hydrogen.
The following text extract from the log file shows the data for the bonding NBO analysis talked about above, also showing the 1s core boron orbital (line 4) and the empty boron p orbital (line 5).
(Occupancy)   Bond orbital/ Coefficients/ Hybrids
 ---------------------------------------------------------------------------------
     1. (1.99853) BD ( 1) B   1 - H   2
                ( 44.48%)   0.6669* B   1 s( 33.33%)p 2.00( 66.67%)
                                            0.0000  0.5774  0.0000  0.0000  0.0000
                                            0.8165  0.0000  0.0000  0.0000
                ( 55.52%)   0.7451* H   2 s(100.00%)
                                            1.0000  0.0000
     2. (1.99853) BD ( 1) B   1 - H   3
                ( 44.48%)   0.6669* B   1 s( 33.33%)p 2.00( 66.67%)
                                            0.0000  0.5774  0.0000  0.7071  0.0000
                                           -0.4082  0.0000  0.0000  0.0000
                ( 55.52%)   0.7451* H   3 s(100.00%)
                                            1.0000  0.0000
     3. (1.99853) BD ( 1) B   1 - H   4
                ( 44.48%)   0.6669* B   1 s( 33.33%)p 2.00( 66.67%)
                                            0.0000  0.5774  0.0000 -0.7071  0.0000
                                           -0.4082  0.0000  0.0000  0.0000
                ( 55.52%)   0.7451* H   4 s(100.00%)
                                            1.0000  0.0000
     4. (1.99903) CR ( 1) B   1           s(100.00%)
                                            1.0000  0.0000  0.0000  0.0000  0.0000
                                            0.0000  0.0000  0.0000  0.0000
     5. (0.00000) LP*( 1) B   1           s(100.00%)
Vibrational Analysis[2]
Vibrational calculations take the second derivative of the energy, allowing the user to determine wherther the RMS gradient is at 0 for a minimum or a maximum. For a minimum, the second derivative will be positive and for a maximum the second derivative is negative.
The vibrational analysis was performed one again using the DFT/B3LYP method and 3-21G basis set, and was performed on the pre-optimised structure of BH3.
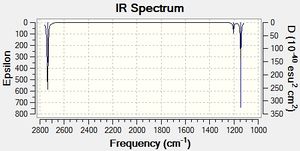
All molecules have 3N degrees of freedom, where N is the number of atoms present in the molecule. 6 of these degrees of freedom are translations and rotations of the molecule[3]. We should therefore see 3N-6 vibrational modes, which, where N=4, means 6 vibrational modes should be observed for BH3.
The 6 vibrations are exhibited in Table 4 below and the IR spectrum is shown to the left.
The IR spectrum only shows 3 peaks, however we know that there are 6 vibrational modes - why is this?
- The vibrations with E' symmetry are degenerate and thus bring the total muber of peaks down to 4.
- Vibrational mode 4 has an intensity of 0. This is due to it being a symmetrical vibration.
Vibrational intensity is related to the dipole moment of the vibration. Symmetrical vibrations such as the B-H stretch in vibration 4 have no overall dipole moment and thus do not show up in IR spectra. The most intense peaks are vibrations 5 and 6 which relate to asymmetric B-H stretches and therefore have a large dipole moment.
|
TlBr3
Thallium bromide TlBr3 is similar to BH3 insofar as it had a D3h symmetry. This section looks into the use of pseudo potentials to optimise the structures of molecules.

Optimisation

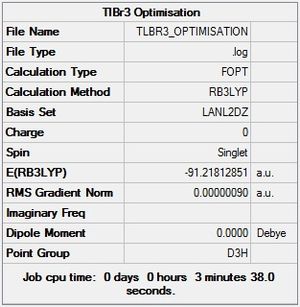 |
Thallium bromide was drawn in GaussView 5 and constrained to D3h symmetry before being optimised using the DFT/B3LYP method and a LANL2DZ basis set. This basis set is used as opposed to the 3-21G basis set because TlBr3 is much larger than BH3 and contains many more electrons. LANL2DZ uses a pseudo-potential for the core electrons rather than looking at each individual electron like the 3-21G basis set would (this would be very time consuming and is only acceptable for molecules like BH3 which contain few electrons).
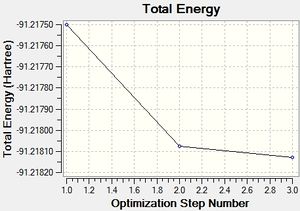
The optimisation gives TlBr3 with a D3h symmetry (Br-Tl-Br angle of 120°[lit.[4] 120°]) and bond lengths of 2.65Å, which is in good agreement with the literature value of 2.51Å[5]. The energy is optimised to -91.2181 a.u. from an initial energy of -91.2175, an energy difference of 1.64 kJ/mol which, when considering the accuracy is ±10 kJmol, is insignificant. The only change in the structure is the reduction in bond length from the initial value of 2.69Å which is, again, insignificant. The optimisation only took 2 steps in this instance, giving a final RMS gradient of 9x10⁻⁷ Hartree / Bohr.
Vibrational Analysis[6]
As with BH3, a vibrational analysis was performed in order to determine whether or not a minimum energy had been found. As before, it is expected that 6 vibrational modes be generated, which would agree with the 3N-6 rule.
The data below shows the 6 translational and rotational frequencies in the top line. The bottom line shows the first three "real" normal modes.
Low frequencies ---   -3.4213   -0.0026   -0.0004    0.0015    3.9367    3.9367
Low frequencies ---   46.4289   46.4292   52.1449
For frequency analysis, the same method and basis set combination as in the optimisation was used. This ensures parity in the results obtained and so using the DTF/B3LYP method and LANL2DZ basis set, the following vibrational modes were obtained:

|
This time only 2 peaks are observed in the IR spectrum, and this is because the E' and A2" vibrations are so similar in energy, thus combining to make 1 small, broad peak.
Dude, where's my bond?!
GaussView 5 often removes bonds where bonds should be present, quite often leading to many confused undergraduates. This leads to the question "What is a bond?".
GaussView 5 removes physical bonds when the distance between two atoms exceeds a pre-programmed distance, which it uses to determine the bond order. GaussView 5 does not seem to recognise that a bond is not merely a line between two atoms, but a sharing of electrons between two or more atoms, leading to a stabilisation of the overall molecule which does not exist in the isolated atoms. It would appear that the pre-determined bond lengths in GaussView 5 were tailored to organic molecules and therefore it omits inorganic bonds which are typically longer than their organic counterparts.
Organometallic Complex
Mo(CO)4L2
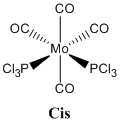
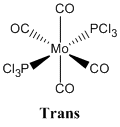
This section looks at the differentiation between cis and trans isomers of a Mo(CO)4L2 species by IR spectrometry (vibrational analysis).
The reason this species is being investigated is because it was synthesised in the second year inorganic synthetic lab course with PPh3 being the ligands. In this course the PPh3 ligands are substituted for chlorine atoms because they are less bulky and also significantly reduce the number of atoms present in the molecule which need to be computed, whilst modelling the PPh3 ligand to a reasonable degree of accuracy.
 |
 |
Optimisation
Both isomers were drawn in GaussView 5 and roughly optimised using the DFT/B3LYP method and a LANL2MB basis set with the convergence set to "loose". Table 5 below shows the total energies of the isomers post-optimisation.
|
The phosphine groups were then rotated such that in the trans complex the ligands were in an eclipsed conformation, with one of the P-Cl bonds eclipsed with a Mo-CO bond. In the trans complex, one of the phosphine ligands had a P-Cl bond with a torsion angle of 0° to a Mo-CO bond, and the other phosphine ligand had a P-Cl bond at 180° to the same Mo-CO bond, as shown below. This was done to avoid obtaining a false minimum during the optimisation steps.
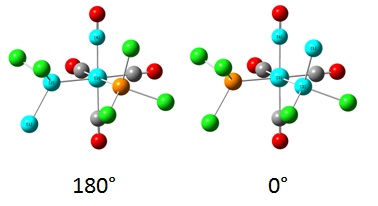
These new geometries were then optimised using a DFT/B3LYP method and LANL2DZ basis set, this time using the keywords "int=ultrafine scf=conver=9". This basis set is much better than the initial basis set used for optimisation and thus tighter convergence criteria are used. The energies of the isomers after this second, more stringent optimisation are shown below in Table 7, along with the RMS gradients and differences in energy compared to the first optimisation.
|
The difference in energy of the two isomers is approximately 3 kJ/mol which, bearing in mind the accuracy of the calculations is ±10 kJ/mol, is almost negligible. The trans isomer is ever so slightly more stable than the cis isomer, probably owing to the steric clash between the bulky phosphine ligands in the cis isomer creating some repulsion which is not present in the trans isomer (because the ligands are on the opposite side of the molecule to one another!).
In order to make the cis isomer more stable in energy than the trans isomer, one would have to incorporate an attractive interaction between the phosphine ligands which could overcome the steric clash. The easiest way to do this would be to replace the chlorine atoms with hydroxy groups, thus creating favourable hydrogen bond interactions.
|
| ||||||||||||||||||||||||||||||||||||||||||||||||||||||||||||||||||||||||||
D-Orbital inclusion
This part of the module looks at the effects of including the low lying d atomic orbitals of the phosphorus atoms in the calculations.
Previosly, the minimal basis sets used did not account for the fact that phosphorus sometimes likes to use its low-lying dAOs in chemical bonding. To incorporate the dAOs, the output file from the second optimisation was opened and then saved as an input file. This newly generated input file was then edited manually in a text editor to include the additional keyword "extrabasis". The following text was also added to the bottom of the input file:
(blank line)
P 0
D  1  1.0
0.55  0.100D+01
****
(blank line)
This file was then submitted to the SCAN cluster for optimisation. Table 8 below shows the resultant energies generated by this optimisation.
|
A stabilisation of approximately 300 kJ/mol is significant and shows that even little changes in computational method can provide vastly varying results.
Vibrational Analysis
Vibrational analysis of the molybdenum complex was performed in order to ascertain whether or not the optimisation had reached a minimum. The 3N-6 rule predicts 45 vibrational modes for the Mo(CO)4(PCl3)2 complex, which there are. Table 9 below shows the first few vibrational modes of each complex, proving that the optimisation converged the energy to a minimum, and also the last 4 vibrational modes of each complex, which correspond to the C=O stretches.
The first two frequencies for each molecule are very low in energy and are actually seen to be rotations of the phosphine ligands about the P-Mo bond. Room temperature (298K) gives about 2.5 kJ/mol of energy, which is roughly 210cm-1. Given that these rotations are all nearly two orders of magnitude less than this energy means that the molecules will be freely rotating at room temperature. Even the first vibrational energy is an order of magnitude less than the energy of room temperature, which means the molecule will also be vibrationally excited to a certain extent.
| ||||||||||||||||||||||||||||||||||||||||||||||||||||||||||||||||||||||||||||||||||||||||||||||||||||||||||||||||||||||||
The computed frequencies only vary by about 50cm-1 from the literature values[19], which is very accurate when considering that the calculation has an error in the frequencies of approximately 10% due to it using a harmonic oscillator to model molecules which follow an anharmonic oscillation. With an error margin of about 200cm-1 it is fantastic to get a frequency to within 50cm-1 of the reported values.
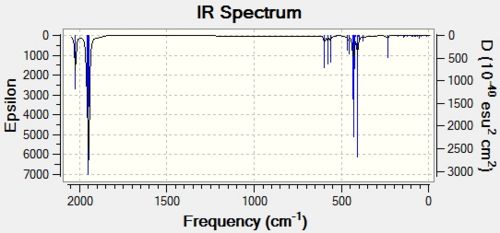
It is these C=O stretches which provide the major distinction between the two isomers because up to this point, the two isomers have had largely similar energies and have as such been almost indistinguishable. The IR spectra provide an unmistakable means of distinguishing between the two isomers.
 |
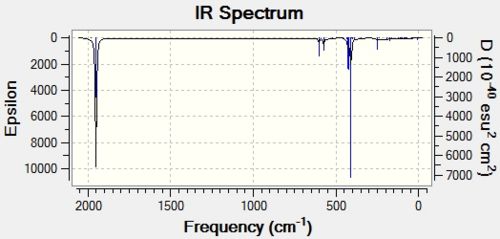 |
It can be seen by simple observation of the IR spectra that the cis isomer has two clearly defined C=O stretching peaks, whereas the trans isomer has only one. This is due to the higher D4h symmetry of the trans isomer, which, during the symmetric C=O stretching, cancels out the dipole moments of each stretch, giving an overall IR intensity of 0. This can be seen by looking at vibrations 44 and 45 of the trans isomers. This symmetry is not maintained in the C2v cis isomer, and so the dipole moments do not cancel one another out, thus giving a seond distinct C=O stretching frequency at a higher energy.
Mini Project
Cyclopentadienyl rings are very versatile in that they can bind to transition metal centres as η1, η3 or η5 ligands. The best known example of cyclopentadienyl ligands forming η5 complexes with a transition metal centre is Ferrocene.

This project looks into the effects that changing the substituents on the cyclopentadienyl ligand have on the bonding between the ligand and the metal centre. Normally these electron withdrawing and donating effects can be observed by a simple geometry analysis of the organometallic complex, seeing whether the metal-ligand bond contracts or elongates.
Seeing as the inclusion of transition metal atoms in calculations performed during this project has been disallowed, this project is instead looking to see whether or not the electron withdrawing / donating effects of the ligands can be predicted and/or observed by methods other than a simple geometry analysis.

Optimisation of cyclopentadienyl ligand
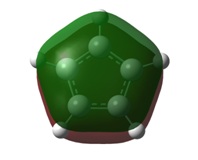
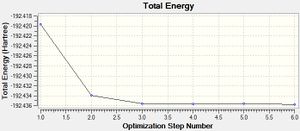
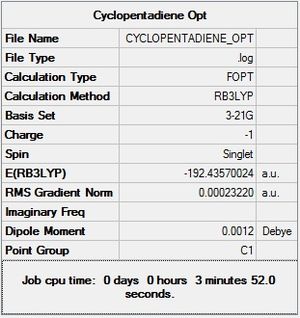
Firstly, cyclopentadiene was taken in GaussView 5 and turned into a cyclopentadienyl ligand by the removal of a hydrogen atom and incorporation of a negative charge. This ring was then optimised using the DFT/B3LYP method and 3-21G basis set. An optimised structure was achieved within 5 steps, producing a cyclopentadienyl ligand with a total energy of -192.436 a.u.

 |
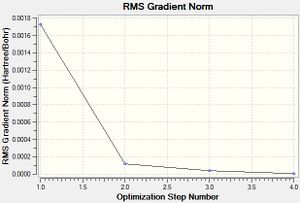
The next step was to run a further, slightly more stringent optimisation using the same method and the basis set 6-31G(d). This optimisation completed within 3 steps and gave a total energy of -193.501 a.u. The log file of the second optimisation can be found here.
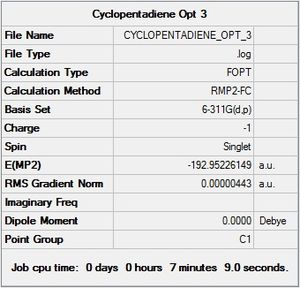
The third and final optimisation was performed using the MP2 method and 6-311G(d,p) basis set. This combination works extremely well for small molecules and is very accurate, so much so that it is used as the basis set in Journal articles. An optimised structure was found within 3 steps and had a total energy of -192.952 a.u.

 |
It was noted in the output summary above that GaussView had not recognised the D5h symmetry of the cyclopentadienyl ligand. It was therefore decided that it would be puissant to check if confining the point group to D5h had any effect on the energy of the molecule. The output file for the optimisation using the MP2 method and 6-311G(d,p) basis set can be found here. It can be seen that the constraint did nothing to affect the energy of the ligand.
It was the output from the third and final (non-constrained) optimisation which was taken and used as the starting point for all further adaptations of the cyclopentadienyl ligand.
All further optimisations were run in two stages:
- DFT/B3LYP 3-21G
- MP2 6-311G(d,p)
Table 12 shows all of the substituted cyclopentadienyl ligands along with their energies post MP2 / 6-311G(d,p) optimisation.
|
Frequency Analysis
For each optimisation, a frequency analysis was performed. A lack of negative vibrations indicates that the energy optimisation had reached a minimum and not a maximum.[30][31][32][33][34][35][36][37][38][39]
Molecular Orbitals
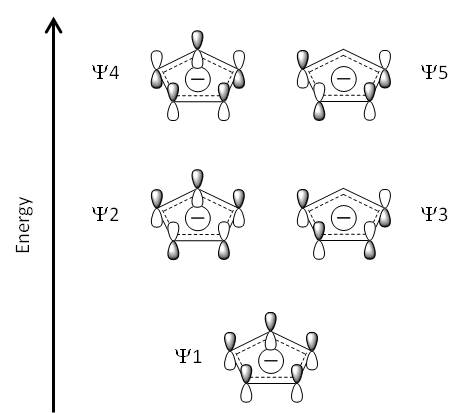
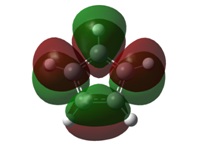
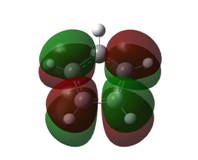
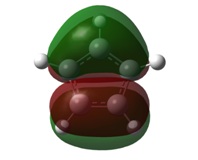
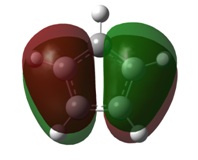
The image below shows the molecular orbitals of the cyclopentadienyl ligand which interact with the d-orbitals on the metal atom, as shown in Nick Long's 3rd Year advanced organometallics lecture course. To the right of the schematic are computational visualisations of the five orbitals, along with their energies. The molecular orbitals were computed[40] using the MP2 6-311G(d,p) method / basis set combination, as per the optimisation. The calculated MOs are in good agreement with the molecular orbitals given in the lecture course.
| |||||||||||||||||||||||||
ψ1-5 are used to represent the molecular orbitals in the cyclopentadienyl ligand. ψ1-ψ3 are bonding orbitals and thus ψ4-ψ5 are antibonding. ψ2 and ψ3 are degenerate MOs, as are ψ4 and ψ5. ψ1, ψ2 and ψ3 are the HOMO-2, HOMO-1 and HOMO respectively, whereas ψ4 and ψ5 are the LUMO+5 and LUMO+6.
Fluorine effects on the MOs
| ||||||||||||||||||||||||||||||||||||||||||
This table shows that, as more fluorine atoms are substituted onto the ring, ψ1-ψ3 become more stabilised than their unsubstituted counterparts , whist ψ4-ψ5 remain roughly similar in energy to their counterparts on the unsubstituted ring.
Another thing to note is that as more fluorine atoms are added to the ring, the ψ4 and ψ5 molecular orbitals become closer to the LUMO and by the time that there are 3 fluorine atoms on the ring, ψ4 and ψ5 are the LUMO+4 and LUMO+2 respectively.
Overall it can be drawn from this MO analysis that as more fluorine atoms are added to the ring, it becomes easier for the metal to donate electons into the cp ligand via backbonding, thus increasing the metal-ligand bond strength.
Methyl effects on the MOs
| ||||||||||||||||||||||||||||||||||||||||||
Analysis of the molecular orbitals of methyl substituted cyclopentadienyl ligands shows that the ψ1-ψ3 molecular orbitals are destabilised slightly with each additional of an extra methyl group. Along with this destabilisation of the bonding orbitals is a stabilisation of the antibonding orbitals. This means that the cp ligand becomes a better electron donor due to the higher HOMO and also a better electron acceptor due to the lower LUMO. Both of these factors combined indicate that overall, the cyclopentadienyl ligand bonds more strongly to the metal when electron donating groups are present as substituents on the ring.
The effects of a trimethylated cyclopentadienyl ligand could not be observed in this case due to heavy mixing in the antibonding orbitals, for which the analysis would have surpassed the level of this module.
NBOs
The table below contains images of the NBO charge distributions amongst the atoms in the variously substituted cyclopentadienyl rings. It can be seen that the more fluorine substituents the ring posesses, the less electron density is within the ring itself. This is indicative of the electron withdrawing nature of the fluorine atoms. This would also indicate that the ring has become a better electron acceptor from having a reduced electron density about it. This would increase the amount of backbonding from the metal to the ligand, thus strengthening the metal-ligand bond.
|
NBO analysis for the methyl substituted cyclopentadienyl ligands shows the opposite trend to the fluorine substituents. As more methyl groups are added to the ring, electron density is slightly pushed into the ring from the methyl groups. This is to be expected as it agrees with the observation that methyl groups are slightly electron donating. The donation of electron density into the cyclopentadienyl ring would lengthen and thus weaken the metal-ligand bond.
Conclusion of the mini-project
Overall, it would appear that it is not possible, given the methods taught in this module, to predict whether or not a cyclopentadienyl ligand will bond more or less strongly to a metal centre when electron withdrawing or donating substituents are placed on the ring.
Given that the data was computed using the highest available method and basis set combination, one would expect that the data output is to a very high standard of accuracy, and therefore the lack of conclusive evidence can be put down to incorrect analytical methods.
With more time and a higher level of computational power, this project could be taken much further to investigate the effects of mixing observed in the antibonding orbitals of the methyl substituted rings. It would also be good to take a closer look at the effects of different substitution patterns, something which was attempted in this project but aborted due to time constraints.
It was disappointing that the project did not yield any conclusive evidence which could be used to predict how well the cp ligand will bond to a metal centre, however this problem can be avoided in the future, given a lesser time constraint, by incorporating a transition metal atom in the calculation.
Conclusion
In this module the DFT/B3LYP method was used formost, along with a wide variety of basis sets which were carefully selected for each individual molecule to be computed. The 3-21G basis set was used mostly as a clean up tool, used to optimise the structure of the molecule before more stringent basis sets were employed.
Pseudo-potentials such as LANL2DZ were used to optimise structures which had a large number of electrons, which would have taken ages to compute using the 3-21G basis set, as the 3-21G basis set calculates the energy of each individual electron (unsuitable for molecules with many electrons).
The mini-project delved even deeper into more stringent method / basis set combinations such as MP2 / 6-311G(d,p) which were used to compute smaller molecules to a very high level of accuracy.
References
- ↑ BH3 MO Repository DOI:10042/to-7549
- ↑ BH3 Vibrational Analysis Log File
- ↑ Charlotte Williams; Lecture Introduction to Spectroscopy and Characterisation (IS1), Imperial College London, 2008
- ↑ M. Atanasov, D. Reinen, J. Phys. Chem. A, 2001, 105 (22), 5450 DOI:Error: Bad DOI specified!
- ↑ Glaser J., Johansson G.; Acta Chemica Scandinavica, 1982, 36A, 125 DOI:10.3891/acta.chem.scand.36a-0125
- ↑ TlBr3 Vibrations Log File
- ↑ Cis Optimisation 1 Repository DOI:10042/to-7726
- ↑ Trans Optimisation 1 Repository DOI:10042/to-7728
- ↑ Cis Optimisation 2 Repository DOI:10042/to-7729
- ↑ Trans Optimisation 2 Repository DOI:10042/to-7730
- ↑ 11.0 11.1 F. Albert. Cotton, Donald J. Darensbourg, Simonetta. Klein, Brian W. S. Kolthammer; Inorg. Chem., 1982, 21, 294–299 DOI:10.1021/ic00131a055
- ↑ 12.0 12.1 Hogarth G., Norman T.; Inorganica Chimica Acta, 1997, 254, 167-171 DOI:10.1016/S0020-1693(96)05133-X
- ↑ Cis Optimisation D-Orbitals Repository DOI:10042/to-7732
- ↑ Trans Optimisation D-Orbitals Repository DOI:10042/to-7733
- ↑ Trans Frequency Repository DOI:10042/to-7747
- ↑ Cis Frequency Repository DOI:10042/to-7746
- ↑ Trans D Frequency Repository DOI:10042/to-7749
- ↑ Cis D Frequency Repository DOI:10042/to-7748
- ↑ Elmer C. Alyea, Shuquan Song; Inorg. Chem., 1995, 34, 3864–3873 DOI:10.1021/ic00119a006
- ↑ 1F Optimisation Repository DOI:10042/to-7766
- ↑ 13Me Optimisation Repository DOI:10042/to-7771
- ↑ 1Me Optimisation Repository DOI:10042/to-7767
- ↑ 123F Optimisation Repository DOI:10042/to-7772
- ↑ 12F Optimisation Repository DOI:10042/to-7768
- ↑ 123Me Optimisation Repository DOI:10042/to-7773
- ↑ 12Me Optimisation Repository DOI:10042/to-7769
- ↑ 134F Optimisation Repository DOI:10042/to-7774
- ↑ 13F Optimisation Repository DOI:10042/to-7770
- ↑ 134Me Optimisation Repository DOI:10042/to-7775
- ↑ 1F Frequency RepositoryDOI:10042/to-7865
- ↑ 1Me Frequency RepositoryDOI:10042/to-7866
- ↑ 12F Frequency RepositoryDOI:10042/to-7868
- ↑ 12Me Frequency RepositoryDOI:10042/to-7869
- ↑ 13F Frequency RepositoryDOI:10042/to-7870
- ↑ 13Me Frequency RepositoryDOI:10042/to-7871
- ↑ 123F Frequency RepositoryDOI:10042/to-7872
- ↑ 123Me Frequency RepositoryDOI:10042/to-7875
- ↑ 134F Frequency RepositoryDOI:10042/to-7876
- ↑ 134Me Frequency RepositoryTemplate:DOI10042/to-7877
- ↑ Cyclopentadienyl ligand MO repository DOI:10042/to-7762
- ↑ 1F MO Repository DOI:10042/to-7796
- ↑ 1,2F MO Repository DOI:10042/to-7797
- ↑ 1,2,3F MO Repository DOI:10042/to-7798
- ↑ 1Me MO Repository DOI:10042/to-7840
- ↑ 1,2Me MO Repository DOI:10042/to-7804
- ↑ 1,2,3Me MO Repository DOI:10042/to-7805

