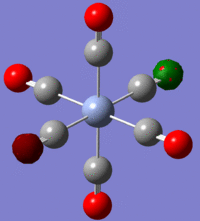
Rep:Mod 2: Celeste van den Bosch
Instructions: Module 2
See also: CvdB Mod:1, CvdB Mod:3
Note: Throughout this wiki page, summaries, scripts and excerpts from .log files have been reported "as is", i.e. no changes to the accuracy of the values have been made; however where these values have been used and where values from other program functions have been reported, an attempt has been made to report these to the correct accuracy.
Exploring
To become familiar with the programs and possibilities in this course on computational analysis of inorganic molecules, two trigonal planar molecules were investigated; namely BH3 and TlBr3.
BH3
Optimisation

The first molecule investigated was borane.
In order to model the minimum energy corresponding to an optimal geometry of BH3, Gaussian 09W and Gaussview 5.0 were used. The script which was created to direct this calculation was:
# opt b3lyp/3-21g geom=connectivity

BH3 optimisation

0 1
 B                 -0.81993568    0.58681670    0.00000000
 H                  0.68006432    0.58681670    0.00000000
etc...
The complete script causes the calculation of the optimum position of the nuclei for a given electronic configuration however the meaning of this script can be "decoded" by breaking this down into its parts[1] [2]:
- opt: optimisation (to find the minimum energy geometry)
- b3lyp: approximations used to solve the Schrodinger equation (a type of DFT [Density Functional Theory] method)
- 3-21g: basis set of low accuracy for inner[3]
- 3(g): basis function which is a combination of three Gaussian primitives
- 21: valence basis functions are split into 2 and 1 parts
- geom: defines the source of specification of the molecule
- connectivity: states that the atom bonding data which has been specified per atom (using the table of data where each atom gets a line of input - shown above as the lines starting with B and H) should be used
- 0: no charge on this molecule
- 1: multiplicity is a singlet state
From the output of this calculation, it was found that the optimised structure of BH3 has H-B-H bond angles of 120.0° and H-B bond lengths of 1.19Å (as shown in the Jmol below). By comparison to a literature value[4] of 1.1900Å it can be concluded that despite using a low accuracy basis set, the results for the optimisation of the structure of BH3 are accurate.
BH3 optimisation |
In order to get some key information about this calculation, a summary can be viewed in GaussView. This summary of the optimisation calculation of BH3 is shown below:
| File Name | BH3_opt |
| File Type | .log |
| Calculation Type | FOPT |
| Calculation Method | RB3LYP |
| Basis Set | 3-21G |
| Charge | 0 |
| Spin | Singlet |
| E(RB3LYP) | -26.46226338 a.u. |
| RMS Gradient Norm | 0.00020672 a.u. |
| Imaginary Freq | |
| Dipole Moment | 0 Debye |
| Point Group | D3H |
| Job cpu time | 0 days 0 hours 0 minutes 33.0 seconds |
As the gradient reported here is less than 0.001 this is a good indication that the optimisation reached completion. In addition the .log output file also shows that the calculation has been completed as all the calculations were recorded as converged:
 Item                     Value        Threshold   Converged?
 Maximum Force            0.000413     0.000450     YES
 RMS     Force            0.000271     0.000300     YES
 Maximum Displacement     0.001610     0.001800     YES
 RMS     Displacement     0.001054     0.001200     YES

 Predicted change in Energy=-1.071764D-06
 Optimization completed.

    -- Stationary point found.
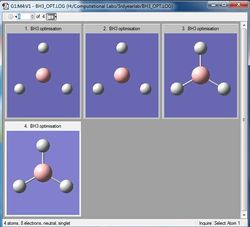
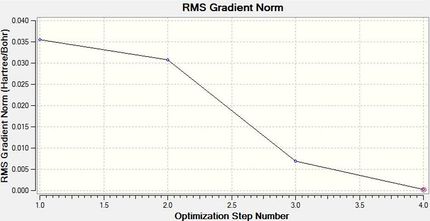
This small gradient can also be viewed in another way by looking at both the optimisation and the RMS plots. These demonstrate how four cycles were used to reach the optimum geometry of borane.
From these it can be seen that the total energy decreases with each successive step as the program calculates an ever better optimisation, which it does by using the gradient. The gradient is expected to get as close to zero as possible because zero indicates that a minimum has been found. As zero could also relate to a maximum or point of inflection, it is important to start with a reasonable structure, and also to note that the method used has some approximations which is uses to determine a reasonable (minimum) structure. Due to these values which are known to Gaussian, the first two steps of this minimisation don't display a 'bond' as the distance between the atoms falls outside the program's set (distance) parameters for bonding.
 |
 |
Vibrational Analysis
Using the fully optimised structure of BH3, a new job was started to analyse frequency. The script used for this was:
# freq b3lyp/3-21g geom=connectivity pop=(full,nbo)

BH3 frequency

0 1
 B                  0.00000000    0.00000000    0.00000000
etc...
In this script the new features and their meanings are[1]:
- freq: job type instead of opt this instruction is for frequency/vibrational analysis
- pop: keyword controlling population analysis and outputs including molecular orbitals and energies, atomic charge distribution and multipole moments (such as dipoles)
- full: includes all orbitals
- nbo: short code for requesting a full Natural Bond Orbital analysis which calculates bonding orbitals with maximum electron density
After the job had run, the summary was viewed:
| File Name | BH3_opt_freq |
| File Type | .log |
| Calculation Type | FREQ |
| Calculation Method | RB3LYP |
| Basis Set | 3-21G |
| Charge | 0 |
| Spin | Singlet |
| E(RB3LYP) | -26.46226338 a.u. |
| RMS Gradient Norm | 0.00020662 a.u. |
| Imaginary Freq | 0 |
| Dipole Moment | 0 Debye |
| Point Group | C3H |
| Job cpu time | 0 days 0 hours 0 minutes 23.0 seconds |
In this instance it is important to note that the energy has remained the same as it was from the optimisation therefore it can be concluded that the molecule this frequency analysis was carried out on has the same geometry as the molecule from the optimisation process which is important for this type of calculation as small changes in the geometry can cause comparatively larger changes in the frequency analysis. In addition, some important data can be collected from the .log output file as well:
Low frequencies ---  -66.7625  -66.3592  -66.3589   -0.0020    0.0031    0.2123
 Low frequencies --- 1144.1483 1203.6413 1203.6424
 Harmonic frequencies (cm**-1), IR intensities (KM/Mole), Raman scattering
 activities (A**4/AMU), depolarization ratios for plane and unpolarized
 incident light, reduced masses (AMU), force constants (mDyne/A),
 and normal coordinates:
                     1                      2                      3
                    A"                     E'                     E'
 Frequencies --  1144.1483              1203.6413              1203.6424
 Red. masses --     1.2531                 1.1085                 1.1085
 Frc consts  --     0.9665                 0.9462                 0.9462
 IR Inten    --    92.8665                12.3148                12.3173
  Atom  AN      X      Y      Z        X      Y      Z        X      Y      Z
     1   5     0.00   0.00   0.16     0.00   0.10   0.00    -0.10   0.00   0.00
     2   1     0.00   0.00  -0.57     0.00   0.08   0.00     0.81   0.00   0.00
     3   1     0.00   0.00  -0.57    -0.38  -0.59   0.00     0.14   0.38   0.00
     4   1     0.00   0.00  -0.57     0.38  -0.59   0.00     0.14  -0.38   0.00
                     4                      5                      6
                    A'                     E'                     E'
 Frequencies --  2598.4249              2737.4364              2737.4371
 Red. masses --     1.0078                 1.1260                 1.1260
 Frc consts  --     4.0092                 4.9714                 4.9714
 IR Inten    --     0.0000               103.7400               103.7333
Here it is important to note that the largest of the low frequencies is approximately 66 cm-1 and this is an order of magnitude smaller than the frequencies associated with the symmetry vibrations (which is important for checking that the calculation to run properly). However, 66 cm-1 is still fairly large as a low accuracy method (3-21g) was used and if a more accurate method were to be employed, this value would be much smaller since the more accurate these calculations, the closer to zero the low frequency values will be as they are related to the -6 of 3N-6 vibrational frequencies which each molecule has.
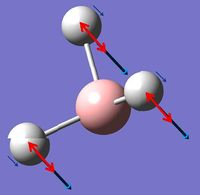
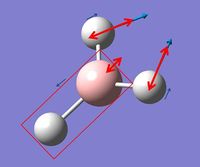
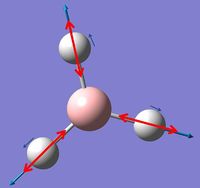
In GaussView these vibrations can also be viewed and the table below summarizes these findings:
The vibrational motion has been described in the table above as well as being assigned a symmetry label and a picture of the motion has also been included. In the images red arrows are used to show overall motion of the individual atoms within each vibrations with an indication of the relative sizes of the motion and the small blue arrows are used to show direction only of one individual vibration. It can be noted that in the excerpt from the .log file above for low frequencies symmetry labels are mentioned however these are for C3h symmetry as opposed to D3h symmetry as that was the symmetry assigned by Gaussian during the calculation.
This data can also be displayed as an IR spectrum:
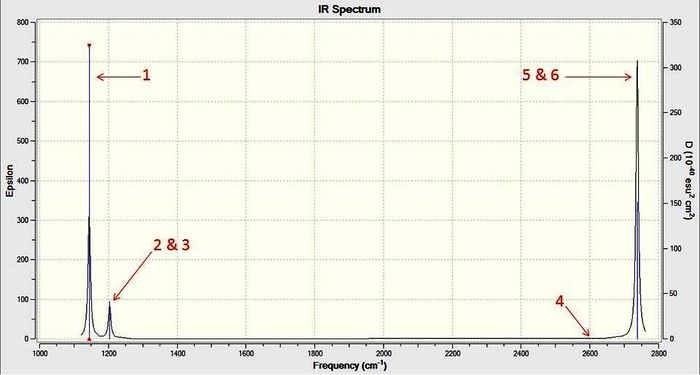
For the IR spectrum of borane there are only three peaks while there are six vibrations. This spectrum has been annotated using the numbering from the vibrational summary table. From the table and spectrum it can be seen that one peak (4) has an intensity of zero due to it being completely symmetric and therefore IR inactive while two sets of peaks (2&3 and 5&6) are degenerate as they have the same symmetry.
Orbital Analysis
Starting with the formatted checkpoint file from the original optimisation of borane, a new job was setup with the following script (no frequency or optimisation terms as this job was classified as an 'energy' job):
# b3lyp/6-31g pop=(nbo,full) geom=connectivity

BH3 energy

0 1
 B                  0.00000000    0.00000000    0.00000000
etc...
The results for this calculation have been uploaded to D-space: DOI:10042/to-9555
Using the output formatted checkpoint file the orbitals of borane were viewed and these have been summarized on the MO diagram of BH3 below:
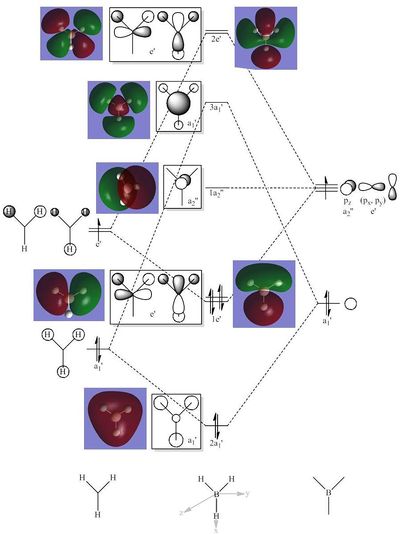
Comparing the calculated molecular orbitals with LCAOs which were used constructed using the MO diagram it can be concluded that the calculation used is a fairly good approximation as the gaussian molecular orbitals look quite similar to the predictions from the linear combination. This is expected as this is a fairly simple molecule and there is no mixing therefore the LCAO is a good representation of the expected molecular orbitals which can be easily compared to the MOs generated by computational methods.
In addition, it is possible to carry out a NBO analysis using the output .log file from the population analysis. Several key excerpts from the .log file are shown below:
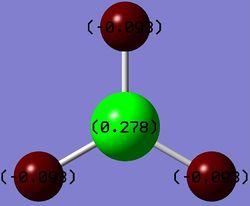
Summary of Natural Population Analysis:

                                       Natural Population
                Natural  -----------------------------------------------
    Atom  No    Charge         Core      Valence    Rydberg      Total
 -----------------------------------------------------------------------
      B    1    0.27816      1.99954     2.72230    0.00000     4.72184
      H    2   -0.09272      0.00000     1.09256    0.00015     1.09272
      H    3   -0.09272      0.00000     1.09256    0.00015     1.09272
      H    4   -0.09272      0.00000     1.09256    0.00015     1.09272
 =======================================================================
   * Total *    0.00000      1.99954     6.00000    0.00046     8.00000
The values under natural charge correspond to the charges shown on the diagram right of borane(where green is highly positively charged and red is highly negatively charged).
(Occupancy)   Bond orbital/ Coefficients/ Hybrids
 ---------------------------------------------------------------------------------
     1. (1.99854) BD ( 1) B   1 - H   2
                ( 45.36%)   0.6735* B   1 s( 33.33%)p 2.00( 66.67%)
                                            0.0000  0.5774  0.0000  0.0000  0.0000
                                            0.8165  0.0000  0.0000  0.0000
                ( 54.64%)   0.7392* H   2 s(100.00%)
                                            1.0000  0.0001
     2. (1.99854) BD ( 1) B   1 - H   3
                ( 45.36%)   0.6735* B   1 s( 33.33%)p 2.00( 66.67%)
                                            0.0000  0.5774  0.0000  0.7071  0.0000
                                           -0.4082  0.0000  0.0000  0.0000
                ( 54.64%)   0.7392* H   3 s(100.00%)
                                            1.0000  0.0001
     3. (1.99854) BD ( 1) B   1 - H   4
                ( 45.36%)   0.6735* B   1 s( 33.33%)p 2.00( 66.67%)
                                            0.0000  0.5774  0.0000 -0.7071  0.0000
                                           -0.4082  0.0000  0.0000  0.0000
                ( 54.64%)   0.7392* H   4 s(100.00%)
                                            1.0000  0.0001
     4. (1.99954) CR ( 1) B   1           s(100.00%)
                                            1.0000  0.0000  0.0000  0.0000  0.0000
                                            0.0000  0.0000  0.0000  0.0000
     5. (0.00000) LP*( 1) B   1           s(100.00%)
etc...
This data shows the NBO analysis partition of electron density of the whole borane molecule into orbitals and then forms 2e-2c bonds. From this it can be seen that the boron atom contributes 45.36% to each of the B-H bonds. Further the character of the orbitals can be read from this data - for instance the hydrogen atoms all have 100% s-character while boron has been sp2 hybridised (shown by having a third s-character and two thirds p-character).
Second Order Perturbation Theory Analysis of Fock Matrix in NBO Basis

     Threshold for printing:   0.50 kcal/mol
                                                                              E(2)  E(j)-E(i) F(i,j)
         Donor NBO (i)                     Acceptor NBO (j)                 kcal/mol   a.u.    a.u.
 ===================================================================================================

 within unit  1
   4. CR (   1) B   1                / 10. RY*(   1) H   2                    0.70    7.42    0.064
   4. CR (   1) B   1                / 11. RY*(   1) H   3                    0.70    7.42    0.064
   4. CR (   1) B   1                / 12. RY*(   1) H   4                    0.70    7.42    0.064
From this table it can be seen that there is no (significant) mixing in borane as none of the energy values are greater than 20 kcal/mol.
TlBr3
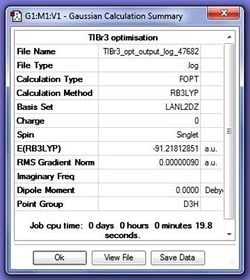
A TlBr3 molecule was drawn in GaussView and the symmetry was restricted (D3h, very tight) and then submitted for optimisation using the script:
# opt b3lyp/lanl2dz geom=connectivity
The key difference between BH3 and TlBr3 in terms of optimisation analysis is the difference in the size of the atoms involved. As TlBr3 are much heavier (3rd and 7th row elements), a pseudo-potential needs to be engaged. For this calculation the method chosen was b3lyp and the basis set used was lanl2dz (D95V on first row, Los Alamos ECP plus DZ on Na-La, Hf-Bi)[1].
The optimised structure has been uploaded to D-space at: DOI:10042/to-9719
TlBr optimisation |
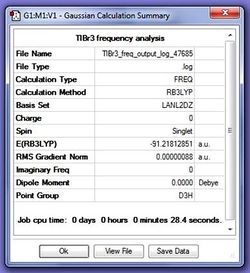
From the optimised structure it was found that the optimised Tl-Br bond distance was 2.65Å and the optimised Br-Tl-Br bond angle was 120°. A literature [5] was found to be 2.52Å therefore it can be concluded that this calculated value is very reasonable.
In order to make sure that a minima was found, a frequency analysis was carried out using the following script:
# freq b3lyp/lanl2dz geom=connectivity pop=(full,nbo)
The result of this calculation was uploaded to D-space at: DOI:10042/to-9720
A frequency analysis can be used to determine if a minima was found because it can be treated as a parallel for finding a second derivative of the potential energy surface. Since all the frequencies are positive values this proves that a minima was found. For this it is important that the same method and basis set are used for both calculations so that the data from these can be compared. For instance it is possible to check that the optimisation has not changed from during the frequency analysis as the energy is the same in both summaries.
The "low frequencies" (first row) and lowest "real" normal modes (second row) for TlBr3 are:
Low frequencies ---   -3.4213   -0.0026   -0.0004    0.0015    3.9367    3.9367
 Low frequencies ---   46.4289   46.4292   52.1449
 Harmonic frequencies (cm**-1), IR intensities (KM/Mole), Raman scattering
 activities (A**4/AMU), depolarization ratios for plane and unpolarized
 incident light, reduced masses (AMU), force constants (mDyne/A),
 and normal coordinates:
                     1                      2                      3
                    E'                     E'                     A2"
 Frequencies --    46.4289                46.4292                52.1449
 Red. masses --    88.4613                88.4613               117.7209
 Frc consts  --     0.1124                 0.1124                 0.1886
 IR Inten    --     3.6867                 3.6867                 5.8466
The largest low frequency is approximately 4 cm-1 which reasonable as this is an order of magnitude smaller than the low frequencies associated with the symmetry vibrations and is reasonably small (though of course if a more accurate method were to be used these values would likely be even closer to zero).
Note: Sometimes GaussView does not draw a bond where one is expected, however that does not mean that there is no bond there. Since GaussView draws bonds based on preset distance criteria they can be considered a structural convenience and therefore are not always present where expected. This is especially true for inorganic molecules as gaussian's internal list of bond lengths are mainly setup for organic compounds. A bond can be defined as an attraction between atoms which can be caused by electromagnetic forces such as dipoles, van der Waal's forces or the charges species that result from electron sharing in covalent bonding or the transfer of electrons in ionic bonding.[6] Alternatively a bond can be considered in terms of orbital overlap and be defined as occurring when orbitals of atoms have a good overlap.
Organometallic Complex
Two isomers of [Mo(CO)4(PPh3)2] were investigated in terms of structure and spectral character. Since PPh3 is a computationally demanding ligand, the phenyl groups were replaced with Cl atoms which have been shown to have similar contributions to the bonding (in terms of electronics) as triphenylphosphine.
Optimisation
The two isomers were drawn in Gaussview and optimised to a low accuracy level using the following script (where lanl2mb is a low level basis set which uses STO-3G on first row, Los Alamos ECP plus MBS on Na-La, Hf-Bi[1]):
# opt=loose b3lyp/lanl2mb geom=connectivity
The summaries for these initial optimisations of the two isomers are shown below:
| File Name | cisIsomer_opt_output_log_47109 | transIsomer_opt_output_log_47111 |
| File Type | .log | .log |
| Calculation Type | FOPT | FOPT |
| Calculation Method | RB3LYP | RB3LYP |
| Basis Set | LANL2MB | LANL2MB |
| Charge | 0 | 0 |
| Spin | Singlet | |
| E(RB3LYP) | -617.52501012 a.u. | -617.52198654 a.u. |
| RMS Gradient Norm | 0.00028589 a.u. | 0.00116804 a.u. |
| Imaginary Freq | ||
| Dipole Moment | 8.4926 Debeye | 0 Debye |
| Point Group | C1 | CI |
| Job cpu time: | 0 days 0 hours 10 minutes 44.6 seconds. | 0 days 0 hours 3 minutes 40.0 seconds. |
| File | File:CisIsomer opt output log 47109.out | File:TransIsomer opt output log 47111.out |
| Image | 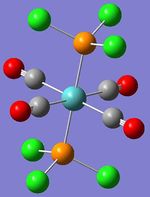 |
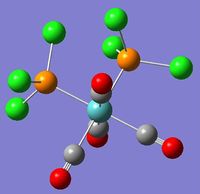 |
It is interesting to note that unlike the two previous molecules, the cis isomer has a dipole (however the trans isomer does not), as expected due to symmetry. Similarly to previous jobs, the reported gradients are smaller than 0.001 a.u. which suggests that these optimisations were completed successfully. Further proof of this was found in the log output files of which excerpts are shown below; stating that the calculations converged:
''Cis Isomer Initial Optimisation Extract from *.log file''
 Item                     Value        Threshold   Converged?
 Maximum Force            0.000714     0.002500     YES
 RMS     Force            0.000192     0.001667     YES
 Maximum Displacement     0.009871     0.010000     YES
 RMS     Displacement     0.003501     0.006667     YES

 Predicted change in Energy=-4.775146D-06
 Optimization completed.

    -- Stationary point found.
''Trans Isomer Initial Optimisation Extract from *.log file''
 Item                     Value        Threshold   Converged?
 Maximum Force            0.002348     0.002500     YES
 RMS     Force            0.000654     0.001667     YES
 Maximum Displacement     0.009736     0.010000     YES
 RMS     Displacement     0.003581     0.006667     YES

 Predicted change in Energy=-6.241574D-06
 Optimization completed.

    -- Stationary point found.

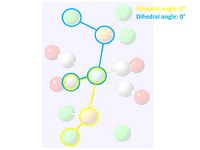
These two initial optimisations were then edited to a better position for the fine optimisation so that the global minima could be found. To do this bonds were drawn back in so that the whole PCl3 groups could be rotated, using the dihedral angle function. The diagrams right show how the two loose optimisations were manipulated and below is the script used for this second optimisation:
# opt b3lyp/lanl2dz geom=connectivity int=ultrafine scf=conver=9
The summary of results from this second optimisation are summarized in the table below:
| File Name | cisIsomer_opt_2_output_log_47139 | transIsomer_opt_2_output_log_47144 |
| File Type | .log | .log |
| Calculation Type | FOPT | FOPT |
| Calculation Method | RB3LYP | RB3LYP |
| Basis Set | LANL2DZ | LANL2DZ |
| Charge | 0 | 0 |
| Spin | Singlet | Singlet |
| E(RB3LYP) | -623.57707194 a.u. | -623.57603101 a.u. |
| RMS Gradient Norm | 0.00000577 a.u. | 0.00003244 a.u. |
| Imaginary Freq | ||
| Dipole Moment | 1.3101 Debye | 0.3049 Debye |
| Point Group | C1 | C1 |
| Job cpu time | 0 days 1 hours 4 minutes 59.5 seconds. | Job cpu time: 0 days 0 hours 46 minutes 2.6 seconds. |
| D-Space Link | DOI:10042/to-9562 | DOI:10042/to-9563 |
In addition the data showing that the optimisations were completed and converged are below:
''Cis Isomer Second Optimisation Extract from *.log file''
 Item                     Value        Threshold   Converged?
 Maximum Force            0.000023     0.000450     YES
 RMS     Force            0.000005     0.000300     YES
 Maximum Displacement     0.001471     0.001800     YES
 RMS     Displacement     0.000429     0.001200     YES

 Predicted change in Energy=-6.570591D-06
 Optimization completed.

    -- Stationary point found.
''Trans Isomer Second Optimisation Extract from *.log file''
 Item                     Value        Threshold   Converged?
 Maximum Force            0.000087     0.000450     YES
 RMS     Force            0.000021     0.000300     YES
 Maximum Displacement     0.001726     0.001800     YES
 RMS     Displacement     0.000252     0.001200     YES

 Predicted change in Energy=-9.797528D-06
 Optimization completed.

    -- Stationary point found.
Both the trans and cis isomers from this second optimisation have a dipole moment; the trans isomer having lost its CI symmetry as both PCl3 groups were set to be eclipsed before the second optimisation.
In addition it is important to note that the energy has decreased which suggests that this second optimisation was successful in reaching a lower (likely global) minima than the initial optimisation.
Frequency
A frequency analysis was then carried out on the optimised structures (from the second optimisation) using the following script:
# freq b3lyp/lanl2dz geom=connectivity int=ultrafine scf=conver=9
The summaries of these two frequency analysis calculations are:
| File Name | trans_2_freq_output_log_47204(2) | cis_2_freq_output_log_47205 |
| File Type | .log | .log |
| Calculation Type | FREQ | FREQ |
| Calculation Method | RB3LYP | RB3LYP |
| Basis Set | LANL2DZ | LANL2DZ |
| Charge | 0 | 0 |
| Spin | Singlet | Singlet |
| E(RB3LYP) | -623.57603101 a.u. | -623.57707194 a.u. |
| RMS Gradient Norm | 0.00003255 a.u. | 0.00000573 a.u. |
| Imaginary Freq | 0 | 0 |
| Dipole Moment | 0.3049 Debye | 1.3101 Debye |
| Point Group | C1 | C1 |
| Job cpu time | 0 days 0 hours 27 minutes 28.8 seconds. | 0 days 0 hours 31 minutes 3.8 seconds. |
| D-Space Link | DOI:10042/to-9564 | DOI:10042/to-9565 |
As all the frequencies from these calculations were found to be positive it is possible to conclude that energy minima were found for these two isomers which allows these structures to be further investigated further with respect to various aspects including geometry, energy and vibrations.
| cis Isomer | trans Isomer | ||||||
|
|
Geometry
In GaussView (and Jmol applets as seen above) it is possible to determine bond angles and bond distances:
| Bond Lengths | cis | trans | Literature |
| Mo - P / Å | 2.51 | 2.45 | 2.462 (M-PMe3)[7] |
| Mo - C / Å | 2.06 (ax) & 2.01 (eq) | 2.06 | 2.109 (Mo-C(=R))[8] |
| C = O / Å | 1.17 (ax) & 1.18 (eq) | 1.17 | 1.21 (C=O)[9] |
From the comparison of the bond distances to literature values it can be seen that the bond lengths calculated fall within a reasonable range suggesting that the isomer have been optimised to reasonable structures.
| Bond Angles | cis | trans |
| P-Mo-P / ° | 94.2 | 177.4 |
| P-Mo-C / ° | 89.4 | 90.0 |
| C-Mo-C / ° | 87.1 ('cis') & 178.4 ('trans') | 89.5 |
In the cis isomer different lengths and angles are expected as having the ligands in a cis conformation causes there to be two different 'environments' for the ligands. It is interesting to note that in the bond distances that are associated with axial ligands are similar to bond distances that were determined for the trans isomer. In the trans isomer there is only one 'environment' where the PCl3 ligands assume the axial positions and the carbonyls are positioned along the equatorial positions. As expected the bond angles also highlight these differences in structure. The trans structure was expected to have all angles either 90° or 180° and it was found that the calculated values were very close to this expectation. Correspondingly the dipole moment also reflects the greater symmetry of the trans (0.305 Debye) than the cis (1.310 Debye) isomer as a greater dipole represents a greater differences in charge across a molecule.
Energy
Using the conversion factor that: 1 a.u. = 1 hartree = 2625.50 kJ mol-1, the relative energies of the two isomers can be calculated as they were created using the same method/basis sets and as a result their energies are comparable. For the cis isomer the energy is -1.637202x10⁶ kJ mol-1 and for the trans isomer this is -1637199x106 kJ mol-1. This is a difference of only 3 kJ mol-1 which falls within the error of the energy term. If one isomer were to have a lower energy it would be the more stable structure. However in this instance it is not possible to determine (from these values) which isomer is more stable. Due to sterics the trans isomer is expected to be more stable since the large PPh3 (or PCl3) groups are furthest from each other. To make the cis form more favourable it would be necessary to reduce the size of these ligands.
IR spectra
Cis and trans isomers of [Mo(CO)4(L)2] are known to be distinguishable using infrared spectroscopy in the region 2100-1750 cm-1. Without knowledge of symmetry a frequency is expected for each metal ligand bond, however due to symmetry there are degenerate motions since the cis and trans isomers belong to the C2v and D4h point groups respectively (assuming point ligands).
For the cis isomer the irreducible representation, corresponding to its C2v symmetry is: ΓIR = 2A1 + B1 + B2 with each of these components associated with a vibration. For the trans isomer the irreducible representation is: ΓIR = A1g + B1g + Eu however only the Eu component is IR active. Therefore the cis isomer is expected to have four CO vibrations and the trans isomer only one.[10] The calculated vibrational data for these two isomers can be compared to that of an experiment carried out in Year 2 Spring Labs 2010-2011[11].
For the cis isomer these four vibrations are summarized in the table below along with annotated spectra:
| cis | Computational Vibrations / cm-1 | Experimental Vibrations / cm-1 |
| Image | 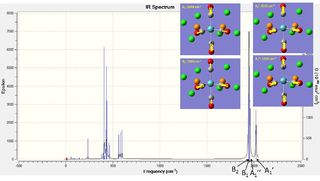 |
 |
| A1' | 2023 (± 202) | 2012 |
| A1'' | 1958 (± 196) | ~1920 |
| B1 | 1949 (± 195) | ~1895 |
| B2 | 1945 (± 195) | 1868 |
The computer generated and experimental spectra are very similar in form having the same peaks with similar intensities. Especially with respect to the CO vibrations which are in question the A1' frequency stands apart from the other three frequencies in both spectra. Additionally, taking into account the 10% systematic error, the calculated values fall well within a reasonable range, having absolute differences between 11-77 cm-1.
The vibrations for the trans isomer are summarized in the table below including annotated spectra:
| trans | Computational Vibrations / cm-1 | Experimental Vibrations / cm-1 |
| Image |  |
 |
| Eu | 1950 & 1951 (± 195) | 1889 |
For the trans isomer one peak is expected on the IR spectrum as the only IR active mode is Eu which is associated with an asymmetric stretch of two trans carbonyl groups. In the experimental data only one peak was observed as expected however Gaussian calculated two peaks. It must be noted that these two peaks are extremely close to each other and that they could conceivably be thought of as one peak as the difference between them is so small compared to the systematic error. However the reason that two peaks have been calculated is likely due to the additional asymmetry that the PCl3 ligand brings to this complex. The symmetry labels were assigned based on point ligands however that is clearly not the case therefore the two assymetric Eu stretches were calculated to be slightly different. In this case the experimental and computational data is again very similar and the absolute difference (61-62 cm-1) falls within the systematic error.
Mini Project

During first, second and third year lectures, a common picture which is shown is the bonding picture of metal carbonyl complexes (left) where the metal-carbonyl bond is built up of OC->M σ-donation and OC<-M π-backbonding. This bonding picture helps us understand what happens when the different components change in magnitude (for instance the back donation increases) and is known to be associated with the frequency of the carbonyl vibration.

From theory it has been suggested that with relatively less backbonding there will be a higher ν(CO), corresponding to a strong C-O bond, than for a complex with relatively more backbonding, corresponding to a strong M-C bond, as more electron density is between the M-C bond and less between the C-O bond.
This project will look at three metal carbonyl complexes from the first row of transition metals in the complexes: [Ti(CO)6]2-, [Cr(CO)6] and [Fe(CO)6]2+ by first creating optimisised structures and then using these for frequency and molecular orbital analysis.
Optimisation
For the complexes being studied in this project it was necessary to use pseudo-potentials for the metal. Therefore all input files were edited according. An example of the generic script used for the optimisation is (where M = Ti, Cr, Fe and n = -2, 0, +2 for the actual calculations carried out for this project):
# opt(maxcycle=50) b3lyp/gen geom=connectivity pseudo=cards gfinput

[M(CO)6] Optimisation using pp and basis sets

n 1
 M                 -0.00000000    0.00000000   -0.00000000
 C                  0.00000000    0.00000000    1.90000000
 C                  0.00000000    1.90000000    0.00000000
 C                  1.90000000    0.00000000   -0.00000000
 C                 -0.00000000    0.00000000   -1.90000000
 C                  0.00000000   -1.90000000   -0.00000000
 C                 -1.90000000    0.00000000    0.00000000
 O                  0.00000000    0.00000000    3.01540000
 O                  0.00000000    3.01540000    0.00000000
 O                  3.01540000    0.00000000   -0.00000000
 O                  0.00000000   -3.01540000   -0.00000000
 O                 -3.01540000    0.00000000    0.00000000
 O                 -0.00000000    0.00000000   -3.01540000

 1 2 1.0 3 1.0 4 1.0 5 1.0 6 1.0 7 1.0
 2 8 3.0
 3 9 3.0
 4 10 3.0
 5 13 3.0
 6 11 3.0
 7 12 3.0
 8
 9
 10
 11
 12
 13

M 0
LanL2DZ
****
C O 0
6-31G(d,p)
****

M 0
LanL2DZ
The combination of using gen as the 'basis set' input and the key words pseudo=cards gfinput in the top line with the lines added at the end of the input file direct the calculation to use the pseudo-potential lanl2dz on the metal and the moderate level basis set 6-31G on the carbon and oxygen atoms. Further, to aid the calculation, Ohsymmetry was imposed on all the complexes.

| Compound | Ti | Cr | Fe |
| File Type | .log | .log | .log |
| Calculation Type | FOPT | FOPT | FOPT |
| Calculation Method | RB3LYP | RB3LYP | RB3LYP |
| Basis Set | Gen | Gen | Gen |
| Charge | -2 | 0 | 2 |
| Spin | Singlet | Singlet | Singlet |
| E(RB3LYP) / a.u. | -738.0860344 | -766.3677063 | -802.7495601 |
| RMS Gradient Norm / a.u. | 0.00002032 | 0.00006245 | 0.00015897 |
| Imaginary Freq | |||
| Dipole Moment / Debye | 0 | 0 | 0 |
| Point Group | OH | OH | OH |
| Job cpu time | 0 days 0 hours 7 minutes 21.7 seconds | 0 days 0 hours 5 minutes 3.8 seconds | 0 days 0 hours 4 minutes 8.4 seconds |
| D-Space Link | DOI:10042/to-9658 | DOI:10042/to-9657 | DOI:10042/to-9659 |
From this data it can be seen that a minima was reached for each of these and that was confirmed by looking at the .log files for series of 'converged'. In addition, from looking at the .log files, it was possible to ensure that the symmetry was imposed on these compounds. However it is interesting to note that Gaussian cannot calculate Oh (at the level of calculations used for this project) and therefore uses D2h instead (see excerpt for the Cr complex below).
Stoichiometry    C6CrO6
 Framework group  OH[O(Cr),3C4(OC.CO)]
 Deg. of freedom     2
 Full point group                 OH      NOp  48
 Largest Abelian subgroup         D2H     NOp   8
 Largest concise Abelian subgroup D2H     NOp   8
These files were then used for the frequency and orbital analysis. Once frequency analysis had confirmed that minima were achieved during the optimisation, it was also possible to determine bond lengths for these complexes.
| Computational M - C / Å | Literature M - C / Å | Computational C - O / Å | Jmol | ||||
| Ti | 2.05 | 1.18 |
| ||||
| Cr | 1.92 | 1.15 |
| ||||
| Fe | 1.94 | 1.997[8] | 1.13 |
|
To determine the reliability of the C-O bond lengths these can be compared to the value for free C=O which is 1.21Α[9]. The value found for the Fe complex has an absolute difference of 0.06Α and the values for CO are all within reason when compared to the literature value.
Frequency Analysis
Using the optimised structures a frequency analysis could be carried out. From this it was possible to determine that minima were found for the three compounds as the energies were almost identical and no negative frequencies were obtained. The relevant parts of the summaries are shown below:
| Compound | Ti | Cr | Fe |
| Calculation Type | FREQ | FREQ | FREQ |
| Calculation Method | RB3LYP | RB3LYP | RB3LYP |
| Basis Set | Gen | Gen | Gen |
| Charge | -2 | 0 | 2 |
| Spin | Singlet | Singlet | Singlet |
| E(RB3LYP) / a.u. | -738.0860344 | -766.3677063 | -802.7495601 |
| RMS Gradient Norm / a.u. | 0.0000204 | 0.00006333 | 0.00015943 |
| D-Space Link | DOI:10042/to-9674 | DOI:10042/to-9672 | DOI:10042/to-9673 |
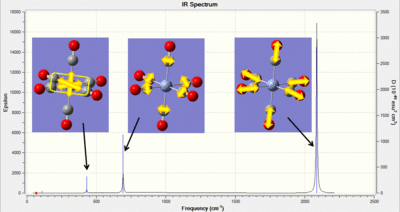
| IR Spectra |  |
 |
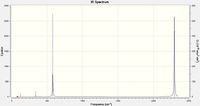 |
In the table above an image of each of the IR spectra are included. For the Cr complex the vibrations associated with the peaks have been indicated. From these computational jobs it is possible to determine both M-C and C-O vibrations. In experimental work it is generally challenging to accurately determine the M-C frequencies as these occur in the fingerprint region. Therefore this type of analysis could be used to look further into the changes in the M-C frequencies. The frequencies have been summarized in the table below and literature values have been found for the C-O stretches:
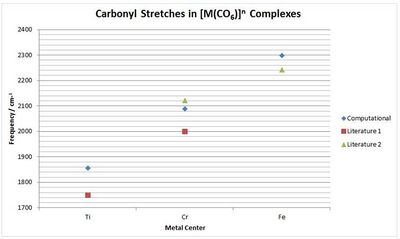
| Compound | Ti | Cr | Fe |
| Computational M-C / cm-1 | 450 | 430 | 339 |
| Computational M-C / cm-1 | 639 | 692 | 580 |
| Computational C-O / cm-1 | 1855 | 2086 | 2297 |
| Literature C-O[12] / cm-1 | 1750 | 2000 | n/a |
| Literature C-O[13]/ cm-1 | n/a | 2119 | 2241 |
To compare the graph right was constructed. This shows that there the calculated frequencies are reasonable and taking into account the 10% systematic error, correspond quite closely to literature values. Therefore it can be concluded that this method is successful in investigating the carbonyl stretch and this data does appear to support the suggestion that an increase in the π-back donation increases the C-O bond length and has a lower carbonyl frequency.
Orbital Analysis
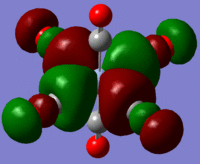
Using the formatted checkpoint files the molecular orbitals were determined for these complexes. Before starting, the MO diagram for ML6 with all σ-donor ligands was thought to be a good place to start for interpreting the orbitals which resulted. However, looking at an MO diagram for just one π-donor ligand it is clear that the actual picture is significantly more complicated.
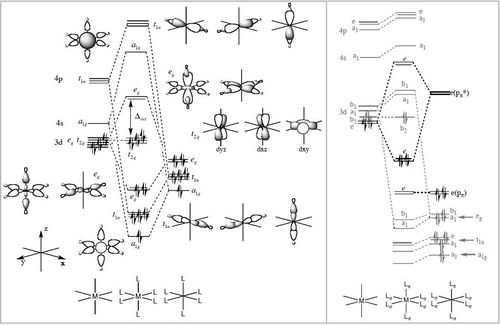
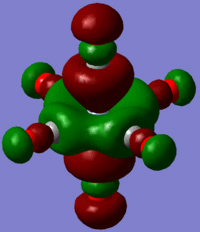
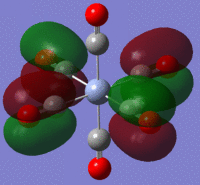
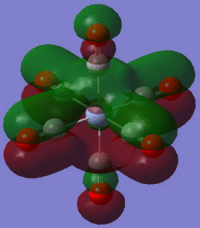
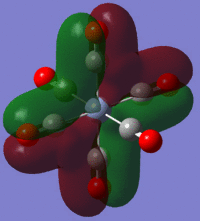
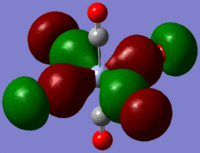
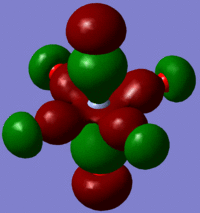
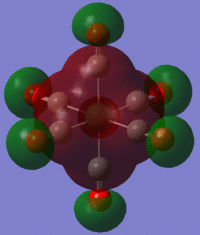
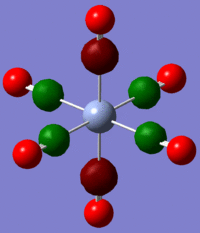
The large table below summarises the occupied MOs which were found along with interpretations. Along the left are screen captures of orbitals. To the right of each picture are between 1-6 descriptions of degenerate orbitals which correspond to the image (numbers link the exact picture with description).In addition tentative symmetry assignments have been made under some of the images. Due to the complexity of these MOs as well as Gaussian's use of D2h instead of Oh, it is not possible to fully assign the symmetry. It can be noted that an attempt was made to interpret the data under 'second order perturbation theory analysis of fock matrix in NBO basis' to determine the extent of mixing however this was again highly complicated due to the size of the system.
The energies of each of these levels can also be compared between the complexes:
| MOs | Energy [Ti(CO)6]2- | Energy [Cr(CO)6] | Energy [Fe(CO)6]2+ |
| 47-49 | 0.147 | -0.257 | -0.712 |
| 44-46 | -0.055 | -0.416 | -0.802 |
| 42-43 | -0.175 | -0.451 | -0.829 |
| 39-41 | -0.110 | -0.460 | -0.835 |
| 36-38 | -0.115 | -0.466 | -0.839 |
| 33-35 | -0.124 | -0.482 | -0.854 |
| 30-32 | -0.126 | -0.485 | -0.856 |
| 29 | -0.138 | -0.508 | -0.879 |
| 27-28 | -0.237 | -0.573 | -0.932 |
| 24-26 | -0.238 | -0.576 | -0.937 |
| 23 | -0.786 | -0.619 | -1.002 |
| 21-22 | -1.107 | -1.152 | -1.534 |
| 17-20 | -1.982 | -1.153 | -1.536 |
| 14-16 | -9.962 | -1.848 | -2.721 |
| 13 | -9.962 | -2.895 | -3.946 |
| 7-12 | -18.893 | -10.321 | -10.701 |
| 1-6 | -18.893 | -19.249 | -19.632 |
| D-Space Link | DOI:10042/to-9871 | DOI:10042/to-9870 | DOI:10042/to-9872 |
These energies are quite large, especially considering that a pseudo-potential was used. The overall pattern of these values follows that of the energy from the optimisation (-738, -766 and -802 a.u.) which is expected because these individual orbitals contribute to the total energy.
Conclusion
This project investigated a series of metal carbonyl complexes with a focus on the vibrational frequency of the carbonyl in IR spectroscopy. The use of this method to look at the degree of back bonding is widely used in research and it was found that this was also computationally possible. The structures were optimised to a reasonable degree with bond lengths comparable to literature. In addition, the results of the calculations for the carbonyl frequencies was closely matched to literature values which were found. This is especially true since these values vary slightly in literature (as seen by the two different sources) and also because there is a 10% systematic error associated with these calculations. In addition, the molecular orbitals were generated and these could also be described to a certain extent based on a simpler σ-donor diagram. As these are highly symmetric complexes, having Oh symmetry, there are few electronic properties which could be investigated. However this and many other properties could be considered by making small changes to the project, resulting in further research.
Further Study
Several ideas of the many ways computational analysis could be used to continue studying this area are outlined below:
- Look at further metals of the same row in order to get a more complete picture and verify that the trend continues as expected.
- Look at a series of metals going down one group and investigate how the properties change as the metal becomes larger and has more electrons.
- The bonding picture of metal carbonyl complexes used is one that is commonly described by the Dewar-Chatt-Duncanson (DCD) model where the π-back donation is the most important factor for binding energy. However recently it has been suggested that the HOMO-LUMO contributions from metal and CO fragments could also have a significant effect with a greater interaction energy between these fragments being correlated with an increase in the stability. As the MOs can be clearly observed using these computational methods, it would be extremely interesting to look into this new suggestion and investigate how the HOMO-LUMO contributions affect the (bond) energy of metal carbonyl complexes and the determination of which bonding component is more important. This could be done by comparing fragments with high lying HOMO, implying that backbonding is the dominant component versus fragments with low lying LUMOs where σ-donation is expected to be more important.[15]
- Investigating the effects of changing one (or more) ligands is also of interest. In the common picture having co-ligands which are good π-acceptors (such as NO, CN- or NO2-) contribute to a higher carbonyl frequency due to competition for electron density, while co-ligands which are good π-donors(such as I-, Br- and SCN-) will have a lower carbonyl frequency. Therefore the completed study and also the additional research routes mentioned above could be extended by changing one of the carbonyl ligands for a series of other ligands. In these cases it would be more interesting to look at the electronics as the complexes will no longer be symmetrical and to see how the MOs change due to having a different ligand(s).
- Further in the study of alternative ligands is the position that the ligand assumes in the complex. It has been suggested from experimental evidence that strong π-acceptors prefer the equatorial position while σ-donors prefer the axial position. The validity of this statement as well as the reasoning behind these preferences would be another engaging area of additional study.
- As M-C bonds can also be clearly viewed using computational methods, it would be possible to analyse the bonding by focusing on this bond as well (instead of the C-O bond which is commonly used as it is clearly visible on IR spectra as its stretching frequency occurs in a region where N-N and N-O stretches are generally the only other vibrations which would also occur in this region)
References
- ↑ 1.0 1.1 1.2 1.3 Gaussian 09 User's Reference
- ↑ GaussView 5 Reference
- ↑ Self-consistent Molecular-Orbital Methods. 22. Small Split-Valence Basis Sets for Second-Row Elements DOI:10.1021/ja00374a017
- ↑ Online CRC Handbook of Chemistry and Physics, 92nd edition, 2012 pp. 9-21
- ↑ Structure of Thallium(III) Chloride, Bromide, and Cyanide Complexes in Aqueous Solution DOI:10.1021/ja00123a011
- ↑ Oxford Dictionary of Chemistry 6th edition, OUP, 2008, pp115-116
- ↑ Online CRC Handbook of Chemistry and Physics, 92nd edition, 2012 pp. 9-18
- ↑ 8.0 8.1 Online CRC Handbook of Chemistry and Physics, 92nd edition, 2012 pp. 9-17
- ↑ 9.0 9.1 Online CRC Handbook of Chemistry and Physics, 92nd edition, 2012 pp. 9-48
- ↑ Infrared determination of sterochemistry in metal complexes: An application of group theory DOI:10.1021/ed047p33
- ↑ Experiment 4S - Identification of Stereochemical Isomers of [Mo(CO)4(L)2] by Infrared Spectroscopy, 28 February 2011
- ↑ 12.0 12.1 3.I3 Advanced Organometallic Chemistry, Year 3 Autumn Lectures, Dr. Wilton-Ely and Dr. Diez-Gonzalez, 2011-2012
- ↑ Dissociation Energies, Vibrational Frequencies, and 13C NMR Chemical Shifts of the 18-Electron Species [M(CO)6]n (M = Hf-Ir, Mo, Tc, Ru, Cr, Mn, Fe) DOI:10.1021/ic970223z
- ↑ Molecular Orbitals in Inorganic Chemistry, Year 2 Autumn Lectures, Dr. P Hunt, 2011-2012, Lecture 8
- ↑ Theoretical Studies of Organometallic Compounds. Ligand Site Preference in Iron Tetracarbonyl Complexes Fe(CO)4L (L = CO, CS, N2, NO+, CN-, NC-, ɳ2-C2H4, ɳ2-C2H2, CCH2, CH2, CF2, NH3, NF3, PH3, PF3, ɳ2-H2) DOI:<985::AID-ZAAC985>3.0.CO;2-# 10.1002/1521-3749(200105)627:5<985::AID-ZAAC985>3.0.CO;2-#

