Rep:Mod:zxcv1234inorganic
Small Molecules
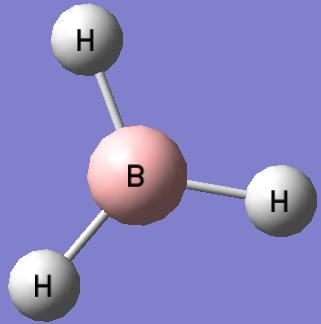
BH3
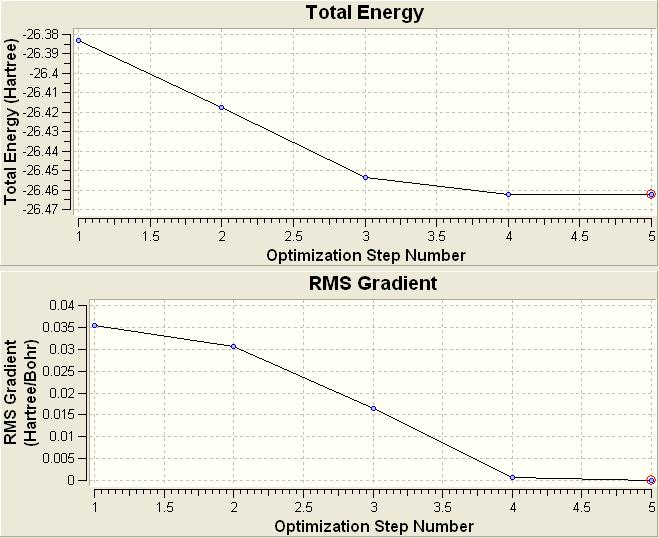
The top graph shows the energy of the system at all points in the optimisation. The optimisation process is a potential energy minimisation and gaussian will make changes to the molecule to find a local energy minima. The graph below is the gradient of energy change. This is a way for the computer to quantify when the energy has been minimised as when the energy does not change between two consecutive iterations then the gradient becomes zero as the energy hasn't changed.
BCl3
 |
|
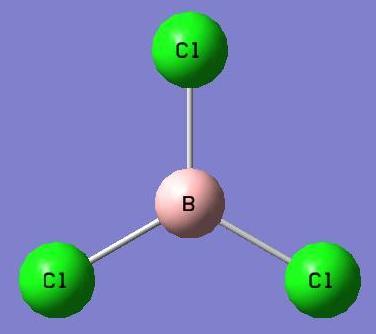
In this calculation pseudo potentials were used on the heavier chlorine atoms. This was done by using the LanL2MB basic set, which uses a medium level basis set on first row elements, in this case the boron, and a Los Alamos ECP on heavier elements, chlorine. The calculated bond length differs to literature[1] slightly, which quotes the B-Cl bond length as 1.75Å.
SF4
SF4was chosen as a small molecule to optimise as it has an interesting geometry and I was wondering how accurately the calculations would predict the asymmetric S-F bonds. Before the calculation was run I had previous knowledge that there should be 2 sets of S-F bonds, 2 axial with longer bonds lengths and 2 equatorial with shorter bonds lengths.
The original output files can be found here... [ http://hdl.handle.net/10042/to-1237] |
|
This calculation has proved a reasonable result in comparison to the literature. The structure is correctly predicted as the distorted saw horse and the bond lengths are quite close to the literature[2], which quotes values of 1.646 and 1.545Å.
Vibrational Analysis of BH3
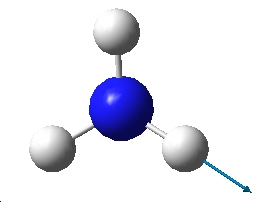
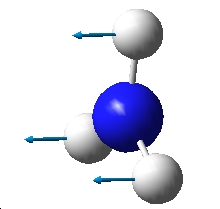
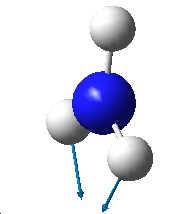
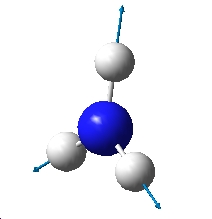
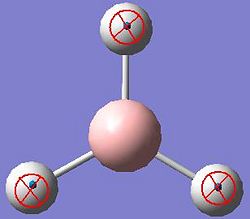
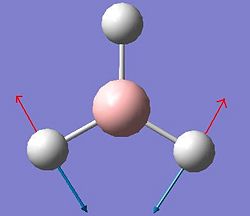
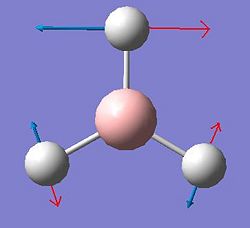
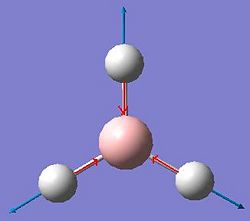
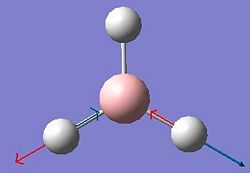
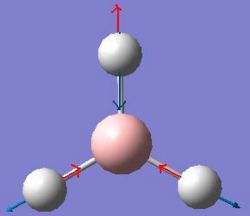
The vibrations of BH3 were calculated using the previous optimised geometry of the start of the project. The frequency calculation was run at the same level using a B3LYP method an a 3-21G basis set. All of the results of those calculated vibrations are shown below.
| Vibration Number | Form of Vibration | Frequency (Hz) |
Intensity | Symmetry D3h Point Group |
|---|---|---|---|---|
 |
||||
 |
||||
 |
||||
 |
||||
 |
||||
 |
The vibrations calculated above can be displayed as an IR Spectrum, which is shown below.
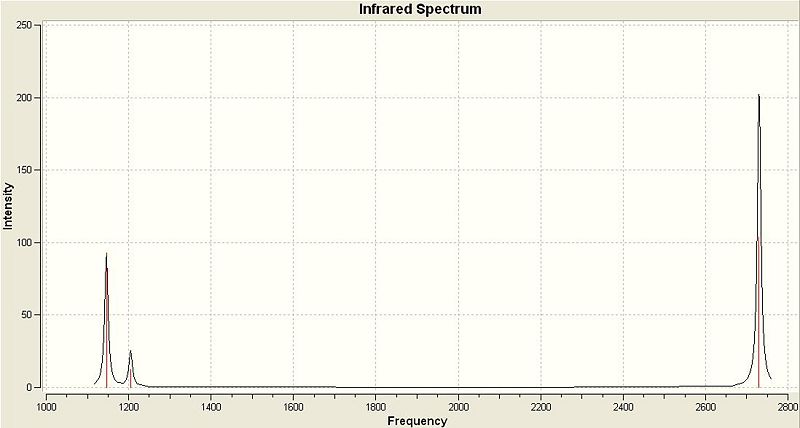
There are 6 vibrations in the table above but clearly only 3 peaks are visible in the IR Spectrum. This is due to 2 reasons, the first being degeneracy of some vibrations and the second being the lack of a change in dipole caused by a vibration.
Looking first at degeneracy there are 2 pairs of vibrations that have the same frequency of vibration, these are vibrations 2 & 3 at 1204.86 Hz and 5 & 6 at 2730.07 Hz. As the are of the same frequency they appear as one peak on the spectrum with an intensity equal to the sum the individual intensities calculated for each. This accounts for the loss of 2 peaks from the IR Spectrum but still leaves 4 unique frequencies of vibration and 3 peaks in the spectrum. Vibration 4 at 2591.65 Hz is absent from the spectrum. This is because this vibrational mode is perfectly symmetric with respect to the distribution of charge. This means that the vibration causes no change in dipole and as a result has an intensity of zero in the IR Spectrum.
Molecular Orbitals of BH3
Predicted Molecular Orbital Diagram
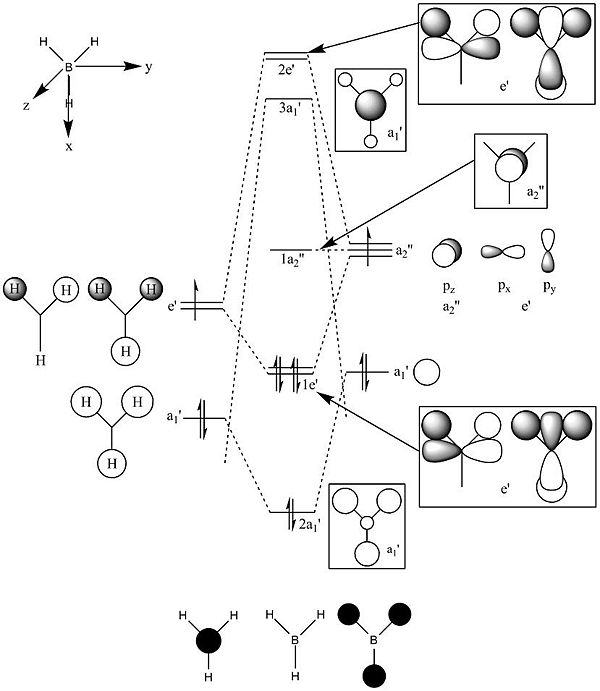
This diagram was drawn on ChemDraw Pro 11.0 as a prediction for the molecular orbitals of BH3.
Calculated Molecular Orbitals
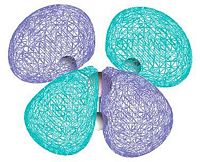
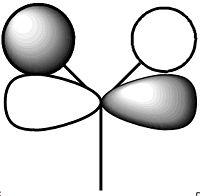
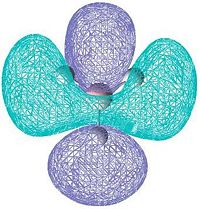
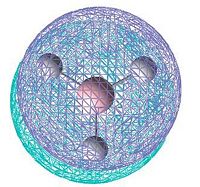
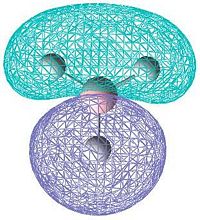
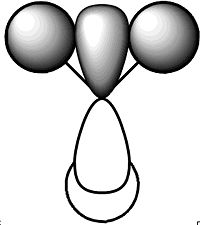
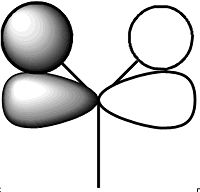
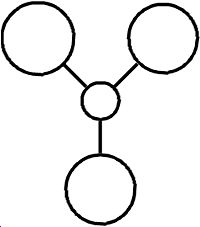
These molecular orbitals of BH3 were calculated using a B3LYP method and a 6-31G basis set with "pop=full" in the additional information to enable MO analysis. Pictures of all the orbitals calculated are shown in the table below along with the predicted diagrams from above next to the corresponding calculated orbitals. The axe are the same as in the predicted MO Diagram.
| MO Number | Calculated | Predicted | Symmetry | Energy |
|---|---|---|---|---|
 |
 |
|||
 |
 |
|||
 |
 |
|||
 |
 |
|||
 |
 |
|||
 |
 |
|||
 |
 |
|||
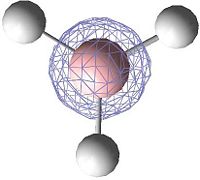 |
Orbital Not Drawn This is the 1s orbital of Boron |
The predicted Molecular Orbital diagram gives an excellent approximation for the calculated, with most of the orbitals looking almost identical. The only orbital that shows significant deviation from prediction is Orbital 7. In the predicted MO picture there is an extra lobe in a p-shaped orbital that disappears in the calculated MO. This lobe would have caused a highly anti-bonding interaction and in the calculated MO this charge has been perhaps been redistributed to overlap with a bonding interaction to the 2 in-phase orbitals to the left and right. Apart from this and perhaps some of the relative sizes of some of the lobes the predicted linear combination approach has provided an very good approximation and really shows the value of simply drawing a prediction. The only information that the prediction cannot give is the relative energies of the orbitals which can be obtained by calculation and are shown above in the table.
Isomers of Mo(CO)4(P(CH3)3)2
Geometry Optimisations
The rough geometries of 2 isomers of this molecule were drawn in gaussview, one of which had the the phosphorous groups in a trans relationship and the other with them in a cis relationship. A loose optimisation was done first using the low level basis set and pseudo-potential LANL2MB and then a higher level LANL2DZ. A third even higher level basis set was used that added d orbitals to the phosphorous groups. The summary of the output files are shown below.
| B3LYP/LANL2MB | B3LYP/LANL2DZ | B3LYP/LANL2DZ extra d orbitals | ||||||||||||||||||||||||||||||||||||||||||||||||
|---|---|---|---|---|---|---|---|---|---|---|---|---|---|---|---|---|---|---|---|---|---|---|---|---|---|---|---|---|---|---|---|---|---|---|---|---|---|---|---|---|---|---|---|---|---|---|---|---|---|---|
|
|
|
Mo Complex Trans-Isomer |
| B3LYP/LANL2MB | B3LYP/LANL2DZ | B3LYP/LANL2DZ extra d orbitals | ||||||||||||||||||||||||||||||||||||||||||||||||
|---|---|---|---|---|---|---|---|---|---|---|---|---|---|---|---|---|---|---|---|---|---|---|---|---|---|---|---|---|---|---|---|---|---|---|---|---|---|---|---|---|---|---|---|---|---|---|---|---|---|---|
|
|
|
Mo Complex Cis-Isomer |
The energy difference between the cis and trans isomer are 2.53 kJ/mol. This seams a pretty reasonable approximation.
Bond Lengths
The bonds that were looked at were the Mo-C, the Mo-P and the CO bonds lengths. The lengths of each of these were compared between both the cis and trans isomers of the Mo Complex and analysed to see if any of the differences or similarities could be rationalised.
| Bond Type | Length in Trans-Isomer (Å) |
Length in Cis-Isomer (Å) |
|---|---|---|
| Mo-C | 2.02993 2.02997 2.02993 2.02993 |
1.99369 (In Plane of P Groups) 1.99370 2.03179 (Perpendicular to P Groups) 2.03180 |
| CO | 1.18926 1.18929 1.18926 1.18929 |
1.19026 (In Plane of P Groups) 1.19026 1.18807(Perpendicular to P Groups) 1.18807 |
| Mo-P | 2.52646 2.52645 |
2.58906 2.58905 |
Looking first at the trans isomer, it can be observed as being very symmetrical with respect to the bond lengths. This is as expected due to the higher level of symmetry of the molecular geometry. The cis isomer has one region for the the phosphorous groups, which is reflected in the almost identical bond lengths of the Mo-P bond. However for the carbonyl ligands there are two different orientations with respect to their position in comparison to the phosphorous groups, the two in the same plane as the phosphorous groups and the two perpendicular to the phosphorous groups. This results in two pairs of Mo-C bond lengths and 2 pairs of CO bond lengths.
CO bonds lengths are a good way to measure the level of back bonding that is occurring at the metal centre. More back bonding increases the electron density in the CO bond and the bond has more triple bond character, this will also result in a higher stretching frequency which will be looked at shortly. Free CO in the atmosphere has a bond length of 0.1128nm.[3] In the cis isomer there is a slight difference in the length of the CO bond pairs. I don't there is much significance here with respect to difference in the level of back bonding between equatorial and axial CO.
Vibrational Spectra
A vibrational analysis of both of the isomers was done using the the highest level optimisation from before. The output are published here...
Trans Isomer
Cis Isomer - Unable to publish
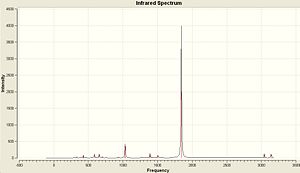
The Vibrational Spectra of the two isomers are shown here.
| Trans Isomer | Cis Isomer |
|---|---|
 |
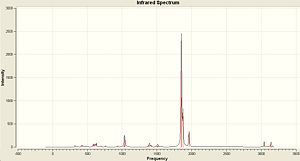 |
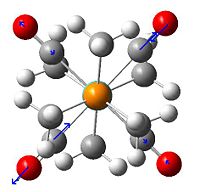
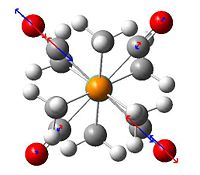
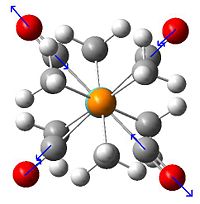
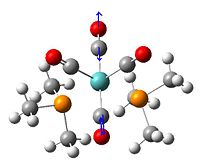
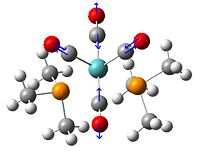
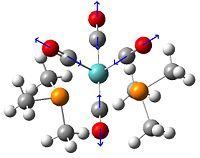
The most intense peaks in both spectra are the CO stretches. However the number of peaks in each spectrum is different due to the differing symmetry of each molecule. Both molecules have 4 CO stretches and they are shown below.
| Trans Isomer | Cis Isomer | ||||||||||||||||||||||||||||||
|---|---|---|---|---|---|---|---|---|---|---|---|---|---|---|---|---|---|---|---|---|---|---|---|---|---|---|---|---|---|---|---|
|
|
As discussed before in the BH3 section vibrations can only be observed if they result in a change of dipole of the molecule. Also there is the possibility that some vibrations are degenerate and so will appear as a single peak in the IR Spectrum. Literature values for this exact molecule are hard to find so any comparisons will be made to a similar molecule Mo(P(C5H6)3)2(CO)4. The calculations show a single peak for the trans isomer caused by 2 degenerate vibrations at 1842.25 cm-1 and 4 peaks for the cis isomer. This agrees with literature values for Mo(P(C5H6)3)2(CO).4[4] A table of the literature values and the calculated is shown below.
| Calculated Frequency (cm-1) |
Literature(cm-1) |
|---|---|
| 1842.25, 1842.25 | 1889 |
| Calculated Frequency (cm-1) |
Literature(cm-1) |
|---|---|
| 1850.17 | 1899 |
| 1855.7 | 1911 |
| 1873.96 | 1929 |
| 1961.99 | 2023 |
The literature estimates are really not very accurate, but they are for different substituents. They do however match up the number of visible vibrations with the calculated.
Ammonia
Symmetry
| C3V | C1 | D3h | |||||||||
|---|---|---|---|---|---|---|---|---|---|---|---|
|
|
| |||||||||
 |
 |
|
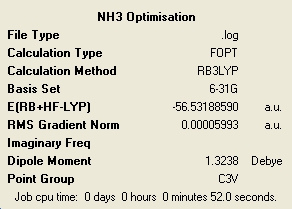
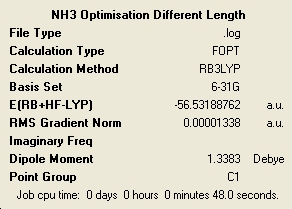
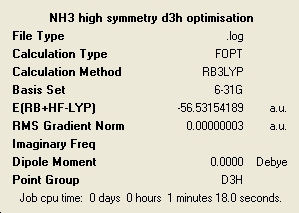
The higher the level of symmetry the longer the calculation has taken. This is quite interesting as it is very counter intuitive. I would of imagined that a high level of symmetry would make things easy to calculate due to the regularity of the structure. All of the molecules retained the symmetry that they had at the start of optimisation, although this is a default setting of Gaussian and can be changed. When optimising a highly symmetric large molecule it would perhaps be a good idea to break the symmetry very slightly to speed up the calculation. The loss of symmetry in this case from C3V to C1 has only made a very small impact on the total energy of the system. The lowest energy molecule was the ammonia with C1 symmetry and the highest in energy was the D3. It can be said then that the higher the symmetry the higher the energy. However the energy differences in this case are very small with the C3V having a ΔE = 4.51E-3 kJ/mol and D3 with ΔE = 0.907 kJ/mol. The C3V has such a close energy to the lowest energy that it is negligible in this case. However the D3 is more significantly higher but also has a much different different geometry.
MP2 Method
| C3v | C1 | D3h |
|---|---|---|
 |
 |
|
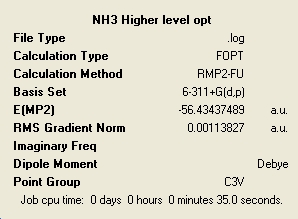
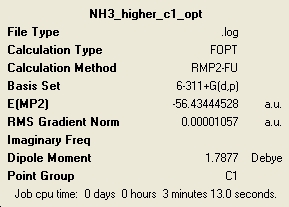
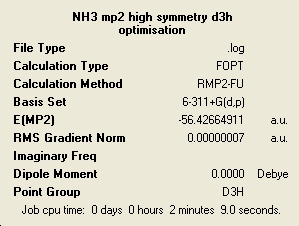
In general these calculations have taken longer to complete than the lower level ones but for some reason the C3v was actually quicker. The energies have changed very much and the ordering of the relative energies with respect to the level of symmetry remains the same, with the C1 having the lowest energy.
The energy barrier of inversion can be calculated from this data as 20.3 kJ/mol. This is a pretty close estimation to the literature recorded value of 24.3 kJ/mol.[5]
Inversion of Ammonia
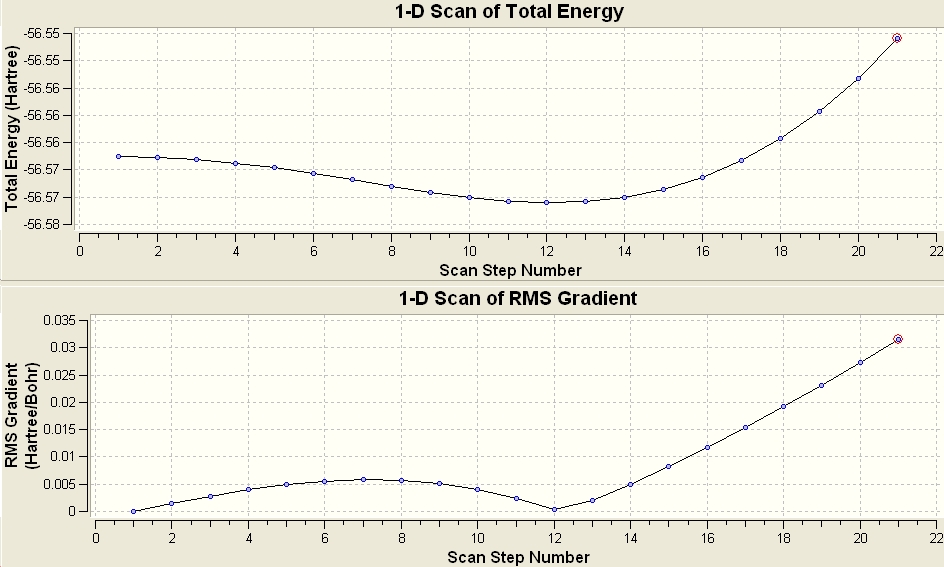
A SCAN was done from the the C3v to the D3h to model the inversion mechanism of ammonia. The graph below shows a potential energy plot against the different points of the transformation from one geometry to the next.
Vibrational Analysis
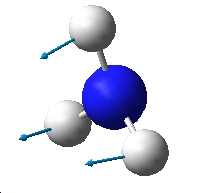
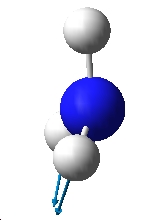
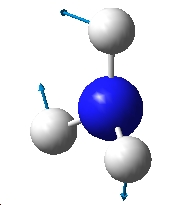
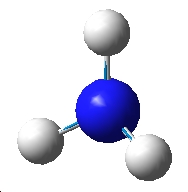
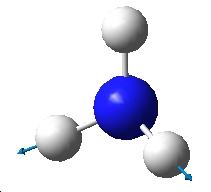
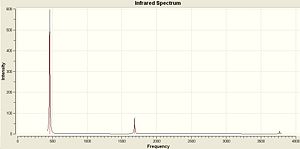
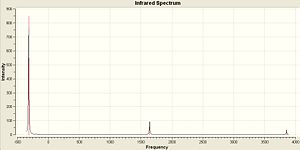
The vibrations of NH3 with C3v and D3h symmetry were calculated in Gaussian using the B3LYP method and basis set 6-31G. The vibrations are very similar to BH3 as shown above. The IR Spectra are diplayed below...
| NH3 C3v | NH3 D3h |
|---|---|
 |
 |
| NH3 C3v | NH3 D3h | ||||||||||||||||||||||||||||||||||||||||||
|---|---|---|---|---|---|---|---|---|---|---|---|---|---|---|---|---|---|---|---|---|---|---|---|---|---|---|---|---|---|---|---|---|---|---|---|---|---|---|---|---|---|---|---|
|
|
The vibrations are extremely similar to the BH3 but there are a couple of differences. Vibration 4 still has an intensity of zero for the D3h but in the the C3v there is a small change in dipole and so this vibration has a very small intensity. However this isn't large enough in comparison to the other vibrations to be visible in the IR Spectrum. Another difference is the negative frequency in the D3h molecule. This is because it is a transition state and is not an optimised structure. It has been forced into that geometry and optimised for the specific point group. The vibration that follows the reaction path is the first vibration of each at 462.089 and -318.051 Cm-1.
Mini Project - Investigation of Bonding in Bridging Metal-Halogen-Metal Bonds
Introduction
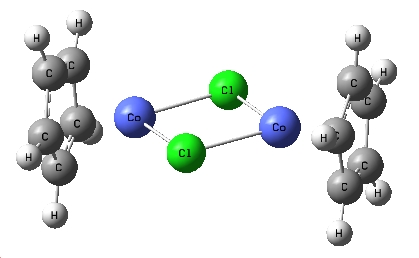 |
This is the complex that I investigated the nature of the bonding of bridging halogen. The aim was to look at how the bridging chloride's orbitals interacted with the metal centres, each other, and also whether there were any bonding interactions between the two metals. I initially didn't have a specific complex in mind when started investigating, but came across this cobalt complex in the literature[6] as a stable intermediate at low temperatures in a reaction scheme. It was an ideal complex for investigation as it was quite simple and the Cp groups being the only substituents allowed for an easy alteration of the electron density in the central bonds by adding electron withdrawing and donating groups to the Cp rings. The electron donating group chosen were simple Me groups, these were chosen as they would provide more electron density and were small enough that the calculation time would be suitable for the time scale of this experiment. As the electron withdrawing groups, 2 nitro substituents were added to each Cp ring. |
Optimisation
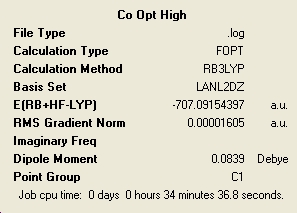
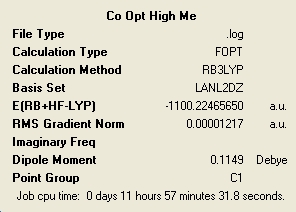
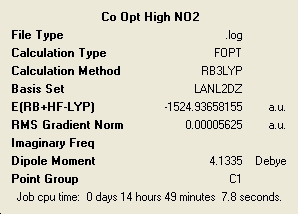
The 3 structures were created in Gaussview and first optimised by a simple "clean stricture" function of Gaussview. This straightened up the cp ligands and made a good starting point for the optimisations. A B3LYP optimisation with the LANL2MB basis set was done followed by a B3LYP/LANL2DZ including a full pop analysis to generate molecular orbitals and full NBO charge analysis to look at charge distribution in the complex. The summaries of the calculations along with models of the optimised geometries and links to the published files are given below.
| (CoClCp)2 | (CoClCp*)2 | (CoClCp(NO2)2)2 | |||||||||
|---|---|---|---|---|---|---|---|---|---|---|---|
|
|
| |||||||||
 |
 |
| |||||||||
| Published Here | Published Here | Published Here |
The lowest energy molecule is the complex with only Cp ligands on the cobalt. This is as expected as adding substituents to the rings was always going to increase the internal energy. The complexes also follow the trend that the higher the energy the higher the calculation time.
Geometry Analysis
(CoClCp)2
The cobalt chlorine centre forms a square shaped geometry that is almost perfectly planar. It isn't a perfect square and the cobalts have been pulled closer to the Cp ligands to make it slightly diamond shaped, with angles of...
| Bonds | Angle |
|---|---|
| Co-Cl-Co | 93.510°, 93.446° |
| Cl-Co-Cl | 86.521°, 86.514° |
The bond lengths and distances of these 4 atoms are...
| Atoms | Length (Å) |
|---|---|
| Co-Cl | 2.29744, 2.29860, 2.29848, 2.29725 |
| Co-Co | 3.34690 |
| Cl-Cl | 3.14953 |
The most peculiar outcome of this optimisation is that the Cp rings are not perfectly planar. On each ring the biggest dihedral angles are 4.492° and 4.265°. This is extremely unexpected and shall monitor this effect in the other structures.
(CoClCp*)2
In this complex the centre 4 atoms are in the same arrangement as before but the bonds lengths and angles are slightly different.
| Bonds | Angle |
|---|---|
| Co-Cl-Co | 93.697, 93.658 |
| Cl-Co-Cl | 86.320, 86.324 |
| Atoms | Lengths (Å) |
|---|---|
| Co-Cl | 2.31105, 2.31109, 2.31046, 2.31188 |
| Co-Co | 3.37160 |
| Cl-Cl | 3.16184 |
The first observation is that adding electron density of the Cp rings and the metal has caused a lengthening of all bonds in the central square arrangement. This suggests a weakening of these bonds possibly due to a high amount of charge build up causing repulsion of the chlorine atoms between each other.
The Cp* ring in this case is also not planar, the highest dihedral angle on each being 4.732° and 4.725°. It is perhaps the case that this complex would rather have a 16 electrons on the metal and during the optimisation it is trying to ring slip to remove electrons from the Co. It has already been shown that the addition of electron density has caused a lengthening of all the central bonds.
(CoClCp(NO2)2)2
After the addition of an electron donating group causing a lengthening of the bonds of this molecule, perhaps an electron withdrawing group will stablise the structure. The angle and distances are shown below...
| Bonds | Angle |
|---|---|
| Co-Cl-Co | 92.983°, 92.915° |
| Cl-Co-Cl | 86.563°, 87.138° |
| Atoms | Lengths (Å) |
|---|---|
| Co-Cl | 2.27803, 2.28225, 2.26893, 2.26723 |
| Co-Co | 3.29778 |
| Cl-Cl | 3.12646 |
The addition of the electron withdrawing groups has reduced the lengths of the bonds in the centre of this complex, further supporting the fact that this Co-Cl-Co bond is overly rich in electrons. In this optimisation the arrangement of the central 4 atoms is no longer planar and it has puckered slightly. It is unclear whether this is a consequence of the complex adopting a more stable geometry with a stronger bond or whether it is due to the lack of symmetry in the substituents on the ring. To confirm either way the rings were further substituted with nitro groups to make them symmetrical and more electron deficient. There is the risk however that the rings become too electron deficient and the complex will fall apart.
- This complex in fact never finished optimising at the same high level basis set of the others. The low level did show that any puckering of the central four atoms was purely down to the antisymmetric nature of the ligands. All further analysis was carried out using the originally optimised structure with 2 NO2 groups per Cp ring
Vibrational Analysis
The aim of the the vibrational analysis was to further investigate the previous observation of the increased electron density causing the the bonds to lengthen, suggesting a weakening of these bonds. If these bonds have been weakened due to in creased electron density then it is expected the frequency of the vibrations associated with the bonds will decrease.
As there were a lot a vibrations for each I have chosen three to analyse based on their ease to match up to the corresponding frequency between all three complexes. In some cases it was very difficult to match up a set of three the same and in several cases there were vibrations that seemed like combinations of others and so were no good for comparison.
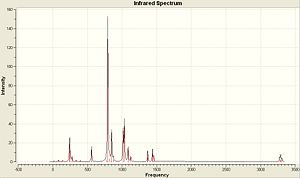
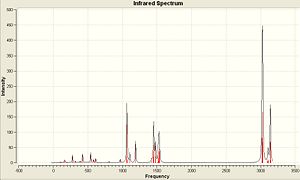
Below is the generated IR Spectra generated from the vibrational analysis and also links to where the output files have been published...
| (CoClCp)2 | (CoClCp*)2 | (CoClCp(NO2)2)2 |
|---|---|---|
 |
 |
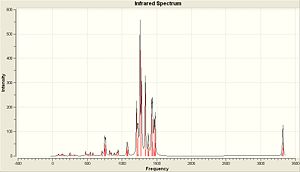 |
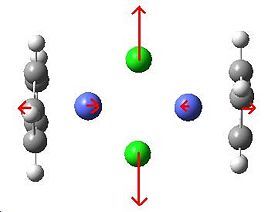
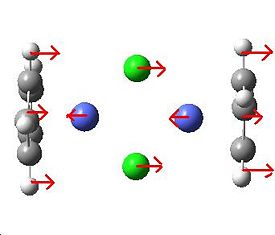
The three vibrations that I have chosen to look at are of the general forms drawn below and the frequencies given are for the calculated vibrations from each complex.
 |
 |

| |
| (CoClCp*)2 | 201.101 cm-1 | 278.405 cm-1 | 434.318 cm-1 |
| (CoClCp)2 | 274.453 cm-1 | 397.736 cm-1 | 402.372 cm-1 |
| (CoClCp(NO2)2)2 | 284.521 cm-1 | 395.003 cm-1 | 404.012 cm-1 |
The frequencies have been arranged in order of electron donating to withdrawing top to bottom in order to see the trends. For the first vibration the trend of a higher frequency occurring for the electron withdrawing grouped complex and a lower frequency vibration for the electron rich complex agrees with the previous findings in the geometry analysis. The longer bonds had a low stretching frequency and the shorter bonds had a higher frequency. For the second frequency the same trend holds for the first two complexes but the electron deficient centred complex has a very similar and slightly smaller frequency for this vibration. For the third vibration there was a similar but opposite outcome, with the electron rich centre having an anomalous point but in this instance it was quite far off the trend ~32 cm-1.
It does seem like the frequency analysis supports loosely the idea that the Co-Cl2-Co bond is stronger when electron density is removed from it. However it is hard to use these frequencies as accurate proof for this as the frequencies are affected by several other things, mainly the fact that the group that are added are very different in mass and so the complexes can't be thought of as the the same but with more or less electron density in the centre. Despite this the correlation is still pretty good with the bond lengths and is still substantial evidence to support an over electron rich bond in these complexes that would rather be put on the substituent ligands.
Charge Distribution
The idea of doing an NBO charge analysis is to confirm that the groups that were added to the Cp rings have actually donated or withdrawn charge away from the central four atoms as they were intended to. The first one looked at has to be the standard complex that has hydrogen atoms as all the substituents on the rings to give a place to compare to.

|
There is not a lot to comment on here of than it is perfectly logical that the chlorine atoms have a negative charge in relation to the the cobalt metal atoms. More important is the comparison with the next complexes with electron donating and withdrawing groups. |
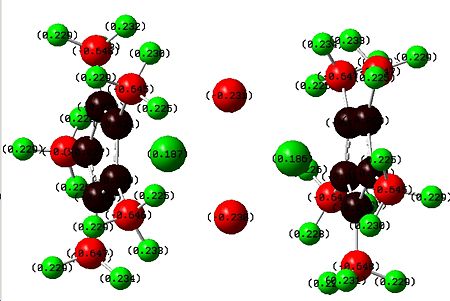
|
The addition of electron donating groups has certainly put increased negative charge on the chlorine atoms as expected, however it has also caused a higher positive charge on the cobalts and I am not sure why this is the case. |
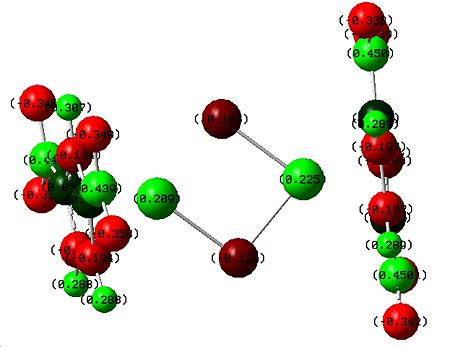
|
The addition of the electron withdrawing nitro groups did reduce the amount of negative charge on the chlorines and alos increased the positive charge on the cobalts. This shows that the addition of these electron donating and withdrawing groups did mostly what was expected and so any observations made about bond lengths and vibrations that were attributed to the gain or loss of electron density has some reliability. |
Molecular Orbitals
The aim of studying the molecular orbitals of these compounds is to look at the nature of the bonding of the Co-Cl2-Co bond in terms of orbitals overlap and to see if a reason for the cause of increased electron density weakening the bond can be found.
(CoClCp)2
| HOMO | LUMO |
|---|---|
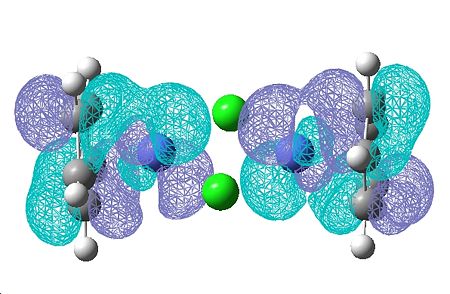 |
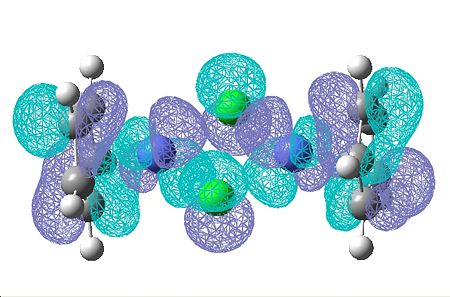
|
The HOMO and LUMO don't provide any information about the bonding of the chorines, which is what I'm interested in. I looked through all the Molecular Orbitals from the highest energy downwards until I found some that contained good overlap between the chlorine atoms and the cobalt.
The are sveral molecular orbitals which show bonding character for this central part of the complex. These are molecular orbitals are shown below...
| 53 | 52 | 48 | 47 | 46 | 45 | 44 | 43 | |
|---|---|---|---|---|---|---|---|---|
 |
 |
 |
 |
 |
 |
 |
 |
|
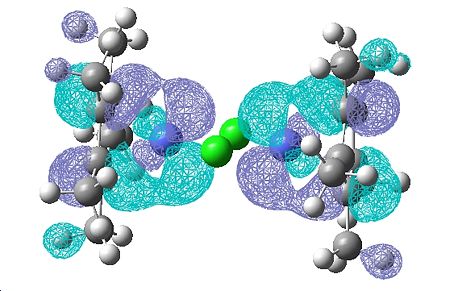
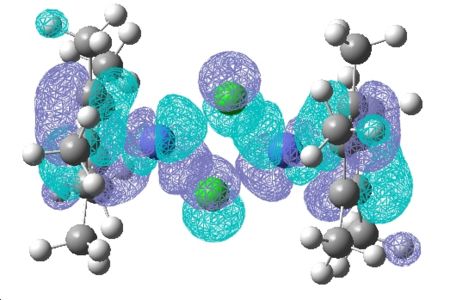
(CoClCp*)2
| HOMO | LUMO |
|---|---|
 |
|
| In the HOMO of this complex there seems to be more electron density and a better overlap between the ligand on the metal centre than in the other complex where more of the electron density in the HOMO was on the ligand itself. |
Again the HOMO and LUMO don't paint a picture of the bonding between the chlorine so I looked for the analogous molecular orbitals that I found for the previous complex.
| 91 | 90 | 89 | 88 | 87 | 86 | 85 | 84 | 83 |
|---|---|---|---|---|---|---|---|---|
 |
 |
 |
 |
 |
 |
 |
 |

|
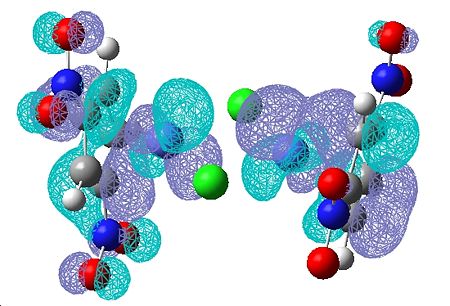
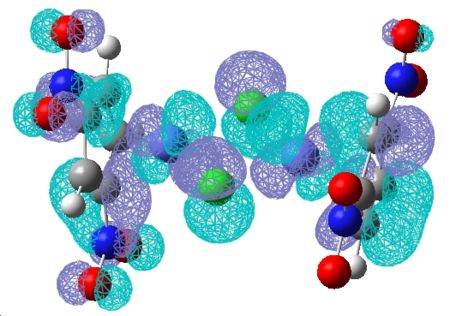
(CoClCp(NO2)2)2
| HOMO | LUMO |
|---|---|
 |
|
| 85 | 83 | 82 | 81 | 80 | 79 | 78 | 77 | 76 | 75 |
|---|---|---|---|---|---|---|---|---|---|
 |
 |
 |
 |
 |
 |
 |
 |
 |

|
The molecular orbitals in this complex are very anti-symmetric in places and quite strange looking. It is unfortunate that the calculation of the more symmetric electron withdrawing groups as this would have made them more symmetric.
It is extremely hard to say that better overlap can be seen in specific molecular orbitals, to account for strong/weaker bonds. It is worth noting that in all three complexes there is significant bonding between the two chlorine atoms. I did not however come across any direct metal-metal bonding between the cobalts, all interactions were through the chlorine atoms.
Conclusion
There is quite a bit of evidence to suggest that this Co-Cl2-Co bond is electron rich and would prefer to release some charge onto other substituents. The reason for this I am unable to explain from the molecular orbitals. However I think the other measurements are significant evidence to support this idea. The Molecular Orbitals did however provide an intersting insight into the variety of orbitals that bond the chlorine to the cobalt and also to each other. With more time I would generate a predicted Molecular Orbital diagram from the linear combination of atomic orbitals method and this would help to quantify the nature of each of these calculated orbitals.
References
- ↑ Inorganic Chemistry 4th Ed.; Shriver & Atkins; Oxford University Press 2006; p294
- ↑ W. M. Tolles and William D. Gwinn; Structure and Dipole Moment for SF4; J. Chem. Phys. 36, 1119 (1962) DOI:10.1063/1.1732702
- ↑ O. R. Gilliam, C. M. Johnson and W. Gordy (1950). "Microwave Spectroscopy in the Region from Two to Three Millimeters". Physical Review 78 (2): 140. DOI:10.1103/PhysRev.78.140
- ↑ F. A. COTTON; Vibrational Spectra and Bonding in Metal Carbonyls. Force Constants and Ass'gnments of CO Stretching Modes in Various Molecules; Evaluation of CO Bond Orders; Journal of Inorganic Chemsitry; Vol 3 No. 5 May 1964
- ↑ http://www.ch.ic.ac.uk/hunt/teaching/teaching_comp_lab_year3/9c_nh3_method.html
- ↑ Synthesis and reactivity impact from electron-withdrawing substituent on the cyclopentadienyl ligand of cobalt(I)–(III) complexes Journal of Organometallic Chemistry, Volume 682, Issues 1-2, 1 October 2003, Pages 123-130 Chong-Zhi Tang, You-Feng Xu, Zhen Pang, Xiu-Feng Hou DOI:10.1016/j.physletb.2003.10.071

