Rep:Mod:zillakilla2
Introduction
Bonding in Inorganic systems is somewhat more complex than bonding in Organic systems. Computational methods are able to predict the location of transition states and activated complexes that are not possible to isolate experimentally due to their extremely short lives. From these computer models thermodynamic and kinetic data can be obtained, as well as spectral data. Analysis of electron densities will give information on interactions between atoms and bonding.
BH3
Optimising BH3
The BH3 molecule was drawn and its geometry optimised using the B3LYP method, after fixing the bond lengths at 1.5 Angstroms. After optimisation the bond lengths were read to be 1.19A, and the optimised H-B-H angle was 120o. This agrees with the literature bond distance of 1.1857 Angstroms [1]
Viewing the results tab gave us the information regarding the calculation:
| File type | .log |
| Calculation type | FOPT |
| Calculation method | RB3LYP |
| Basis set | 3-21G |
| Final energy (au) | -26.46 |
| Gradient (au) | 0.00021 |
| Dipole moment (Debye) | 0.0 |
| Point group | D3H |
| Job time | 44.0 seconds |
https://wiki.ch.ic.ac.uk/wiki/images/9/9a/BH3_OPTIMISATION_MR308.LOG
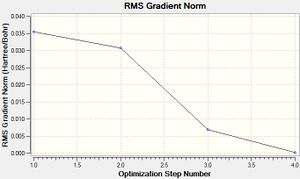
As shown on the table, the molecule has indeed been optimised due to the gradient being less than 0.001.
Below are graphs showing how the energy and gradient have changed during the optimisation of BH3. The gradient shows how much the energy changes from one perturbation to the next - when the gradient is small (less than 0.001) the energy change is minimal, and therefore the molecule is at its optimised geometry.
 |
 |
Molecular Orbitals of BH3
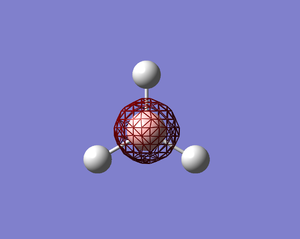
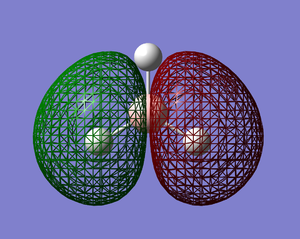
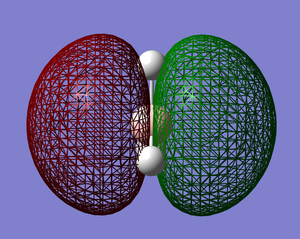
The molecular orbitals of BH3 were calculated using the B3LYP method with the Basis Set set to 6-31G. The results were as follows; DOI:10042/to-6521 [2]
 |
 |
 |
 |
 |
 |
 |
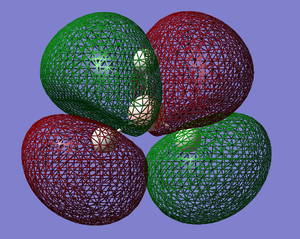 |
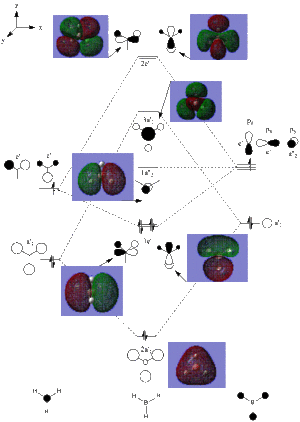
The MO's were then added to the MO Diagram of BH3. The MO's were taken from those calculated above. As shown on the diagram, the MO's match well with the theory. This shows that the method chosen is reliable to determine the orbital shape. Having said that, the energies are not calculated along with the MO's and therefore it has its downfalls.
NBO Analysis of BH3
NBO analysis looks at the charge densities on each of the atoms in a molecule. The NBO analysis for BH3 is shown below, agreeing with the expected results due to the electron deficiency of Boron, leading to a high positive charge. The results indicate that BH3 is a Lewis acid, with a high positive charge on the Boron allowing the possibility of extra electron acceptance.
 |
 |
Opening the File further properies can be explored. Looking at the Summary of Natural Population Analysis it can be seen that the Boron atom has a natural charge of 0.278, and the Hydrogens have a natural charge of -0.0927 each. The equal values of the Hydrogen atoms support the planar D3h symmetry of the molecule.
Summary of Natural Population Analysis:

                                      Natural Population
               Natural  -----------------------------------------------
   Atom  No    Charge         Core      Valence    Rydberg      Total
-----------------------------------------------------------------------
     B    1    0.27816      1.99954     2.72230    0.00000     4.72184
     H    2   -0.09272      0.00000     1.09256    0.00015     1.09272
     H    3   -0.09272      0.00000     1.09256    0.00015     1.09272
     H    4   -0.09272      0.00000     1.09256    0.00015     1.09272
=======================================================================
  * Total *    0.00000      1.99954     6.00000    0.00046     8.00000
The orbital contributions of the atomic orbitals can be studied as well (below). These show that the Boron atom forms three sp2 hybrid orbitals with the Hydrogens, shown by the s:p 1:2 ratio. It also indicates that the Boron has a lone pair occupying the last orbital.
(Occupancy) Bond orbital/ Coefficients/ Hybrids
---------------------------------------------------------------------------------
    1. (1.99854) BD ( 1) B   1 - H   2
               ( 45.36%)   0.6735* B   1 s( 33.33%)p 2.00( 66.67%)
                                           0.0000  0.5774  0.0000  0.0000  0.0000
                                           0.8165  0.0000  0.0000  0.0000
               ( 54.64%)   0.7392* H   2 s(100.00%)
                                           1.0000  0.0001
    2. (1.99854) BD ( 1) B   1 - H   3
               ( 45.36%)   0.6735* B   1 s( 33.33%)p 2.00( 66.67%)
                                           0.0000  0.5774  0.0000  0.7071  0.0000
                                          -0.4082  0.0000  0.0000  0.0000
               ( 54.64%)   0.7392* H   3 s(100.00%)
                                           1.0000  0.0001
    3. (1.99854) BD ( 1) B   1 - H   4
               ( 45.36%)   0.6735* B   1 s( 33.33%)p 2.00( 66.67%)
                                           0.0000  0.5774  0.0000 -0.7071  0.0000
                                          -0.4082  0.0000  0.0000  0.0000
               ( 54.64%)   0.7392* H   4 s(100.00%)
                                           1.0000  0.0001
    4. (1.99954) CR ( 1) B   1           s(100.00%)
                                           1.0000  0.0000  0.0000  0.0000  0.0000
                                           0.0000  0.0000  0.0000  0.0000
    5. (0.00000) LP*( 1) B   1           s(100.00%)
The mixing between MO's can be viewed by the "Second Order Perturbation Theory Analysis of Fock Matrix in NBO Basis" section. In more complex molecules, mixing occurs with important effects on the chemical properties of the molecule, and are shown in this section with energies usually greater than 20kcal/mol. In the case of BH3 significant mixing does not occur.
Second Order Perturbation Theory Analysis of Fock Matrix in NBO Basis
    Threshold for printing:   0.50 kcal/mol
                                                                             E(2)  E(j)-E(i) F(i,j)
        Donor NBO (i)                     Acceptor NBO (j)                 kcal/mol   a.u.    a.u.
===================================================================================================
within unit  1
  4. CR (   1) B   1                / 10. RY*(   1) H   2                    0.70    7.42    0.064
  4. CR (   1) B   1                / 11. RY*(   1) H   3                    0.70    7.42    0.064
  4. CR (   1) B   1                / 12. RY*(   1) H   4                    0.70    7.42    0.064
The Natural Bond Orbital (Summary) section indicates the energy, population/occupation of the bonds in the molecule, as well as the energy of any lone pairs. In this case it can be seen that the first three bonds are made up of an occupancy of 1.999, which is approximately 2, and therefore are made up of 2 electrons each. The lone pair also has an occupancy of ~2, again indicating two electrons.
The energy of the orbitals indicate whether they are stabilising or destabilising. As shown for the BH3 molecule the first 4 orbitals all have negative energies, thus stabilising the molecule. Any addition of electrons to the higher orbitals will destabilise the molecule, as they have positive energy values (except orbital 8).
Natural Bond Orbitals (Summary):
                                                           Principal Delocalizations
          NBO                        Occupancy    Energy   (geminal,vicinal,remote)
====================================================================================
Molecular unit  1  (H3B)
    1. BD (   1) B   1 - H   2          1.99854    -0.43328
    2. BD (   1) B   1 - H   3          1.99854    -0.43328
    3. BD (   1) B   1 - H   4          1.99854    -0.43328
    4. CR (   1) B   1                  1.99954    -6.68393  10(v),11(v),12(v)
    5. LP*(   1) B   1                  0.00000     0.53915
    6. RY*(   1) B   1                  0.00000     0.37512
    7. RY*(   2) B   1                  0.00000     0.37512
    8. RY*(   3) B   1                  0.00000    -0.04064
    9. RY*(   4) B   1                  0.00000     0.41499
   10. RY*(   1) H   2                  0.00015     0.73308
   11. RY*(   1) H   3                  0.00015     0.73308
   12. RY*(   1) H   4                  0.00015     0.73308
   13. BD*(   1) B   1 - H   2          0.00146     0.42130
   14. BD*(   1) B   1 - H   3          0.00146     0.42130
   15. BD*(   1) B   1 - H   4          0.00146     0.42130
      -------------------------------
             Total Lewis    7.99516  ( 99.9396%)
       Valence non-Lewis    0.00437  (  0.0547%)
       Rydberg non-Lewis    0.00046  (  0.0058%)
      -------------------------------
           Total unit  1    8.00000  (100.0000%)
          Charge unit  1    0.00000
Vibrational Analysis of BH3
In order to confirm that the optimised geometry obtained previously was in fact the minimum energy structure, a vibrational analysis was carried out. This was done again using Gaussian calculations, with the method set to "Frequency". Once the calculation was complete the energy was viewed and compared to the previously calculated energy. The energies were the same and therefore the structure is in fact the minimum energy structure. The summary of the calculation and results are as follows: https://wiki.ch.ic.ac.uk/wiki/images/4/49/BH3_VIBRATIONAL_INPUT_MR308.LOG
| File type | .log |
| Calculation type | FREQ |
| Calculation method | RB3LYP |
| Basis set | 3-21G |
| Final energy (Au) | -26.46 |
| Gradient (Au) | 0.00021 |
| Dipole moment (Debye) | 0.0 |
| Point group | C3h |
| Job time | 25.0 seconds |
The Low Frequencies were viewed in the output file and seen to have very low values, which suggests the calculation was successful as they relate to the motion of the centre of mass of BH3
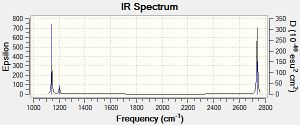
Low frequencies ---  -66.7625  -66.3592  -66.3589   -0.0020    0.0031    0.2123
Low frequencies --- 1144.1483 1203.6413 1203.6424
Harmonic frequencies (cm**-1), IR intensities (KM/Mole), Raman scattering
activities (A**4/AMU), depolarization ratios for plane and unpolarized
incident light, reduced masses (AMU), force constants (mDyne/A),
and normal coordinates:
                    1                      2                      3
                   A"                     E'                     E'
Frequencies --  1144.1483              1203.6413              1203.6424
Red. masses --     1.2531                 1.1085                 1.1085
Frc consts  --     0.9665                 0.9462                 0.9462
IR Inten    --    92.8665                12.3148                12.3173
 Atom  AN      X      Y      Z        X      Y      Z        X      Y      Z
    1   5     0.00   0.00   0.16     0.00   0.10   0.00    -0.10   0.00   0.00
    2   1     0.00   0.00  -0.57     0.00   0.08   0.00     0.81   0.00   0.00
    3   1     0.00   0.00  -0.57    -0.38  -0.59   0.00     0.14   0.38   0.00
    4   1     0.00   0.00  -0.57     0.38  -0.59   0.00     0.14  -0.38   0.00
                    4                      5                      6
                   A'                     E'                     E'
Frequencies --  2598.4249              2737.4364              2737.4371
Red. masses --     1.0078                 1.1260                 1.1260
Frc consts  --     4.0092                 4.9714                 4.9714
IR Inten    --     0.0000               103.7400               103.7333
 Atom  AN      X      Y      Z        X      Y      Z        X      Y      Z
    1   5     0.00   0.00   0.00     0.11   0.00   0.00     0.00   0.11   0.00
    2   1     0.00   0.58   0.00     0.02   0.00   0.00     0.00  -0.81   0.00
    3   1     0.50  -0.29   0.00    -0.60   0.36   0.00     0.36  -0.19   0.00
    4   1    -0.50  -0.29   0.00    -0.60  -0.36   0.00    -0.36  -0.19   0.00
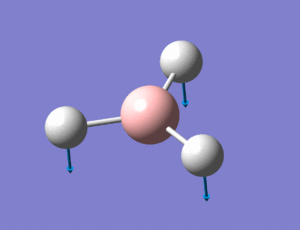
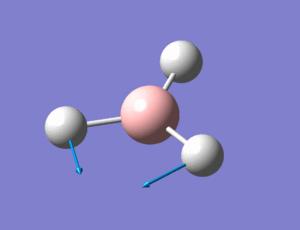
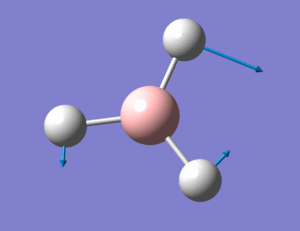
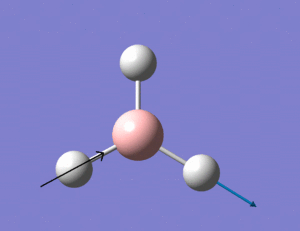
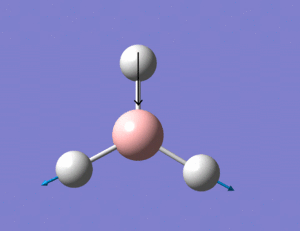
The animations (images of the displacement vectors) of the above frequencies are shown in the table below:
The IR spectrum generated by the Gaussian calculation is shown below. As shown, there are only three peaks seen on the IR spectrum where six vibrations occur. IR spectra show vibrations that are IR active - that is they have a dipole moment. Therefore the frequencies with symmetric vibrations (A') will not show up on the IR spectrum, indicated by the corresponding Intensity 0. There are also 2 sets of degenerate vibrations, numbers 2 and 3, and 5 and 6. The degenerate vibrations only give rise to one peak, and therefore this is why overall there are only three peaks seen when there are six vibrational modes.
TlBr3
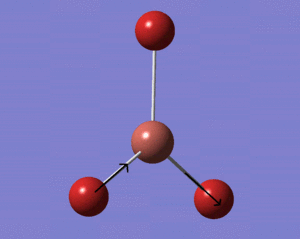
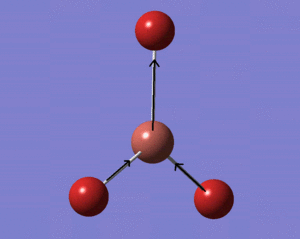
The molecule TlBr3 was created using Gaussview, and the symmetry was set to D3h, increasing the tolerance to 0.0001 to ensure the MO and Vibrational calculations to be run later are correct. The optimisation was run using the B3LYP method, with the basis set set to LanL2DZ. The optimised molecule ;
Tl-Br bond length: 2.65 Angstroms
Br-Tl-Br bond angle: 120o
This is close to the literature [3] bond distance =2.512 Angstroms, however they are slightly out due to the basis set used is not accurate enough to get a more precise value.
The summary of the calculation and the results of the optimisation are as follows:
https://wiki.ch.ic.ac.uk/wiki/images/7/7e/TLBR3_OPTIMISATION_MR308.LOG
| File type | .log |
| Calculation type | FOPT |
| Calculation method | RB3LYP |
| Basis set | LANL2DZ |
| Final energy (au) | -91.22 |
| Gradient (au) | 0.00000090 |
| Dipole moment (Debye) | 0.0 |
| Point group | D3H |
| Job time | 43.0 seconds |
Vibrational Analysis of TlBr3
A vibrational and frequency analysis was carried out on TlBr3. The vibrational analysis was run as it confirmed whether the intial geometry optimisation had been successful and therefore the correct structure was obtained. The frequency analysis is important as it indicates whether the optimised structure is actually a minimum. This in general is done by calculating the second derivative of the potential energy surface of the molecule. Plugging the values for the maxima and minima (calculated from the first derivative of the potential energy surface of the molecule) into the second derivative will yield either a positive or negative result. A positive result relates to a minima, and a negative result relates to a maxima (a transition state). It also provides the IR and Raman spectra, which can be compared with experimental results.
It is important to use the same method and basis set for both calculations, because the basis set controls how accurate the potential energy surface is, therefore using the same basis set is necessary to get comparable results, otherwise the results from the calculations are pointless as they will have different accuracies.
The summary and results of the vibrational calculations were as follows:
https://wiki.ch.ic.ac.uk/wiki/images/5/5b/TLBR3_IR_MR308.LOG
| File type | .log |
| Calculation type | FREQ |
| Calculation method | RB3LYP |
| Basis set | LANL2DZ |
| Final energy (au) | -91.22 |
| Gradient (au) | 0.00000088 |
| Dipole moment (Debye) | 0.0 |
| Point group | D3H |
| Job time | 47.0 seconds |
The vibrational energy and the optimised energy are the same, therefore supporting the correct optimisation of the molecule.
The Low Frequencies were viewed in the output file and seen to have very low values, which again suggests the calculation was successful.
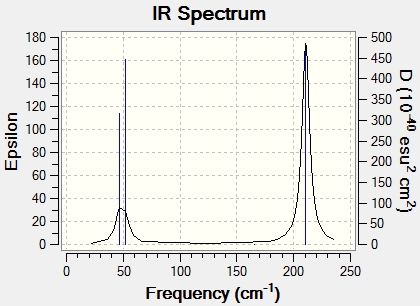
Low frequencies --- -3.4213 -0.0026 -0.0004 0.0015 3.9367 3.9367
Low frequencies ---   46.4289   46.4292   52.1449
Harmonic frequencies (cm**-1), IR intensities (KM/Mole), Raman scattering
activities (A**4/AMU), depolarization ratios for plane and unpolarized
incident light, reduced masses (AMU), force constants (mDyne/A),
and normal coordinates:
                    1                      2                      3
                   E'                     E'                     A2"
Frequencies --    46.4289                46.4292                52.1449
Red. masses --    88.4613                88.4613               117.7209
Frc consts  --     0.1124                 0.1124                 0.1886
IR Inten    --     3.6867                 3.6867                 5.8466
 Atom  AN      X      Y      Z        X      Y      Z        X      Y      Z
    1  81     0.00   0.28   0.00    -0.28   0.00   0.00     0.00   0.00   0.55
    2  35     0.00   0.26   0.00     0.74   0.00   0.00     0.00   0.00  -0.48
    3  35     0.43  -0.49   0.00    -0.01  -0.43   0.00     0.00   0.00  -0.48
    4  35    -0.43  -0.49   0.00    -0.01   0.43   0.00     0.00   0.00  -0.48
                    4                      5                      6
                   A1'                    E'                     E'
Frequencies --   165.2685               210.6948               210.6948
Red. masses --    78.9183               101.4032               101.4032
Frc consts  --     1.2700                 2.6522                 2.6522
IR Inten    --     0.0000                25.4830                25.4797
 Atom  AN      X      Y      Z        X      Y      Z        X      Y      Z
    1  81     0.00   0.00   0.00     0.42   0.00   0.00     0.00   0.42   0.00
    2  35     0.00  -0.58   0.00     0.01   0.00   0.00     0.00  -0.74   0.00
    3  35     0.50   0.29   0.00    -0.55  -0.32   0.00    -0.32  -0.18   0.00
    4  35    -0.50   0.29   0.00    -0.55   0.32   0.00     0.32  -0.18   0.00
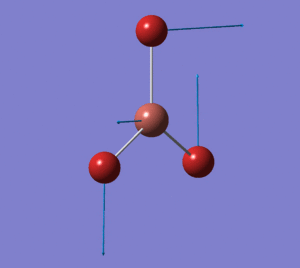
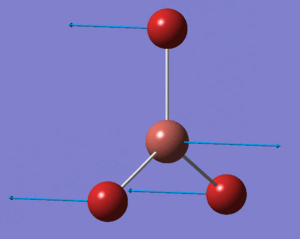
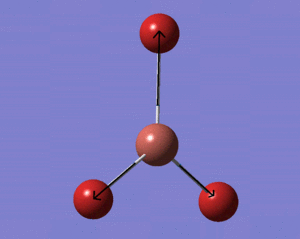
The lowest frequencies for TlBr3 are as follows, and due to the fact they are all in between 10 cm-1 of 0, the calculations were correct.
-3.4213 cm-1 -0.0026 cm-1 -0.0004 cm-1 0.0015 cm-1 3.9367 cm-1 3.9367 cm-1
The computer generated IR spectrum is below, with a table of the real vibrations following.
In some structures the bond is not drawn on Gaussview, however it does not mean that there is no bond there. The program has a specific limit in which it will draw a bond. If the calculated bond length exceeds this limit, the interaction between the two molecules is considered not enough to warrant a localised bond and therefore it will not draw one. That said, the interactions are still incorporated into any calculations run by the program.
In short, a chemical bond is the interaction between two atoms. This interaction can give rise to repulsion with no bond formation, and/or to attraction which leads to the formation of a bond. These interactions are a result of the electrons involved, and generally has been found that an electron pair bond is formed between an unpaired electron on each of the atoms. Overall the bond will stabilise the energy of the whole system. Bonds can occur due to the sharing of electrons of oppositely charged nuclei, covalent bonds, by different electronegativities, ionic/dipole-dipole/ion-dipole/hydrogen bonds, or a natural shift in electron density, Van der Waals. [4]
Analysis of the cis and trans Isomers of Mo(CO)4Cl2
Geometry Optimisation
The purpose of this exercise is to model the above isomers, and predict the vibrational frequencies of the carbonyl stretches. Firstly, the molecules were drawn on Gaussview, and a basic optimisation was carried out using a loose optimisation, and the basis set LAN12MB (higher accuracy than 3-21G), yielding the results;
| Isomer | Cis |
|---|---|
| File type | .fch |
| Calculation type | FOPT |
| Calculation method | RB3LYP |
| Basis set | LANL2MB |
| Final energy (au) | -617.52 |
| Gradient (au) | 0.00010 |
| Dipole moment (Debye) | 8.82 |
| Isomer | Trans |
|---|---|
| File type | .fch |
| Calculation type | FOPT |
| Calculation method | RB3LYP |
| Basis set | LANL2MB |
| Final energy (au) | -617.52 |
| Gradient (au) | 0.000023 |
| Dipole moment (Debye) | 0.00 |
Mo-C Bond Lengths: Cis: 2.06 Angstroms Trans: 2.11 Angstroms
P-Cl Bond Lengths: Cis: 2.41 Angstroms Trans: 2.40 Angstroms
Looking at the results it can be seen that the trans-isomer has no dipole moment, whereas the cis-isomer does. This is as expected due to the high symmetry of the trans isomer. Both have an RMS gradient lower than 0.001 indicating the optimisations were successful. The minia were reached, indicated by the .log file under the CONVERGED? heading (reading YES YES YES YES).
After the initial optimisation, the torsion angles between the axial CO group and the P-Cl bond of the cis-isomer were changed to 0o and 180o respectively. The trans-isomer angles were altered so both PCl3 groups were eclipsed, with one Cl group lying parallel to one Mo-C bond (the dihedral angle of OC-Mo-P-Cl of both groups were changed to 0o).
Having made these manual changes, the isomers were again optimised, this time using LANL2DZ as the basis set and B3LYP method. The results were as follows;
| Isomer | Cis |
|---|---|
| File type | .fch |
| Calculation type | FOPT |
| Calculation method | RB3LYP |
| Basis set | LANL2DZ |
| Final energy (au) | -623.58 |
| Gradient (au) | 0.0000027 |
| Dipole moment (Debye) | 1.31 |
| Isomer | Trans |
|---|---|
| File type | .fch |
| Calculation type | FOPT |
| Calculation method | RB3LYP |
| Basis set | LANL2DZ |
| Final energy (au) | -623.58 |
| Gradient (au) | 0.000032 |
| Dipole moment (Debye) | 0.31 |
The second optimisation was again checked for completion by checking the convergence. Upon second optimisation the bond lengths calculated decreased, indicating a better geometric optimisation. Having calculated the bond lengths and angles, these were compared with literature values for both the cis and trans isomers. The literature is in fact for cis and trans Isomers of Mo(CO)4(PPh3)2 as literature data for our molecule is unavailable. The analysis would have been carried out on this molecule, however PPh3 is such a large group it would take too much time for the calculations to complete. The electronic behaviour of Cl is similar to that of Ph, and therefore it was a suitable substitution, and the results are comparable.
| Cis Calculated Values | Cis Literature values [9] | Trans Calculated Values | Trans Literature Values[10] | |
|---|---|---|---|---|
| Mo-P Bond Lengths (Angstroms) | 2.51 | 2.59 | 2.44 | 2.50 |
| P-Cl Bond Lengths (Angstroms) | 2.24 (x6) | 1.83, 1.82, 1.83, 1.84, 1.85, 1.82 | 2.24 (x6) | 1.84, 1.83, 1.85 |
| P-Mo-P Bond Angle (Degrees) | 94.2 | 104.6 | 177.4 | 180.0 |
| P-Mo-C Bond Angle (Degrees) | 89.4, 89.2, 91.9, 176.1 | 91.7, 173.2, 90.6, 84.4 | 90.0, 88.7, 91.3, 90.0 | 87.2, 92.0 |
As shown above, the literature values compare well to the calculated values, with the small differences being attributed to a Cl ligand instead of a PPh3 ligand. The differences in the angles are as a result of the bulky PPh3 ligands causing strain and therefore distortion of the geometry. The deviations also could be caused by the fact that the D orbitals are not taken into account in the optimisations, and had they been included the results would have been more accurate.
The energies of the molecules appear to be the same. In actual fact the cis-isomer has a slightly lower energy (trans=-623.57603102, cis=-623.57707196; difference of 0.00104094 kcal/mol), and although is a small number, and the results are not accurate to that degree it appears to be the more stable isomer. This can be explained by the trans effect. In the trans-isomer the Cl ligands are trans to each other, whereas in the cis-isomer they are trans to the CO ligands. Although in the trans-isomer it is less sterically hindered, CO ligands are strong π-acceptors and therefore there is a larger trans effect than in the cis-isomer. As a result the electronic factor overrides the fact that in the cis-isomer they are more sterically hindered, and the cis-conformation is favourable. Upon increasing the size of the ligand (i.e. to PPh3) the steric strain may increase in the cis-conformation so that the trans-conformation is actually more favourable, even with the trans effect still present.
Vibrational Analysis
In order to confirm the lowest energy isomer of the molecule optimised previously, vibrational analysis was run. The same basis set and method were used as in the optimisation, otherwise the accuracy of the results would be different and comparison would not be able to be carried out. As a result, the following inputs were used; method=B31LYP basis set=LAN12DZ.
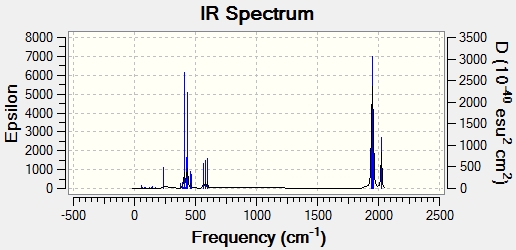
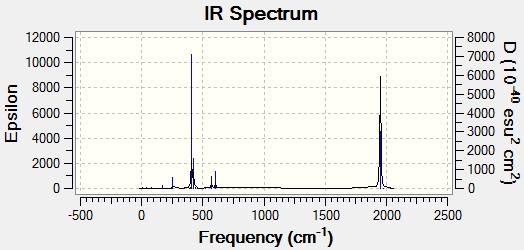
Viewing the low frequencies using the .log file it was seen that all of the low frequencies were positive, showing that both molecules optimised were indeed the minimum energy. Below are the results obtained from each of the calculations, followed by the IR spectra generated for each isomer.
| Isomer | Cis |
|---|---|
| File type | .fch |
| Calculation type | FREQ |
| Calculation method | RB3LYP |
| Basis set | LANL2DZ |
| Final energy (au) | -623.58 |
| Gradient (au) | 0.0000027 |
| Dipole moment (Debye) | 1.3102 |
| Isomer | Trans |
|---|---|
| File type | .fch |
| Calculation type | FREQ |
| Calculation method | RB3LYP |
| Basis set | LANL2DZ |
| Final energy (au) | -623.58 |
| Gradient (au) | 0.000032 |
| Dipole moment (Debye) | 0.3053 |
 |
 |
The low level vibrations of the cis and trans isomer are shown below. These vibrations are rocking vibrational mode, due to 'wagging' of PCl3 groups, each with very low intensities. The low frequency of these vibrations means they are accessible at room temperature due to the low energy needed to produce them.
| Isomer | Form of the Vibration | Frequency/cm-1 | Intensity |
|---|---|---|---|
| Cis | 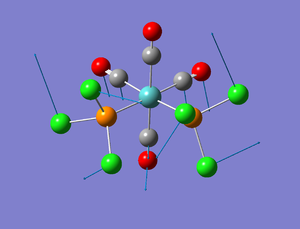 |
11 | 0 |
| Cis |  |
18 | 0 |
| Trans |  |
5 | 0 |
| Trans | 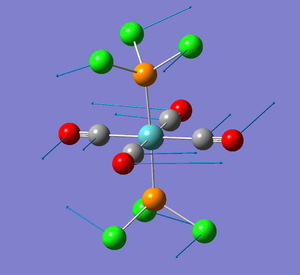 |
6 | 0 |
The CO stretching frequencies are shown below. When compared to the literature[13] values they compare quite well, again remembering the literature values are actually from PPh3 ligands, as opposed to Cl ligands, and that the D orbitals on the P atoms are not taken into account when the geometry optimisation is run. For the cis- isomer there are four stretches, whereas there is only one for the trans-isomer. This is due to symmetry - the trans isomer has two modes IR inactive which therefore do not appear on the IR spectrum. Although there are two vibrations, they are degenerate therefore only one peak is seen. The cis-isomer is assymetric, therefore all four are present in the IR spectrum.
Cis-isomer C=O Frequencies:
| Frequency(cm-1) | Intensity | Literature Frequency (cm-1) | Bond |
|---|---|---|---|
| 1945 | 763 | 1899 | C=O asymmetric |
| 1949 | 1498 | 1905 | C=O symmetric |
| 1958 | 633 | 1922 | C=O asymmetric |
| 2023 | 598 | 2019 | C=O symmetric |
Trans-isomer C=O Frequencies:
| Frequency(cm-1) | Intensity | Literature Frequency (cm-1) | Bond |
|---|---|---|---|
| 1950 | 1475 | 1895 | one pair of trans C=O bonds |
| 1951 | 1467 | 1895 | other pair of trans C=O bonds |
| 1977 | 1 | - | all 4 asymmetric |
| 2031 | 4 | - | all 4 symmetric |
Miniproject
Introduction
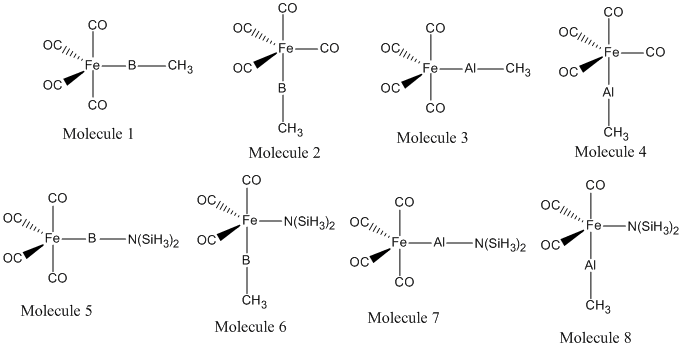
This miniproject will explore the effect on bonding in (CO)4Fe-ER complexes when E is changed from Boron to Aluminium. It is seen if the position - equatorial or axial effects the bond energies. The effect of changing the ligand R from CH3 to N(SiH3)2 is explored, as it is being changed from a poor pi-donor ligand to a good pi-donor ligand. The analysis carried out consists of a low accuracy geometry optimisation, followed by a higher accuracy geometry optimisation using pseudo-potentials. This will be supported by a frequency analysis, and the bonding explored using MO and NBO analysis. The molecules in question are shown below. Any literature data compared to in this report refers to this citation[14] unless otherwise stated.
Optimisation of Geometries
Each molecule was initially optimised using the basis set LANL2MB and the method B3LYP, yielding the results below.
| Molecule 1 | Molecule 2 | Molecule 3 | Molecule 4 | Molecule 5 | Molecule 6 | Molecule 7 | Molecule 8 | |
|---|---|---|---|---|---|---|---|---|
| File type | .log | .log | .log | .log | .log | .log | .log | .log |
| Calculation type | FOPT | FOPT | FOPT | FOPT | FOPT | FOPT | FOPT | FOPT |
| Calculation method | RB3LYP | RB3LYP | RB3LYP | RB3LYP | RB3LYP | RB3LYP | RB3LYP | RB3LYP |
| Basis set | LANL2MB | LANL2MB | LANL2MB | LANL2MB | LANL2MB | LANL2MB | LANL2MB | LANL2MB |
| Final energy (au) | -634.70 | -634.69 | -612.15 | -612.14 | -660.60 | -660.60 | -638.06 | -638.06 |
| Gradient (au) | 0.000018 | 0.000047 | 0.0000089 | 0.000026 | 0.0000013 | 0.0000085 | 0.0000064 | 0.0000048 |
| Dipole moment (Debye) | 1.60 | 2.22 | 1.77 | 2.67 | 2.95 | 2.95 | 1.13 | 1.13 |
Having carried out these optimisations to obtain the approximate geometries, a more thorough geometric optimisation method was used. This involved using a pseudo-potential for the Fe. Pseudo-potentials must be used due to heavier atoms having relativistic effects which are unable to be modelled correctly by the standard Schrodinger equation. The pseudo-potentials make up for these deficiencies. The final optimisation summaries are shown below. The method was kept the same, however the basis set was changed to 6-31g(d), with LANL2DZ used for the pseudo-potential. The isomers with the R=N(SiH3)2 after optimisation showed the same geometries, and therefore energies. This implied that there was no minimum energy associated with one of the isomers, implying the structure is a transition state. To confirm this, the axial dihedral angles were fixed and the optimisation run again.
| Molecule 1 | Molecule 2 | Molecule 3 | Molecule 4 | Molecule 5 | Molecule 6 | Molecule 7 | Molecule 8 | |
|---|---|---|---|---|---|---|---|---|
| File type | .log | .log | .log | .log | .log | .log | .log | .log |
| Calculation type | FOPT | FOPT | FOPT | FOPT | FOPT | FOPT | FOPT | FOPT |
| Calculation method | RB3LYP | RB3LYP | RB3LYP | RB3LYP | RB3LYP | RB3LYP | RB3LYP | RB3LYP |
| Basis set | Gen | Gen | Gen | Gen | Gen | Gen | Gen | Gen |
| Final energy (kcal/mol) | -641.55 | -641.55 | -859.17 | -859.17 | -1239.06 | -1239.06 | -1456.67 | -1456.67 |
| Gradient (au) | 0.000013 | 0.000048 | 0.000015 | 0.000014 | 0.0000041 | 0.0000057 | 0.000018 | 0.0000039 |
| Dipole moment (Debye) | 3.18 | 3.59 | 4.75 | 5.43 | 4.75 | 4.75 | 4.01 | 4.95 |
In each case, for each optimisation the RMS gradient was less than 0.001, giving an initial indication that the optimisation was complete. The 'real' .log output file was then viewed to ensure that the job had converged, again ensuring the values stated are very close to zero. As the number of optimisations were initially set to 50, this was an important aspect as there was a higher possibility that it would not complete the optimisation.
Upon comparison of the energies, it can be seen that the energies of the isomers 1-4 are equal, indicating degenerate structures. Comparing the energies of molecules 1-4 with molecules 5-8, the latter have much lower energies indicating they are much more stabilised. This is the case due to the strength of the π-donating ability of the R group. CH3 is a poor π-donor, and therefore does not have additional stabilisation, the only electronic stabilisation occurs due to weak Fe-E π-back-donation. N(SiH3)2 however is a good π-donor to E, and therefore stabilises the complex. The overall bonding in the complexes consist of strong σ-donation from the lone pair of E (B or Al) into the empty σ-orbitals of the Fe. Fe-ER π-back-donation is small due to the low electronegativity of B or Al, however it does occur and is important when R=CH3 due to the poor π-donating abilities. When R=N(SiH3)2 there is π-back-donation from R to E which massively stabilises the molecule.
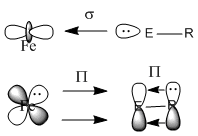
After analysis of the N(SiH3)2 complexes, it became apparent that the dihedral angle between E-Fe-Co(ax or eq depending on the isomer) needed to be fixed in order to obtain two different structures. After fixing the angles and re-calculating the optimisations, it was found that the Boron axial complex (Molecule 5) is actually a transition state towards the equatorial complex (and therefore is why upon optimisation the geometry changes to the equatorial one) and therefore will not be discussed in detail in this report. This is partially due to steric reasons-the axial isomer encounters steric repulsion between the N(SiH3)2 group and the equatorial CO ligands. The equatorial isomer however only exhibits steric repulsion between two axial CO ligands (the other equatorial CO ligands point away from it). For the Aluminium isomers, both were calculated yielding a lower energy and therefore the axial form is more stable, and therefore is not a transition state. The optimisation of the Al axial isomer was able to run, however the frequency and NBO analysis was unable to complete in the designated time, as an error was made and it did not converge. Due to the large number of jobs, the frequency and NBO analysis will still be pending by the hand in time, however the equatorial isomers have been able to be explored. All the B and Al complexes show a bending of the cis-CO ligand towards the ER group, known as an umbrella effect[31]. Moving from B to Al it can be seen that the bending angle decreases, due to the increase molecular weight.
Frequency Analysis
Vibrational and Frequency analysis was run using the same parameters as in the final optimisation. This was important to do in order to verify the energies obtained were in fact the minimum.
| Molecule 1 DOI:10042/to-6758 [32] | Molecule 2 DOI:10042/to-6757 [33] | Molecule 3 DOI:10042/to-6756 [34] | Molecule 4 DOI:10042/to-6755 [35] | Molecule 5 DOI:10042/to-6759 [36] | Molecule 7 DOI:10042/to-6760 [37] | |
|---|---|---|---|---|---|---|
| Optimised Energies kcal/mol | -641.55 | -641.55 | -859.17 | -859.17 | -1239.06 | -1456.67 |
| Frequency Analysis Energies kcal/mol | -641.55 | -641.55 | -859.17 | -859.17 | -1239.06 | -1456.67 |
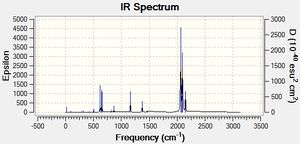
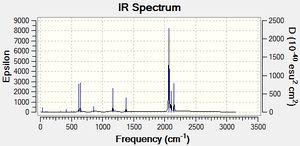
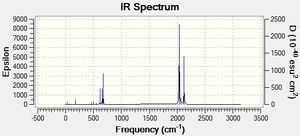
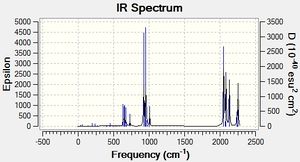
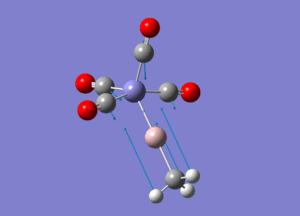
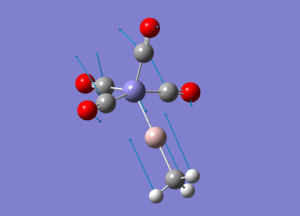
Judging by the frequency analysis energies the molecules were correctly optimised to their minimum energy conformations. Comparing the energies of the Boron complexes to the Aluminium complexes it can be seen that relatively, they have a higher energy, which supports that they are less stable. This can be partially explained by the increase in orbital overlap of Aluminium due to the larger orbitals, leading to a better sigma-donation from Al to Fe. Having looked at the real .log file, it can be seen that the Boron complexes all have one negative frequency. Further exploration was carried out and the vibrations of the negative frequencies were modelled, showing a rotation of the CH3 groups around the C-B bond and the C-Si group (see below). This rotation clearly occurs at a maximum of a potential energy surface and therefore is a transition state. As the frequency is moderate, it can be said that the rate of change on the PES is large. These really should be re-optimised, as they are clearly not at the lowest energy, however this was discovered too late to be able to run any more calculations (an attempt has been made however it has been in the job queue for ~21 hours now, so the likelihood of being able to do any calculations is minimal). An alteration was made to the attempt made - the H and the CO group (H-C-B-Fe-CO) were aligned in order to completely minimise the energy, although there is not enough time to be able to check if it worked. Having said that, as the negative frequencies occur on the R group rotation, it is possible to still analyse the molecule as the remainder appears (when comparing with literature) to be acceptable. As a result the rest of the results still refer to the Boron complexes as well as the Aluminium complexes. The computer generated IR spectra are below. Unfortunately there is no IR literature data on the molecules modelled, however the decrease in frequencies when changing the R group from CH3 to N(SiH3)2 can be seen (shown below in the table of equatorial -Al-CH3 and -Al-N(SiH3)2, Molecule 3 and 7 respectively). This is also explored in the Bond Length and Dihedral Angle section, so the frequency analysis is purely used for checking that the optimisations were successful.
 |
 |
 |
 |
 |
 |
 |
 |
 |
| Molecule 3 Image | Molecule 3 Frequencies (cm-1) | Molecule 3 Intensities | Molecule 7 Image | Molecule 7 Frequencies (cm-1) | Molecule 7 Intensities |
|---|---|---|---|---|---|
 |
307 | 0.61 | 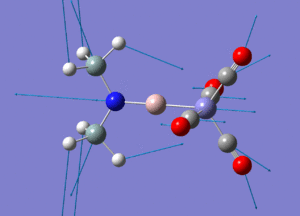 |
270 | 1.63 |
 |
645 | 16.29 | 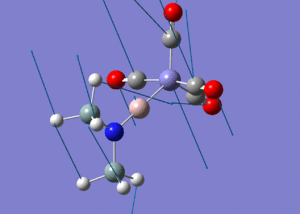 |
644 | 105.59 |
 |
681 | 202.8 | 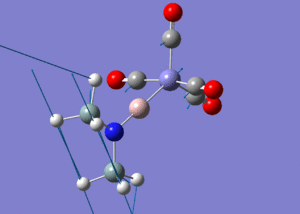 |
676 | 106.56 |
Bond Lengths and Dihedral Angles
Having optimised the geometries of the molecules in question, the dihedral angles and bond lengths were compared with literature data. For molecules 1-4, where the R group is CH3 the literature data is in fact for R=Ph, however the trends will be comparable. The literature data are given in parentheses following the Gaussian calculated bond lengths.
| Molecule 1 | Molecule 2 | Molecule 3 | Molecule 4 | |
|---|---|---|---|---|
| Fe-E (Angstroms) | 1.78 | 1.78 (1.800) | 2.19 (2.199) | 2.21 (2.206) |
| E-CCH3 (Angstroms) | 1.54 | 1.53 (1.515) | 1.96 (1.955) | 1.96 (1.952) |
| Fe-COax (Angstroms) | 1.78 | 1.84 (1.824) | 1.78 (1.782) | 1.78 (1.777) |
| Fe-COeq (Angstroms) | 1.81 | 1.78 (1.774) | 1.78 (1.777) | 1.78 (1.775) |
| E-Fe-COax (Degrees) | 78.33 | 180.00 (179.3) | 80.03 (78.4) | 179.91(179.4) |
| E-Fe-COeq (Degrees) | 125.67 | 85.83 (85.1) | 124.51 (125.4) | 85.87 (85.2) |
| Molecule 5 | Molecule 7 | Molecule 8 | |
|---|---|---|---|
| Fe-E (Angstroms) | 1.81 (1.818) | 2.20 (2.199) | 2.22 (2.211) |
| E-N (Angstroms) | 1.37 (1.382) | 1.80 (1.810) | 1.79 (1.802) |
| Fe-COax (Angstroms) | 1.78 (1.777) | 1.79 (1.782) | 1.78 (1.771) |
| Fe-COeq (Angstroms) | 1.80 (1.790) | 1.78 (1.777) | 1.78 (1.777) |
| E-Fe-COax (Degrees) | 79.57 (77.6) | 82.33 (80.2) | 176.45 (177.4) |
| E-Fe-COeq (Degrees) | 124.99 (125.7) | 122.99 (124.2) | 89.23 (86.1) |
The literature data fit quite well with the computer modelled bond lengths and angles. Any discrepancies can be attributed to a poorer optimisation basis set due to computer power and time constraints, and also that the R group on molecules 1-4 is in fact CH3 as opposed to Ph.
The Fe-E bond lengths for R=CH3 are slightly shorter than R=N(SiH3)2, shown in particular by the Fe-B bond lengths. This however is not the case for the Fe-Al bond lengths, which are roughly the same for both CH3 and N(SiH3)2. This indicates that B is more strongly bound to the iron with a poor π-donor than a rich one. It also indicates, supported by the bond lengths that Fe-Boron bond strengths are higher than Fe-Aluminium (as a stronger bond leads to a shorter bond length). The change in Fe-E bond strength is due to the more energetically accessible levels of the p-atomic orbitals on E. The general shortening of bond lengths is due to the larger π-back-donation in the former rather than the latter. This occurs as stated before, due to R-E π-back-donation dominating.
NBO and MO Analysis
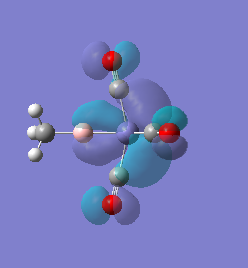
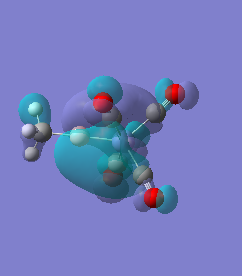
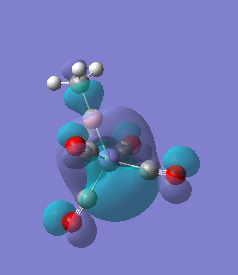
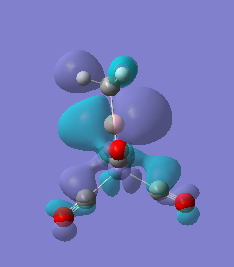
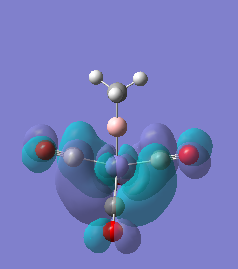
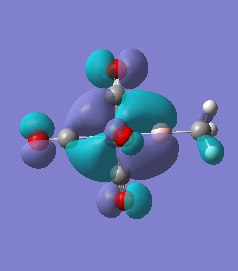
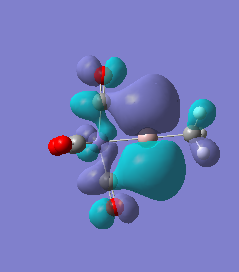
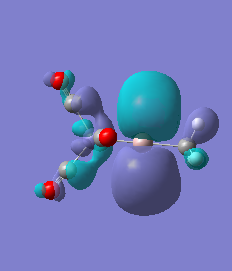
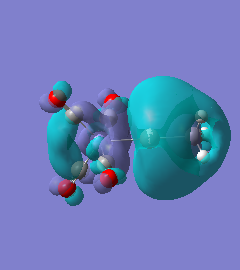
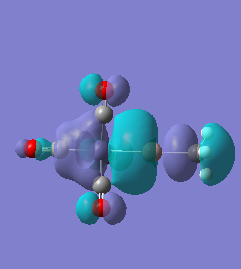
NBO and MO calculations were run on the molecules.
Molecule 1
 |
 |
 |
 |
 |
 |
 |
Molecule 2
 |
 |
 |
 |
 |
 |
 |
Molecule 3
 |
 |
 |
 |
 |
 |
 |
Molecule 4
 |
 |
 |
 |
 |
 |
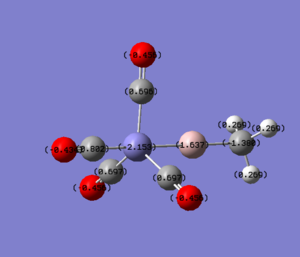 |
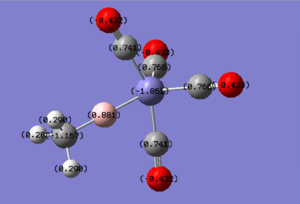
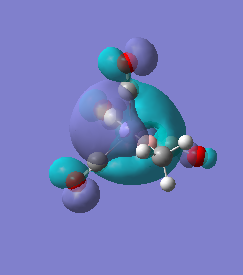
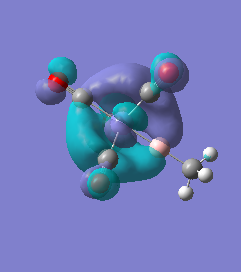
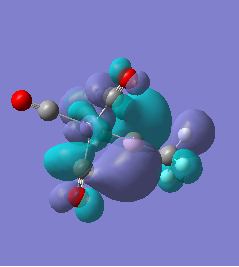
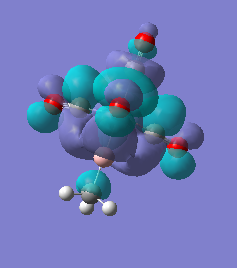
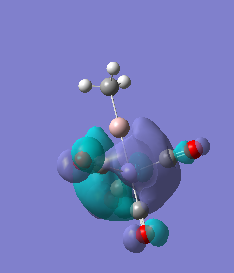
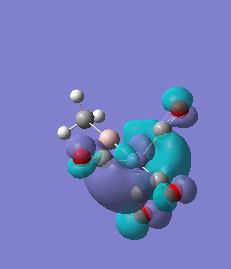
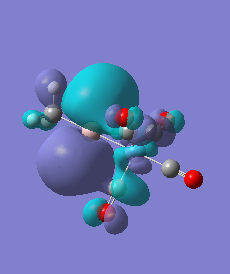
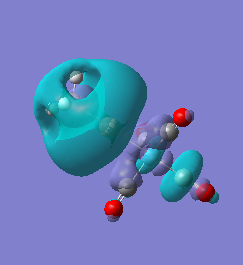
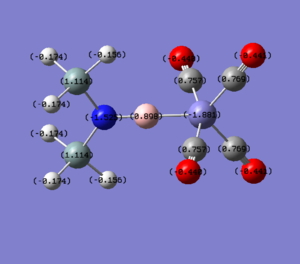
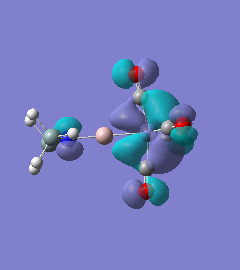
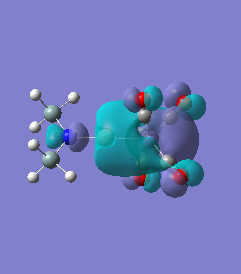
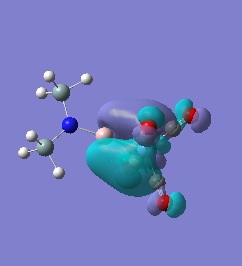
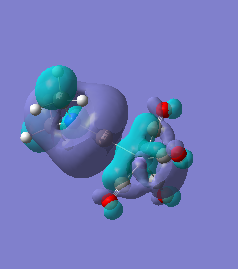
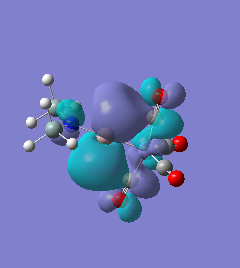
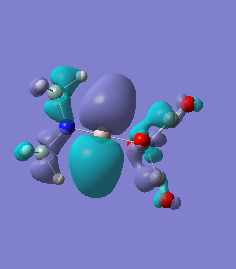
For molecules 1-4, as seen by the NBO charge distribution there are strong Coulombic attractions between the positively charged Boron and Aluminium, and the negativel y charged Iron. The p-atomic orbitals of the CH3 are populated, as shown by the MO diagrams. For the molecules 2 and 4 (the axial isomers) the out of plane p-atomic orbital has more of the electronic charge than the in plane p-atomic orbitals, whereas for molecules 1 and 3 (equatorial) it is the opposite. This again is illustrated by the MO diagrams above.
Molecule 5
 |
 |
 |
 |
 |
 |
 |
Molecule 7
 |
 |
 |
 |
 |
 |
 |
| Computer Generated Data | Molecule 1 | Molecule 2 | Molecule 3 | Molecule 4 | Molecule 5 | Molecule 7 |
|---|---|---|---|---|---|---|
| qFe | -1.861 | -1.921 | -2.137 | -2.153 | -1.881 | -2.157 |
| qE | 0.881 | 0.972 | 1.576 | 1.637 | 0.898 | 1.611 |
| qN of N(SiH3)2 | n/a | n/a | n/a | n/a | -1.525 | -1.832 |
| qSi of N(SiH3)2 | n/a | n/a | n/a | n/a | 1.114 | 1.113 |
| qH of N(SiH3)2 | n/a | n/a | n/a | n/a | -0.174 | -0.18 |
| qC of CH3 | -1.167 | -1.184 | -1.378 | -1.38 | n/a | n/a |
| qH of CH3 | 0.29 | 0.293 | 0.266 | 0.269 | n/a | n/a |
| qC of eq CO | 0.766 | 0.751 | 0.788 | 0.697 | 0.769 | 0.789 |
| qO of eq CO | -0.433 | -0.444 | -0.422 | -0.456 | -0.441 | -0.439 |
| qC of ax CO | 0.741 | 0.755 | 0.672 | 0.802 | 0.757 | 0.708 |
| qO of ax CO | -0.432 | -0.423 | -0.447 | -0.434 | -0.44 | -0.437 |
| Literature Data | Molecule 1 | Molecule 2 | Molecule 3 | Molecule 4 | Molecule 5 | Molecule 7 |
|---|---|---|---|---|---|---|
| qFe | -0.91 | -0.59 | -0.62 | -0.6 | -0.58 | -0.63 |
| qE | 0.66 | 0.65 | 1.2 | 1.27 | 0.9 | 1.23 |
| qN of of N(SiH3)2 | n/a | n/a | n/a | n/a | -1.49 | -1.79 |
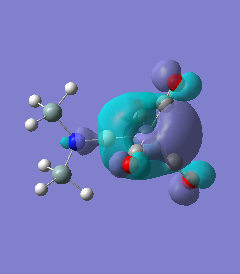
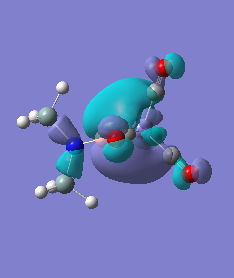
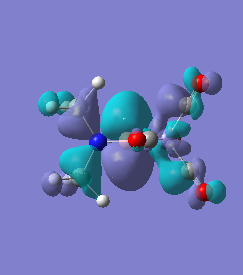
The NBO charge distributions show large positive charges on the B and Fe, as per previously, and large negative charges on the Fe, thus showing ionic character. As stated in previous discussion it can be seen that between Al and B, the largest covalent involvements come from the π-back donation of Fe to B, hence re-iterating that the Fe-B bond is stronger than the Fe-Al bond. When complexed, the in plane p-atomic orbital of B and Al are highly occupied, and possibly even higher occupied than the out of plane p-atomic orbital, and therefore hold a majority of the electronic charge. As this occurs in both equatorial and axial, unlike previously when it only occurred in the equatorial (the axial was the opposite), it highlights the presence of π-back-donation from N(SiH3)2 to the B/Al.
Comparing the results obtained with the literature values, it can be seen that there are differences in the CH3 values, due to the fact that the literature values are actually for Ph. The main differences appear to be on the Fe. This is because of the calculation, it is difficult to compute heavy atoms therefore a pseudo-potential must be used, which is inaccurate in comparison to literature values. However, the other values are in good agreement with the literature.
Conclusion
Having carried out these analysis – even though the methods used were optimised for faster running times over accuracy, the results were still comparable with the literature data. Initially, although not really able to see on the results above, the axial conformer is more unstable than the equatorial, due to steric reasons. The bonding between Fe and E changes from B to Al, due to a better σ-overlap of the more diffuse Al-atomic orbitals, generally making the overall complex more stable. Upon changing the ligand from a bad π-donor to a good π-donor, the Fe-E bond weakens due to π-back donation from Fe to the E p-orbitals being overcome by backdonation of the R group to the E p-orbitals instead. This is seen in the bond lengths and the charge densities of the molecules.
Discussion
The various exercises highlight the fact that computer modelling is a very successful way of getting much of data from a molecule, without doing any experimental techniques. However it is always good to compare with empirical results because as seen above there are limitations to the methods, i.e. having to use pseudo-potentials on heavier atoms. These can be overcome by more complex and accurate computer modelling programs, however they will have longer running times and costs which can be problematic, specifically in this exercise where time was an issue due to the number of students running calculations on the last few days, therefore a fine balance must be achieved.
References
- ↑ M. S. Schuurman et al, J. Computational Chemistry, 2005, 26, 1106-1112. DOI:10.1002/jcc.20238
- ↑ DOI:10042/to-6521
- ↑ J. Glaser, G. Johansson, Acta Chemica Scandinavica, 1982, 36, 125-135. DOI:10.3891/acta.chem.scand.36a-0125
- ↑ L. Pauling, The Nature of the Chemical Bond, 1931, 53, 1367-1400. DOI:10.1021/ja01355a027
- ↑ DOI:10042/to-6567
- ↑ DOI:10042/to-6571
- ↑ DOI:10042/to-6582
- ↑ DOI:10042/to-6584
- ↑ F. A. Cotton et al, J. Inorganic Chemistry, 1982, 21, 294-299. DOI:10.1021/ic00131a055
- ↑ G. Hogarth, T. Norman, Inorganica chimica Acta, 1997, 254, 167-171. DOI:10.1016/S0020-1693(96)05133-X
- ↑ DOI:10042/to-6624
- ↑ DOI:10042/to-6625
- ↑ F. A. Cotton et al, J. Inorg. Chem, 1982, 21, 2661-2666. DOI:10.1021/ic00137a026
- ↑ J. Udden et al, J. Organometallics, 2000, 19 571-582. DOI:10.1021/om990936k
- ↑ DOI:10042/to-6715
- ↑ DOI:10042/to-6716
- ↑ DOI:10042/to-6713
- ↑ DOI:10042/to-6714
- ↑ DOI:10042/to-6718
- ↑ DOI:10042/to-6721
- ↑ DOI:10042/to-6722
- ↑ DOI:10042/to-6723
- ↑ DOI:10042/to-6724
- ↑ DOI:10042/to-6716
- ↑ DOI:10042/to-6725
- ↑ DOI:10042/to-6726
- ↑ DOI:10042/to-6717
- ↑ DOI:10042/to-6861
- ↑ DOI:10042/to-6731
- ↑ DOI:10042/to-6860
- ↑ P. A. Duffin et al, J. Inorganic Chemistry, 1987, 26, 2034-2040. DOI:10.1021/ic00260a006
- ↑ DOI:10042/to-6758
- ↑ DOI:10042/to-6757
- ↑ DOI:10042/to-6756
- ↑ DOI:10042/to-6755
- ↑ DOI:10042/to-6759
- ↑ DOI:10042/to-6760
- ↑ DOI:10042/to-6902
- ↑ DOI:10042/to-6901
- ↑ DOI:10042/to-6898
- ↑ DOI:10042/to-6897
- ↑ DOI:10042/to-6899
- ↑ DOI:10042/to-6900

