Rep:Mod:zillakilla
The Dimerisation of Cyclopentadiene
Cyclopentadiene dimerises to produce two possible products, the endo dimer and the exo dimer. The distribution of products is a result of the Diels Alder reaction between two cyclopentadiene molecules, via an endo or exo attack. The endo rule states the endo attack reaction proceeds via a more stable transition state than the exo attack, even if the exo product is more thermodynamically stable. By optimising the geometries using ChemBio3D and the Molecular Mechanics method (MM2) the energies, and hence the relative stabilities of the possible products can be determined. This will indicate whether the reaction proceeds via a kinetically or thermodynamically controlled pathway.
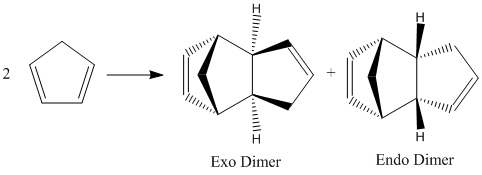
The energies calculated from the MM2 optimisation are shown below:
| Endo product | Exo product | |
|---|---|---|
| Energy (kcal/mol) | 34.00 | 31.88 |
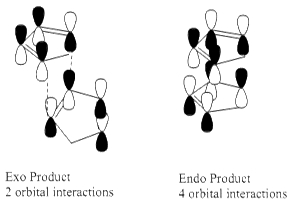
The energies show that the Endo dimer has a higher energy than the Exo dimer, and therefore the Exo dimer is the thermodynamically stable product. As the major product for this reaction is the Endo Dimer due to increased favorable orbital overlaps compared to the Exo dimer, it can be deduced that the reaction proceeds via the kinetically controlled Endo attack, overriding the thermodynamically controlled Exo product formation.
Molecular mechanics approach also is unable to compute the secondary orbital interactions of the Endo product, which do not exist for the Exo product, thus again, the kinetic Eno product is produced over the Exo product.[1]
The Hydrogenation of Cyclopentadiene Dimer
There are two possible products for the Hydrogenation of the Endo Dimer;
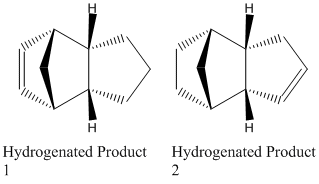
The geometries of these two possible products were then optimised using ChemBio 3D and MM2 giving;
| Product 1 | Product 2 | |
|---|---|---|
| Stretch | 1.28 | 1.10 |
| Bend | 19.86 | 14.52 |
| Torsion | 10.81 | 12.50 |
| Van der Waals | 5.63 | 4.51 |
| Dipole/dipole | 0.16 | 0.14 |
| Energy (kcal/mol) | 35.69 | 31.15 |
The MM2 minimisation of energies has shown that the total energy for Product 2 is lower than that for Product 1 by 4.54 kcal/mol, therefore Product 2 is the thermodynamic product, whereas Product 1 is the kinetic product. The main contributors to this difference in energy are the bending strain and the torsional strain (VdW forces also, however these are less so). As shown in the above table, both are higher in energy for Product 1, and therefore lead to an overall higher energy. The C=C bond hydrogenation releases the strain on the double bond. The double bond of Product 2 is clearly more strained, as the release of higher strain leads to a lower overall energy, and the release of the more strained double bond is thermodynamically preferred and therefore Product 2 is the major product.
Stereochemistry of Nucleophilic Additions to a Pyridinium Ring (NAD+ Analogue)
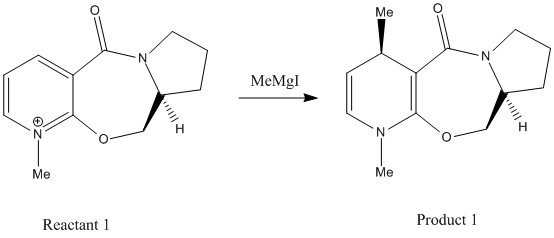
The following two nucleophilic attacks on a Pyridinium NAD+ will be investigated; Firstly Reaction 1 involving the optically active derivative of prolinol (Reactant 1) reacting with methyl magnesium iodide to alkylate the pyridine ring in the 4-position (Product 1):
Secondly Reaction 2 involving a derivatisation of the pyridinium ring (Reactant 2) by a reaction with analine, forming the product (Product 2):
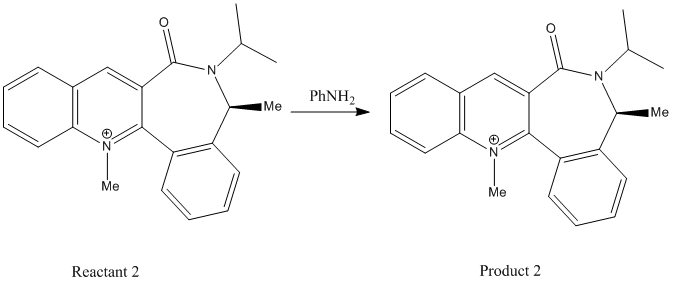
The mechanism of nucleophilic attack and therefore the stereochemical outcome of the product depends on the geometry of the reactant, which we will determine by optimising the energies of the different possible conformations via MM2. The minimum energy generated is only one of many possible energies, which is why it is important to change the structure of the molecule in question after the MM2 has run in order to be sure the energy obtained is in fact the minimum. A way to overcome this is to plot all possible energy conformations and view the minimum, or take the average of a few of the common low energies. This however would need higher power computer programs such as Gaussian, and therefore are not applicable here.
Reaction 1
Using the MM2 force field, the optimal geometry of Reactant 1 was determined. Different geometries of the molecule were tried, moving the carbonyl oxygen, the oxygen in the 7-membered ring and the furthest carbon in the 5-membered rings, ensuring to maintain the geometric integrity of the molecule. The final geometry chosen was the one with the lowest energy. A few examples of the optimisations are below.
| Start Geometry | End Geometry | Energy (kcal/mol) | Dihedral Angle (Degrees) |
|---|---|---|---|
| 43.10 | 10.14 | ||
| 43.10 | 10.14 | ||
| 43.10 | 10.15 | ||
| 161.29 | -124.90 | ||
| 43.10 | 10.13 | ||
| 44.60 | 12.38 |
The optimised energies show that the preferred conformation is that shown in the jmol of the geometries where the energy is 43 kcal/mol. The positive dihedral angle of approximately 10.1o means the carbonyl oxygen lies slightly above the plane of the aromatic ring. This affects the stereochemistry, as the Magnesium (electrophilic part) of the Grignard reagent will initially co-ordinate to the carbonyl oxygen leaving it on the top face of the molecule. This leaves the methyl group to undergo nucleophilic addition to the top face of the pyridinium ring. Once the addition has occurred, the electrophilic part of the Grignard will also add, however this would not work with the ChemBio3D software, but refinements could be made if it were possible.

Reaction 2
Using the MM2 force field, the optimal geometry of Reactant 2 was also calculated. Different geometries of the molecule were obtained by changing the position of both the carbonyl group and the tertiary nitrogen group, again maintaining the geometric integrity of the molecule. Each conformation gave different total energies, dihedral angles and overall geometry, pivotal in the mechanism of the reaction. The final geometry chosen was the one with the lowest energy. A few examples of the optimisations are below.
| Start Geometry | End Geometry | Energy (kcal/mol) | Dihedral Angle (Degrees) |
|---|---|---|---|
| 62.57 | -19.87 | ||
| 182.15 | 119.24 | ||
| 62.57 | -19.87 | ||
| 62.57 | -19.87 | ||
| 62.57 | -19.87 |
The optimised energies show that the preferred conformation is that where the energy is 62 kcal/mol. The negative dihedral angle of approximately -19.9o indicates the carbonyl group lies below the plane of the aromatic ring. The nucleophile adds again to the top face of the molecule (as indicated below), opposite to the carbonyl group. Steric repulsion between the electron dense Analine nucleophile and the electron rich carbonyl group dictates that the attack will occur on the opposite face to the carbonyl group in order to reduce the repulsive coulombic forces, in the mechanism shown below.

Stereochemistry and Reactivity of an Intermediate in the Synthesis of Taxol
The key intermediate in the synthesis of Taxol can be synthesised with the carbonyl group pointing up or down. The two isomers are shown below, and are an example of atropisomerism (when normally free rotation about a single bond is hindered due to steric demand, creating different stereoisomers). The limited rotation between the cyclohexane ring and the carbonyl group form the possible two isomers shown below.
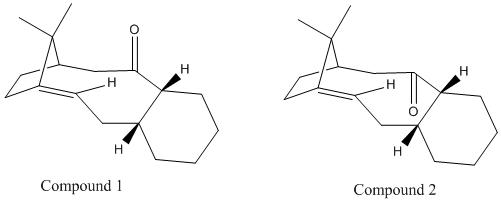
Through the application of MM2 force field, the thermodynamically stable isomer will be determined and therefore the relative stabilities can be compared (see below table).
| Intermediate 1 | Intermediate 2 | |
|---|---|---|
| Stretch | 2.68 | 2.55 |
| Bend | 15.84 | 10.77 |
| Torsion | 18.21 | 19.72 |
| Van der Waals | 12.65 | 12.58 |
| Energy (kcal/mol) | 48.87 | 44.31 |
| MMFF94 Energy (kcal/mol) | 70.58 | 66.40 |
Shown in the table above, the energies calculated by both MM2 and MMFF94 calculations indicate that Intermediate 2 has the lower energy which corresponds to when the carbonyl group points down rather than up. The lowest energy conformation was ensured by running an initial MM2 optimisation, followed by manual changing of the atoms in ChemBio3D to ensure a chair conformation for the cyclohexane ring, which is the known minimum energy conformation. As shown in the jmol for both Intermediate 1 and 2 this chair conformation was kept in the optimisation to the lowest energy.
Running the MMFF94 field produced similar results, although at different magnitudes. The results did however indicate Intermediate 2 to be the lower energy and therefore more stable isomer, and also the energy difference between the two was very similar to MM2 field optimisations (4.18 kcal/mol MMFF94 vs 4.56 kcal/mol MM2).
The slow reactivity of the of the alkene can be attributed to their hyperstability. Olefinic strain energies can be calculated by subtracting the total strain of the most stable parent hydrocarbon from the total strain energy of the most stable alkene. For usual alkenes, stability is reflected by lower olefin strain energy values, and this stability increases as the alkene isomerises. This is the opposite for hyperstable alkenes - "medium sized polycyclic ring systems with bridgehead double bonds possessing negative olefin strain energies". They have low heats of hydrogenation, some resisting hydrogenation completely. The intermediate isomers fall into the category of hyperstable alkenes due to the conformations of the molecules - hydrogenating the double bond from sp2 to sp3 would increase strain, resulting in a negative olefin strain energy and therefore the alkene is slower to react that initially expected. [2]
Modelling Using Semi-empirical Molecular Orbital Theory
The molecule below is used to illustrate how important it is to consider how electrons in molecules influence bonds and spectroscopic properties.
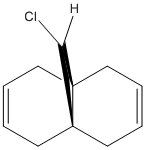
Using the Molecular Force Field Method the energy was minimised yielding the results;
| Molecule 1 MM2 Optimised | |
|---|---|
| Stretch | 0.62 |
| Bend | 4.73 |
| Torsion | 7.66 |
| Van der Waals | 5.79 |
| Energy (kcal/mol) | 17.89 |
Following the MM2 optimization, the MOPAC/PM6 method was run to provide a visual representation of the valence electron wavefunctions. The energy resulting from this method was;
| Energy (kcal/mol) |
|---|
| 19.74 |
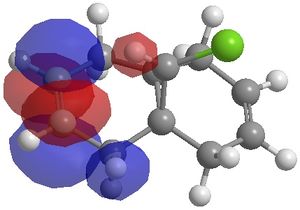
The MO's calculated using this method were;
 |
 |
 |
 |
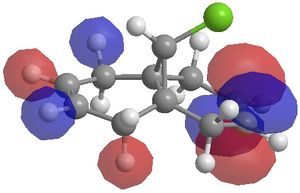 |
The MO's generated above can be used to illustrate orbital control of reactivity, specifically for the reaction of Molecule 1 with electrophilic reagents, for example dichlorocarbene or peracid. Indeed the MOPAC/PM6 method does discriminate between the two alkene bonds. It can be seen from the HOMO that there is a higher electron density on the alkene endo to the chlorine atom. As a result, electrophilic reactions such as the cycloaddition reaction with dichlorocarbene, will occur preferentially on the endo alkene rather than the exo alkene.
The influence of the exo alkene bond on the vibrational frequencies of the C-Cl bond can be demonstrated by comparing the stretching frequencies of Molecule 1 with the hydrogenated product (hydrogenation of the exo-double bond), Molecule 2;
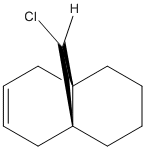
The MM2 optimisation was performed on Molecule 2 yielding;
| Energy (kcal/mol) |
|---|
| 24.78 |
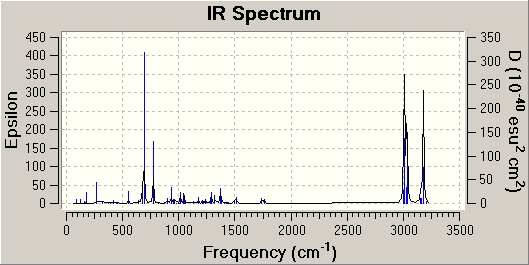
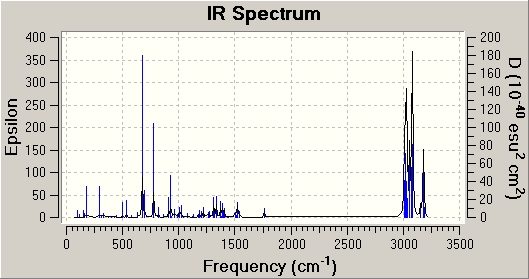
To compare the vibrational frequencies both Molecule 1 and 2 were viewed in GaussView, where the predicted IR can be viewed and the stretching frequencies of the alkenes and the C-Cl bond can be determined.
 |
 |
| Molecule 1 | Molecule 2 | |
|---|---|---|
| C-Cl stretch frequency (cm-1) | 772.54 | 777.0 |
| Exo C=C (Mol 1) / C-C (Mol 2) stretch frequency (cm-1) | 1740.9 | N/A |
| Endo C=C stretch frequency (cm-1) | 1761.0 | 1761.7 |
From the comparison table it can be seen that carbon-chlorine bond stretching frequency has increased by approximately 4.5cm-1 in the hydrogenated molecule. This increase in stretching frequency can be attributed to an increase in C-Cl bond strength. The presence of an exo alkene allows an overlap between the πC-C and the σ*C-Cl orbitals. This overlap will weaken the bond, by increasing its antibonding nature. As this orbital overlap is not present in the hydrogenated molecule, the C-Cl bond is relatively stronger and therefore has a higher stretching frequency. The two endo C=C stretching frequencies are relatively similar, which is what is expected. The exo C=C stretching frequency however is present in the diene (molecule 1) whereas is not present in the hydrogenated molecule (molecule 2). This is in keeping with the expected results, as there is no longer an exo C=C bond to give rise to the stretching frequencies. The frequency of the exo C=C stretch is lower than the endo C=C stretch, indicating a weaker bond. This agrees with the MO diagrams above, with the HOMO indicating a higher electron density on the endo alkene, and thus a stronger bond.[3]
Structure Based Mini Project using DFT-based Molecular Orbital Methods
The reaction I have chosen for my mini product is the synthesis of 4-(methoxycarbonylmethyl)-2-phenyl-1-(p-toluenesulfonyl)piperidine using tris(trimethylsilyl)silane (TTMSS). All literature references refer to this cited paper. [4]
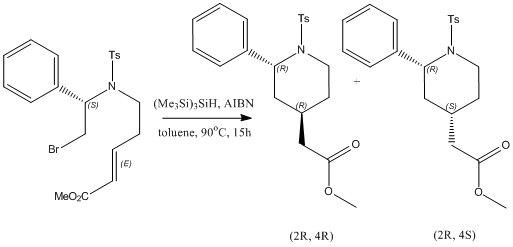
The reaction was performed by syringe pump addition of toluene solutions of (Me3Si)3SiH and AIBN to a solution of the bromide above in toluene, and heated to 90oC. This was the maintained at 90oC for 15 hours, after which the pure samples of the separate isomers (the (2R, 4R)-isomer (isomer 1) and the (2R, 4S)-isomer (isomer 2)) were isolated by preparative HPLC with a water-methanol gradient. Under the specified reaction conditions, the reaction yielded an isomer 1:isomer 2 ratio of 79:21, with a 75% yield.
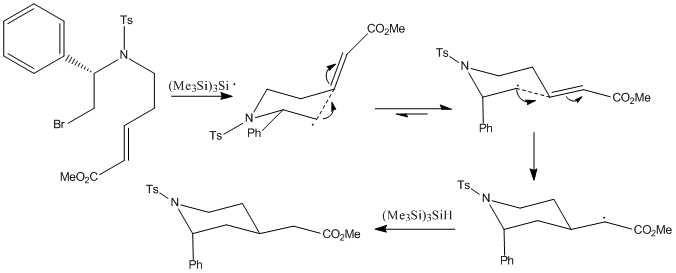
The mechanism proceeds two ways to the major diastereomer (isomer 1) and to the minor diastereomer (isomer 2).
 |
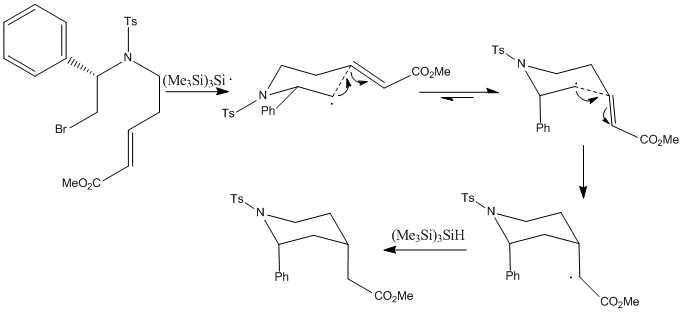 |
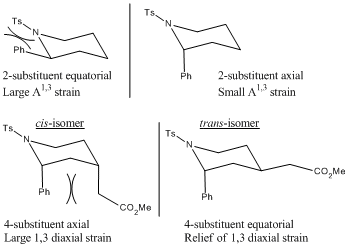
The major diastereomer has an axial 2-substituent and an equatorial 4-substituent. This is dictated by the stereochemistry of the chair-like transition state, formed by the cyclisation of the radical. The 2-substituent adopts the pseudoaxial position, minimising the pseudo A1,3 strain with the tosylate group. The double bond acceptor adopts the pseudoequatorial position, minimising 1,3-diaxial interactions.
The minor diastereomer has both 2-substituent and 4-substituents in axial positions. This is dictated by the psuedoaxial positions of the 2- and 4- substituents in the chairlike transition state. The low amounts of the cis product is due to increased 1,3-diaxial interactions, therefore preferring the conformation of isomer-1 over isomer-2, contrary to the energy calculations shown below, indicating that isomer-2 is by a small amount the thermodynamically favourable product. This shows that the steric interactions hold control over the reaction, as opposed to it being under thermodynamic control.[5]
The interesting aspect of this reaction is the use of tris(trimethylsilyl)silane. It can also be carried out using tributyltin hydride (TBTH), which gives a lower yield. This is attributed to the strength of the Si-H bond vs the Sn-H bond. The rate constant for the H-atom donation to the radical is less for TTMSS than for TBTH, therefore decreasing the production of the uncyclised radical byproduct. An interesting property of TTMSS vs TBTH is that often, depending on the nature of the 2-substituent, the reaction undergoes selective loss of the minor stereoisomer during the radical chain reactions through side reactions. These side reactions are known as Smiles rearrangements, which are intramolecular nucleophilic aromatic rearrangements.[6] Although this leads to a decrease in yield, the ratio of major to minor products increases quite significantly. The rearrangements work best with secondary and benzylic substituents - those able to stabilise the radical.
Energy Minimisation of the Products
As per the methods throughout this report, the molecules were modelled on ChemBio3D and the MM2 field was used to minimise the energy, following which it was optimised using Gaussian. Of course the first minimisation was not necessarily the correct conformation, so manual edits of the molecule following the first optimisation were carried out, including ensuring the central piperidine ring had adopted the most stable chair-conformation, all the while ensuring the integrity of the molecules remained the same to ensure they were still the different isomers. The results were as follows;
| Isomer 1 (Major Product) | Isomer 2 (Minor Product) | Energy Difference (kcal/mol) | |
|---|---|---|---|
| MM2 Calculated Energy (kcal/mol) | 25.67 | 24.74 | 0.93 |
| Gaussian Calculated Energy (Hartrees) | -984378.71 | -984384.58 | 5.87 |
As shown by the energies above, the minor product actually has the lower energy of the two, although only marginally. The reaction is therefore mainly governed by steric factors. Usually substituents on six membered rings prefer equatorial conformations, therefore the axial position of the 2-substituent is odd. This conformation is energetically favourable due to the minimisation of A1,3 strain. The preferrential conformation of the 4-substituent is a result of the 1,3-diaxial interaction between it and the axial 2-substituent. The equatorial conformation minimises this interaction, and hence the trans conformer is more favourable.
13C NMR Analysis
Using the process of conformational optimisation and energy minima via Gaussian, it is possible to then predict the 13C NMR of the products. The literature 13C NMR were run in CDCl3. The literature spectra are shown below, with the tabulated values of literature versus the Gaussian calculated chemical shifts and their assignments.
 |
 |
The spectra generated by the Gaussian method are shown below.
 |
 |
The literature chemical shifts were compared against the Gaussian generated chemical shifts. These were assigned using the carbon numbering on the products shown below:
| Major Product (1) | Minor Product (2) |
| Atom # | Lit Major Product (ppm) | Predicted Minor Product (ppm) | Difference (ppm) | Atom # | Lit Minor Product (ppm) | Predicted Major Product (ppm) DOI:10042/to-6485 [7] | Difference (ppm) | Lit major/minor Differences (ppm) | Predicted major/minor Differences (ppm) DOI:10042/to-6489 [8] | ||
|---|---|---|---|---|---|---|---|---|---|---|---|
| 17 | 21.6 | 22.8 | 1.2 | 18 | 21.6 | 22.7 | 0.0 | -0.1 | |||
| 2 | 27.6 | 28.3 | 0.7 | 3 | 30.3 | 29.4 | 0.9 | 2.7 | 1.1 | ||
| 23 | 30.7 | 31.2 | 0.5 | 24 | 30.9 | 31.1 | 0.2 | 0.2 | -0.1 | ||
| 3 | 33.1 | 33.0 | 0.1 | 4 | 39.5 | 36.6 | 2.9 | 6.4 | 3.6 | ||
| 22 | 40.9 | 37.0 | 3.9 | 23 | 39.7 | 39.2 | 0.5 | -1.2 | 2.2 | ||
| 1 | 41.4 | 38.6 | 2.8 | 2 | 44.9 | 39.7 | 5.2 | 3.5 | 1.1 | ||
| 27 | 51.6 | 51.2 | 0.4 | 27 | 51.7 | 53.3 | 1.6 | 0.1 | 2.1 | ||
| 4 | 55.1 | 54.9 | 0.2 | 5 | 60.8 | 54.8 | 6.0 | 5.7 | -0.1 | ||
| 10 | 127.0 | 122.2 | 1.9 | 11 | 127.4 | 124.2 | 3.2 | 0.4 | 2.0 | ||
| 8 | 122.8 | 9 | 124.4 | ||||||||
| 9 | 127.0 | 122.8 | 1.3 | 7 | 127.4 | 124.4 | 3.0 | 0.4 | 1.6 | ||
| 14 | 123.4 | 20 | 124.5 | ||||||||
| 18 | 127.1 | 125.1 | 0.5 | 16 | 127.8 | 124.7 | 3.1 | 0.7 | -0.4 | ||
| 7 | 125.5 | 10 | 125.2 | ||||||||
| 19 | 128.8 | 125.7 | 8.4 | 8 | 128.2 | 126.2 | 2.0 | -0.6 | 0.5 | ||
| 15 | 125.7 | 15 | 126.7 | ||||||||
| 6 | 129.9 | 126.6 | 3.3 | 19 | 129.4 | 128.6 | 0.8 | -0.5 | 2.0 | ||
| 13 | 138.5 | 136.9 | 1.6 | 14 | 135.9 | 135.3 | 0.6 | -2.6 | -1.6 | ||
| 5 | 138.7 | 137.2 | 1.5 | 6 | 141.6 | 137.3 | 4.3 | 2.9 | 0.1 | ||
| 16 | 143.2 | 141.2 | 2.0 | 17 | 143.2 | 141.5 | 1.7 | 0.0 | 0.3 | ||
| 24 | 172.5 | 171.4 | 1.1 | 1 | 172.6 | 172.6 | 0.0 | 0.1 | 1.2 |
The products to be optimised are very flexible molecules. This makes it difficult for Gaussian to optimise the geometries with a high accuracy, as a more powerful computer and longer calculation time is needed. However, because after each optimisation the structure was checked, and the functional groups in question were aligned as expected, the results are still useful to differentiate between the two isomers. The carbons which will be the most influential for differentiation between the two stereoisomers have been identified and are shown in the table below, and therefore any discontinuities between the remaining NMR shifts between the literature data and the computer generated can be discounted, as the geometries of these carbons will not affect the chemical shift of the carbons in question.
Again, using the carbon number assignments shown on the jmols:
| Major Product (1) | Minor Product (2) |
| Atom # | Lit Major Product (ppm) | Predicted Minor Product (ppm) | Atom # | Lit Minor Product (ppm) | Predicted Major Product (ppm) | Lit major/minor Differences (ppm) | Predicted major/minor Differences (ppm) | ||
|---|---|---|---|---|---|---|---|---|---|
| 1 | 41.4 | 38.6 | 2 | 44.9 | 39.7 | 3.5 | 1.1 | ||
| 2 | 27.6 | 28.3 | 3 | 30.3 | 29.4 | 2.7 | 1.1 | ||
| 3 | 33.1 | 33.0 | 4 | 39.5 | 36.6 | 6.4 | 3.6 | ||
| 4 | 55.1 | 54.9 | 5 | 60.8 | 54.8 | 5.7 | -0.1 | ||
| 5 | 138.7 | 137.2 | 6 | 141.6 | 137.3 | 2.9 | 0.1 |
The carbons highlighted above have a differing chemical shift moving from Product 1 to Product 2 due to the 1,3-diaxial interaction between the ester and the phenyl group. The change in chemical shift on the phenyl group can be attributed to the presence of the carbonyl oxygen, deshielding the carbons closest to it. This is also shifted due to the slightly closer presence of the CH2 group. This is also the case for the carbons on the piperidine group also close to the carbonyl oxygen. The combination of the ester and phenyl group will effect the carbons ipso and ortho to both, therefore a change in ppm will be seen.
Overall, the major contributor to the change in chemical shifts is the carbonyl oxygen will cause a shift lower field in the highlighted carbons, and therefore the different isomers can be identified using C13 NMR.
1H NMR Analysis
| Lit Major Product Peak (ppm) | Assignments | Lit Minor Product Peak (ppm) | Assignments | |
|---|---|---|---|---|
| 0.95-1.04 | m, 1H | 1.33-1.46 | m, 1H | |
| 1.24-1.35 | m, 1H | 1.58-1.71 | m, 1H | |
| 1.39-1.46 | m, 1H | 1.80-1.99 | m, 3H | |
| 1.88-2.14 | m, 3H | 2.08-2.22 | m, 2H | |
| 2.30-2.37 | m, 1H | |||
| 2.42 | s, 3H | 2.4 | s, 3H | |
| 2.91-3.02 | m, 1H | 3.02-3.12 | m, 1H | |
| 3.61 | s, 3H | 3.59 | s, 3H | |
| 3.84-3.93 | m, 1H | 3.83-3.92 | m, 1H | |
| 5.28-5.37 | m, 1H | 4.13 | dd, J=4.1, 9.6 Hz, 1H | |
| 7.18-7.39 | m, 7H | 7.18-7.25 | m, 7H | |
| 7.75 | d, J=8.1Hz, 2H | 7.45 | d, J=8.1 hz, 2H |
Having compiled the literature results of the 1H NMR, they are not very helpful in determining whether the isomers are cis- or trans-. The J couplings do not help as the phenyl and ester group are not vicinal or geminal, and there are two hydrogens in these neighbouring positions therefore any data obtained will not help in differentiating between the two products. The only indicative chemical shifts are those for the hydrogens on the piperidine ring opposite to the phenyl group. The shifts appear at a higher ppm on the minor product spectrum, indicating a slight deshielding effect. This is possibly due to the carbonyl group, upon isomerisation is closer to the piperidine ring than previously, and therefore slightly deshields the hydrogens. This however is not enough data to concretely determine which isomer is which, and therefore must be used in conjunction with the other spectral techniques.
IR Analysis
The IR spectra of both the Major and Minor products were also modelled using the Gaussian technique. These results were compared to the literature data, and determined if the data can be used for differentiation between the two isomers. The computer generated spectra are shown below, and a table of comparison between literature data and computer generated data of important peaks.
 |
 |
| Peak Assignment | Lit Major Product Peaks (cm-1) | Predicted Major Product Peaks (cm-1) | Lit Minor Product Peaks (cm-1) | Predicted Minor Product Peaks (cm-1) | |
|---|---|---|---|---|---|
| Carboxy Group Neighbour C-H Asymmetric Stretch | 3062 | 3064 | 3138 | ||
| Piperidine C-H Symmetric Stretch | 3026 | 3027 | 3030 | 3038 | |
| CH3 Stretch | 2950 | 2950 | |||
| Carboxy Group Neighbour C-H Symmetric Stretch | 2873 | 3025 | 3032 | ||
| C=O Stretch | 1735 | 1839 | 1735 | 1827 | |
| Ts group C-C bend | 1599 | 1628 | 1598 | 1628 | |
| R-O-CH3 bend | 1496 | 1494 | 1494 | 1495 |
Although the computer generated models are not the best fit to the literature data, they still show the relative frequencies between isomers, and also the significant peaks are in accordance with the literature (barring minor errors). The important peaks used for distinguishing between the two products are as follows:
| Peak Assignment | Lit Major Product Peaks (cm-1) | Predicted Major Product Peaks (cm-1) | Lit Minor Product Peaks (cm-1) | Predicted Minor Product Peaks (cm-1) | |
|---|---|---|---|---|---|
| Carboxy Group Neighbour C-H Asymmetric Stretch | 3062 | 3064 | 3138 | ||
| Carboxy Group Neighbour C-H Symmetric Stretch | 2873 | 3025 | 3032 |
As seen on the tables the major differences between the spectra are the apparent disappearance of two peaks at 3062 cm-1 and 2873 cm-1. These were assigned to the Asymmetric and Symmetric stretch of the C-H neighbouring the carboxy group. Upon further investigation using the predicted spectrum and the vibrational animations on Gaussview an approximate peak on the minor product spectrum was found. As shown the peaks responsible are of higher frequency, due to the steric effects of the cis-isomer in close proximity to the phenyl group. The presence of these peaks shifted to different frequencies from one spectrum to the other is therefore indicative of which isomer is being studied. As a result the IR can be used in conjunction with NMR to determine which isomer is which, and therefore which is the major product and which is the minor.
Discussion
Having carried out computer modelling on both the major and the minor products, it does appear that the literature made the correct assignments of the trans-isomer for the major product and cis-isomer for the minor product. The theory behind the prediction of major:minor ratio does hold true - the fact that 1,3-diaxial sterics dictate that the trans-isomer is conformationally favourable due to a minimisation of this energy. The 13C NMR spectra and the IR spectra appear to be the best spectral techniques studied to distinguish between the two products, as they show the effects of the 1,3-diaxial energy increase upon isomerisation to the cis-product. 1H NMR is not so effective as the ppm shifts are too fine to distinguish. In order to unequivocally determine which isomer is which, X-Ray crystallography must be performed. This is difficult due to the low crystallinity of piperidines, however the literature states this product was possible to determine through single-crystal X-ray analysis. In hindsight the flexibility of the molecule did slightly hamper the process; the calculations were significantly longer than for a smaller molecule, and the conformations were not as precise as they could be. Had a more powerful computer been used, with a longer calculation time these issues would have been eliminated. However, the results obtained were comparable where the differences were expected.
Conclusion
It has been shown that through computational modelling it is possible to predict the geometries, and therefore calculate the lower energy of two isomers. This can then be compared with experimental results and hence determine the kinetic versus thermodynamic pathway, and the overall energetic control. Having said that there are limitations to the energy minimisation methods chosen - the quicker the calculation force fields the lower the accuracy of results. If a qualitative result is what is necessary, then a lower accuracy method is sufficient. If however, such as in the miniproject, a more complex molecule (particularly when flexible) is being compared to experimental data a higher accuracy method is necessary. It is possible to infer and approximate to a certain extent, but for exact comparability a higher power computational method must be employed.
References
- ↑ M. A. Fox, R. Cardona, N. J. Kiwiet, J. Org. Chem., 1987, 52, 1469-1474. DOI:10.1021/jo00384a016
- ↑ D. K. Johnson et al, Tetrahedron Letters, 1989, 30, 6633-6636. DOI:10.1016/S0040-4039(00)70637-X
- ↑ B. Halton, R. Boese and H. S. Rzepa., J. Chem. Soc., Perkin Trans 2, 1992, 447. DOI:10.1039/P29920000447
- ↑ L. A. Gandon et al, J. Org. Chem., 2006, 71, 5198-5207. DOI:10.1021/jo060495w
- ↑ A. Thangamani, J. Jayabharathi and A. Manimekalai, J. of Structural Chem., 50, 628-639. DOI:10.1007/s10947-009-0098-8
- ↑ L. H. Mitchell, N. C. Barvian; Tetrahedron Letters, 2005, 45, 5669-5671. DOI:10.1016/j.tetlet.2004.05.111
- ↑ DOI:10042/to-6485
- ↑ DOI:10042/to-6489
