Rep:Mod:zhouyuchenginorg1
From: Zhou Yucheng
Introduction of Module 2
In module 2 we are going to explore the inorganic chemistry using computational tools which enable us to deeply study and understand the molecular structure and bonding as well as MOs which may not be as straight forward as those in organic species.
We are going to learn how to use and appreciate the optimisation and frequency calculations on Gaussian with various methods, basis sets in order to study the energy of stable conformation as well as the TS and activated complex that we are not able to characterise experimentally. Therefore, a reaction can be viewed from both thermodynamic side and kinetic side so as to be fully understood.
The starting exercise is to construct, optimise simple BH3 molecule therefore to study its bond vibrations as well as MOs. Based on what have been learnt, two different, simple molecules BCl3 and H2O are analysed. In exercise 2 more complicated Mo-complex in cis and trans-conformation is optimised twice using different basis sets and then further analysed their energies, geometry and IR spectra. In exercise 3 NH3 molecule in its different isomeric states are optimised using different methods, basis sets, then further analysed the D3h and C3v ammonia in terms of energy to relate to inversion mechanism between these two isomers and finally to study their IR spectra. In mini project, based on what have been learnt from previous exercise, digallane molecules are studied through twice optimisation to rationalise the thermal stabilities of dimerisation products as well as their geometry, finally go on to analysed their IR spectra.
BH3
Optimisation of BH3
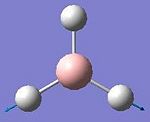
The spatial configuration of BH3 molecule was optimised using B3LYP method and the optimised structure of BH3 in jmol below:
Analysing the Optimised BH3
• The optimised B-H bond distance: 1.19Å
• The optimised H-B-H bond angle: 120.0o
The calculation summary for optimised BH3 molecule is shown in Fig 1:
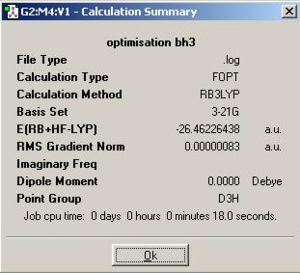
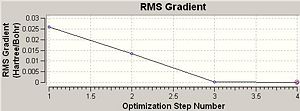
Comment: The BH3 molecule is successfully optimised as the magnitude of the gradient (0.00000083) is very close to zero (i.e. it is much smaller than 0.001).
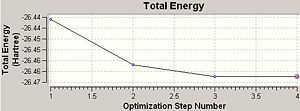
Total Energy and RMS Gradient Track
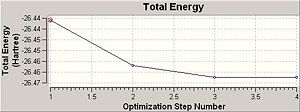
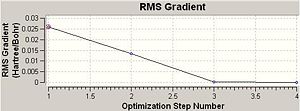
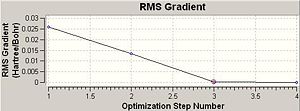
The optimisation of BH3 had 4 steps and the final magnitude of RMS is very close to zero, implying successful optimisation. The table below shows at each optimisation steps the molecular descriptions and the associated change in total energy as well as RMS gradient.
| Optimisation steps | Molecular description | Total energy | RMS gradient |
|---|---|---|---|
| 1 | 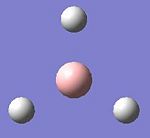 |
 |
|
| 2 |  |
 |

|
| 3 | 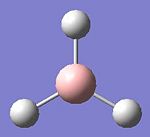 |
 |
|
| 4 | 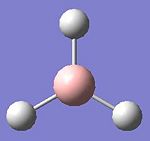 |
 |
|
Comment on optimisation methods:
In Gaussview, bonds exist as interactions between each atoms linked by electron densities which never goes to zero, provided there is no nodal plane. Based on this concept, Gaussian can make good approximations according to the interactions between the associated atoms.
In Chembio 3D, the optimisation function (MM2) only considers a classical model. The optimisation method represents a molecule in ball/stick model and optimises the configuration purely based on minimising the forces along the bonds between associated atoms, without considering quantum factors. However, in Gaussian, the optimisation function takes into account both stereoelectronics and quantum mechanisms. It works by solving the Schrodinger equation with assessing the internuclear separation R so as to balance out the internuclear repulsion by favourable electrostatic interactions between nuclei and electrons. The equilibrium internuclear separation R is achieved when the RMS gradient is very close to zero (i.e. less than 0.001). However, RMS gradient never reaches zero, it can only approach zero. This optimisation method has a downside as sometimes the target molecule can be trapped by energy well and the optimisation method reads the lowest energy configuration of the trapped molecule once the RMS gradient goes to zero, regardless, there may exists an even lower configuration. However, this downside is unavoidable, as otherwise the optimisation process would have to continue infinitely.
Analysis on IR spectrum of BH3
The frequency calculation was carried out based on optimised BH3 geometry using the pre-setup method, but with a switch in job type from optimisation to frequency and a set of additional keywords, pop=full. The energy after frequency calculation was exactly the same as after optimisation, which confirms that the frequency calculation was carried out on the optimised BH3 and the resulted frequencies with corresponding stretching/bending modes are surely to be correct. The IR spectrum of BH3 is shown below (in Fig 2):
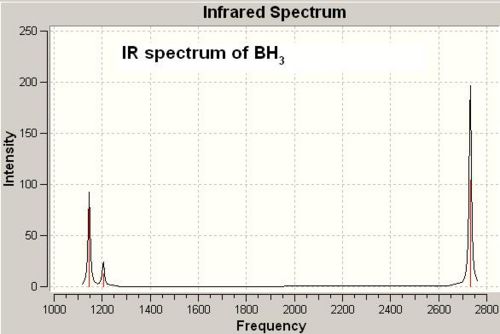
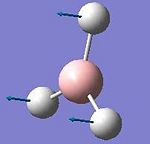
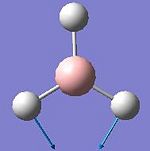
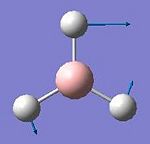
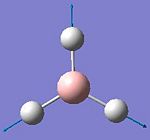
The table below shows the resulted 6 vibrational modes (stretch/bending) of BH3 molecule:
The point group symmetry of each vibrational mode was determined according to the character tables[2]. Gaussian frequency calculation gave 6 vibrational modes and the IR spectrum, therefore, is expected to show 6 absorption peaks. However, there are only 3 peaks shown. This is because the vibrational motion at frequency 2592.85 cm-1 has zero intensity and there are 4 vibrational modes are degenerate in pair (i.e. number 2&3, 5&6 see above table). Therefore only 3 IR absorption peaks appeared in the spectrum.
BH3 Molecular Orbitals
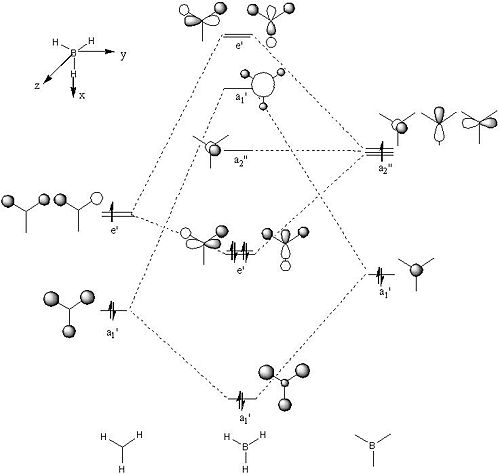
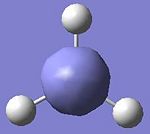
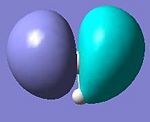
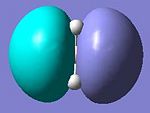
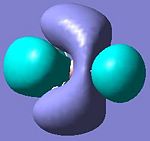
The qualitative MO diagram of BH3 is shown in Fig 3. The table below lists and compares the above qualitative MOs with corresponding quantitative MOs from Gaussview.
Discussion on BH3 MOs
• Quantitative MOs are pictorial representations of electron densities around atoms and they are resulted from Gaussview by solving Schrodinger equation. However, the data resulted from these calculations are just approximations since Gaussian MO program cannot account fully for the repulsive interactions between electrons.
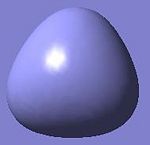
• This exercise shows overall good match between qualitative and quantitative MOs, therefore the qualitative MO theory can give reasonably good MO description. In the quantitative side, Gaussian MO calculation can give the exact shape of the MOs by assessing the resulted data from solving the Schrodinger equation and generate the corresponding MO energies for each MO, therefore giving rise to a more accurate MO diagram. However, this cannot be achieved by qualitative MO theory. • The first MO (i.e. HOMO+2) listed in above table is the full-filled 1s-orbital of boron which is too low in energy (-6.730 au) to interact with other MO, therefore it stays non-bonding.
• The second MO (i.e. HOMO+1) is the first bonding orbital and all the bonds are σ-type interactions as all the hydrogen 1s-orbitals head-on overlap with boron 2s-orbital.
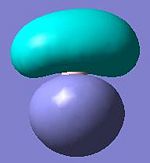
• The third and fourth MOs (i.e. HOMO) are degenerate orbitals and they form π-type interactions as hydrogen 1s-orbitals side-on overlap with the boron 2p-orbitals.
• The fifth MO (i.e. LUMO) is more diffused than the other filled orbitals, but it still has a negative energy (-0.076 au) which explained why BH3 is a Lewis acid as by occupying its LUMO the species can be more stabilised.
BCl3
Optimisation of BCl3
A larger basis set LANL2MB and a pseudo potential used for BCl3 optimisation. The reason using larger basis sets is because Cl has 17 electrons comparing to H which only has 1 electron. And the reason using a pseudo potential is because pseudo potential removes the complicated effect of core electrons in a system when the system has a relatively large number of electrons. The optimised BCl3 is shown in Jmol below:
Analysing the optimised BCl3
• Optimised B-Cl bond distance: 1.87 Å
• Optimised Cl-B-Cl bond angle: 120.0o
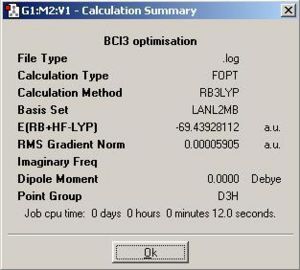
The calculation summary for optimisation of BCl3 is shown in Fig 4.
Comment:
• The BCl3 molecule is successfully optimised as the magnitude of the gradient (0.00005905) is very close to zero (i.e. it is much smaller than 0.001).
• Optimised B-Cl bond distance (1.87Å) is longer than B-H bond distance (1.19Å) due to larger atomic size of chlorine comparing to hydrogen.
• BCl3 has Cl-B-Cl bond angle 120.0o which is the same as the H-B-H bond angle in BH3, despite Cl nucleus has much more valence electrons than H nucleus. This is because both BCl3 and BH3 are in point group D3h and adopt trigonal planar structure to minimise the repulsive interactions and set BCl3 and BH3 in their lowest possible energy states. The trigonal planar arrangement of BH3 and BCl3 leads to zero net dipole moment on both molecules since the each individual dipole moment cancels out.
• The optimised total energy of BCl3 is lower than that of BH3, which is expected as a result of stronger B-Cl bond in BCl3 compared with weaker B-H bond in BH3.
H2O
Optimisation of H2O
In order to optimise H2O to completion an appropriate calculation method and basis set are required. H2O optimisation was first starting with DFT/B3LYP method and 3-21G.
The optimisation summary table is shown in Fig 5:
 |
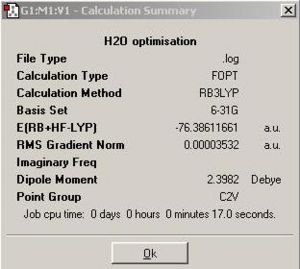
Now a larger basis set 6-31G with the same calculation method was used to determine the optimised H2O and a summary was made in Fig 6 with the new optimised H2O shown in JMOL:
 |
|
The basis set 6-31G gave RMS gradient 0.00003532 a.u. which is smaller than 0.001 and so H2O optimisation is successful.
Analysing the optimised H2O
• the xyz coordinates of H2O molecule (see Fig 7)

• Optimised O-H bond distance: 0.976Å
• Optimised H-O-H bond angle: 108.33o
• Calculation method: RB3LYP
• Basis set: 6-31G
• Final energy in atomic units (au): -76.3861 au
• Dipole moment: 2.3982 Debye
• The point group of your molecule: C2V
• The Duration of optimising calculation: 17.0 sec
Comment on the results:
The optimised H-O-H bond angle is 108.33o, showing water molecule is not a linear and adopts C2V point group. This is because oxygen has two sp3 lone pairs which repulse each other as well as the neighbouring hydrogen atom, therefore the resulting H-O-H bond angle is much less than 180o. In comparison with the reference data shown in the table below:
| Experimental | Reference[1] | |
|---|---|---|
| Optimised H-O-H bond angle | 108.33o | 104.45o |
| Optimised O-H bond distance | 0.976Å | 0.958Å |
Both of the bond angle and bond distance are very close to reference data, which again confirms the successful optimisation of H2O.
[Mo(CO)4(PMe3)2]
Optimisation of Mo-complex
In this exercise, cis and trans [Mo(CO)4(PMe3)2] geometries were optimised and based on the optimised Mo-complex geometry their IR spectra were accurately predicted by Gaussian frequency calculation. However, cis and trans-[Mo(CO)4(PMe3)2] are relatively large molecules, therefore optimisation calculation needs to be done twice in order to successfully optimise both geometries.
First optimisation used DFT/B3LYP method with LANL2MB lower basis set. In the additional keywords area pop=loose was set as loose convergence criteria which relates to the 1st derivative of the energy. The reason for not using normal convergence criteria is because in first optimisation the lower basis set was used which cannot match with the more accurate normal convergence criteria, resulting a non-convergent calculation since the limit is unable to reach. The table below shows the first optimised geometry of cis and trans-[Mo(CO)4(PMe3)2] in jmol with corresponding energies.
| First optimisation: | Energy/ kJ mol-1 | Jmol of Mo-complex | ||
|---|---|---|---|---|
| cis-[Mo(CO)4(PMe3)2]: http://hdl.handle.net/10042/to-1769 | -2007154 | |||
| Trans-[Mo(CO)4(PMe3)2]: http://hdl.handle.net/10042/to-1770 | -2007129 |
Second optimisation was done using the same method but with a larger basis set LANL2DZ and normal convergence criteria to enhance the accuracy. The improved geometry of both Mo-complexes in jmol after second optimisation with corresponding energies is listed in the table below.
| Second optimisation: | Energy/ kJ mol-1 | RMS gradient/a.u. | Jmol of Mo-complex | ||
|---|---|---|---|---|---|
| cis-[Mo(CO)4(PMe3)2]: http://hdl.handle.net/10042/to-1742 | -2030457 | 0.00003875 | |||
| Trans-[Mo(CO)4(PMe3)2]: http://hdl.handle.net/10042/to-1743 | -2030445 | 0.00003467 |
RMS gradients of both cis and trans-Mo complexes are much smaller than 0.0001, which confirms that both geometries are optimised quite successfully.
Comment on energy difference between cis and trans-[Mo(CO)4(PMe3)2]:
After second optimisation the total energy of the cis-isomer is lower than that of trans-isomer by about 12 kJ/mol, giving cis-isomer is thermodynamically more stable than trans-isomer. The outcome is unexpected since the cis-isomer is sterically more hindered than trans-isomer as two bulky PMe3 groups are almost orthogonal in cis-isomer (P-Mo-P bond angle is 93.6o) comparing to P-Mo-P bond angle 177.8o in trans-isomer. However, the geometric stabilities of both complexes are influenced by electronic and steric effects (with the cis-effect playing the major role) as well as the external factors (e.g. environmental factors, entropy considerations). It is experimentally given that in gas phase, the cis-isomer is electronically more stable than trans-isomer even large phosphine ligands involved in coordination sphere, and it seems in this situation that electronic stabilisation is a more influencing factor than the steric destabilisation for the isomeric complexes [3].
Geometric Analysis on cis and trans-[Mo(CO)4(PMe3)2]
 |
 |
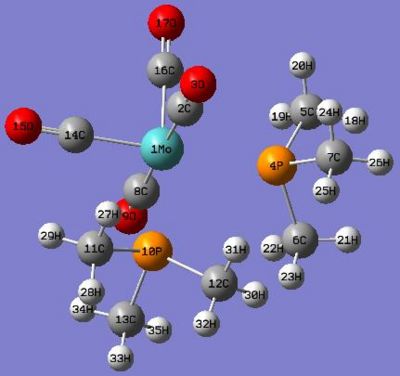
The fully optimised geometries of cis and trans-[Mo(CO)4(PMe3)2] were shown in Fig 8 and Fig 9 respectively. In this section of exercise we compared the optimised bond distances and bond angles of both geometric isomers internally with each other and externally with the reference data which involved different ligands in Mo-complexes as reference (see the table in Fig 10 for bond-distance comparison and table in Fig 11 for bond-angle comparison), however, the comparison was still scientifically meaningful to be made.
The optimised cis- and trans-isomer did not show actual Mo-P bonds in Gaussview, though they were there. This is because in Gaussview the bonds drawn are distance dependent and lying within the distance criteria, as the optimised P-Mo bond distances have exceeded the pre-set values, therefore the bonds did not show up.
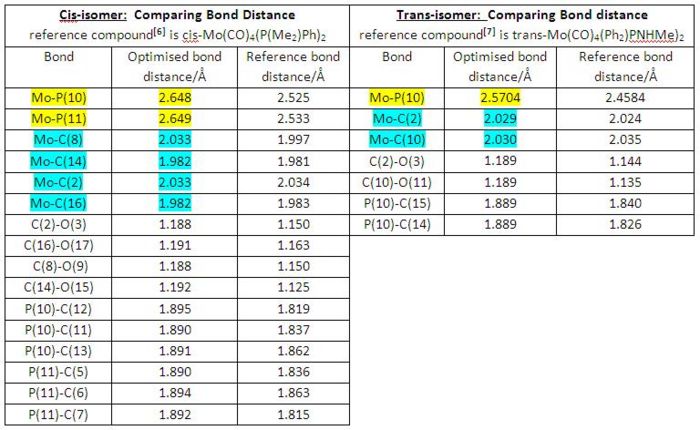 |
• Generally, both cis- and trans-isomers have shown good correlations between the computationally optimised bond distances and the corresponding experimentally determined reference data, though both cases had different ligands in reference Mo-complexes.
• By internally comparing the corresponding bond distances of cis and trans-isomers, we can see both of cis Mo-P bond distances (2.648 and 2.649 Å) are longer than the trans one (2.5704 Å). This is most likely due to PMe3 ligands being trans to each other and therefore experienced a greater attraction to the Mo centre without bearing any steric hindrance since in cis-isomer both PMe3 ligands will feel a significant steric hindrance when attracted close to the Mo centre[7].
• Another interesting point to note down here is the variation of Mo-C bond distances in cis-isomer. Generally speaking, the carbonyl groups trans to PMe3 ligands have shorter Mo-CO bond distances (1.982 and 1.982 Å) than the ones having carbonyl groups trans to each other (2.033 and 2.033 Å). This is because carbonyl ligands are much better π-acceptor than are PMe3 ligands. Therefore, carbonyl ligands when trans to each other compete for the electron density in the same 4d orbital, consequently reducing the electron density along Mo-C bonds as well as decreasing the Mo-C multiple bonding and giving rise to longer Mo-C bond. However, in the trans-isomer this Mo-C bond distance variation is not observed since all the carbonyl ligands are trans to each other[7].
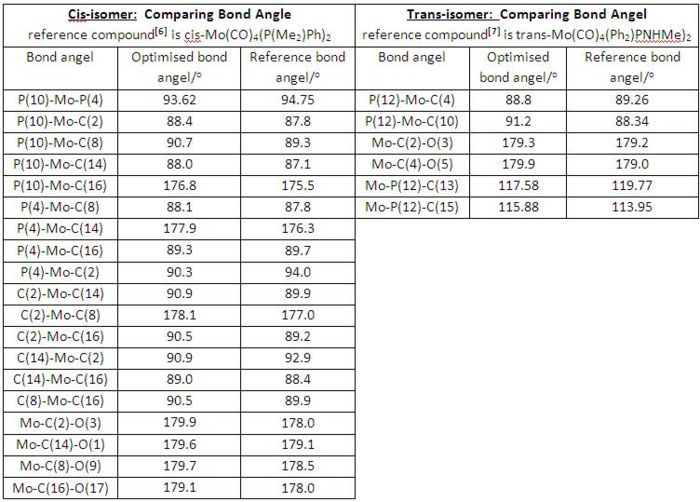 |
• According to the degree of bond angles (e.g. /P(10)-Mo-P(4) =93.62o bigger than 90o in cis and /P(12)-Mo-C(4)=88.8o smaller than 90o in trans, etc) both cis and trans-isomer have slightly distorted octahedral geometries.
• Both isomers have bond angles in good match with the experimentally determined reference bond angles, though reference Mo-complexes involved different ligands.
Analysis on IR spectra of cis and trans-[Mo(CO)4(PMe3)2]
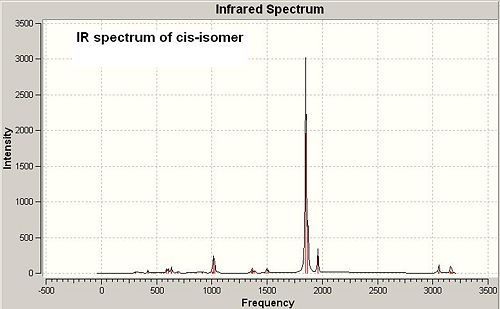
The frequency calculation of both isomers is based on the second optimised geometries. See the IR spectra of both isomers below (in Fig 12 and Fig 13):
 |
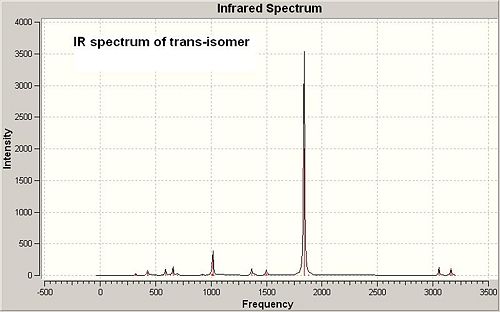 |
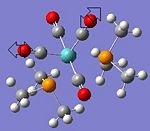
Cis-isomer has more IR absorption peaks showing than trans-isomer, which is due to different symmetry of cis and trans-Mo complexes. Cis-isomer is in point group C2v, while trans-isomer is in point group D4h in which not all the stretch are IR active as they cannot cause a change in dipole moment.
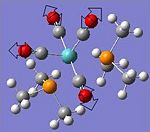
The significant IR absorption peaks of both cis and trans-isomers are summarised and compared with the reference data[4] in the table below:
| Cis-isomer: http://hdl.handle.net/10042/to-1756 | Trans-isomer: http://hdl.handle.net/10042/to-1744 | ||||
|---|---|---|---|---|---|
| Vibrational motion | Experimental/cm-1 | Reference/cm-1 | Vibrational motion | Experimental/cm-1 | Reference/cm-1 |
 |
1960.46 | 2012.6 | 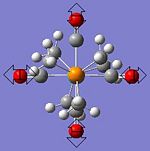 |
1954.03 | 2050.4 |
 |
1870.06 | 1912.5 | 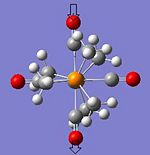 |
1838.68 | 1933.9 |
 |
1850.60 | 1899.5 | 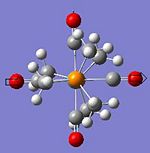 |
1838.46 | 1886.1 |
 |
1849.30 | 1886.8 | ****** | ****** | ****** |
The above table shows the IR absorptions of C=O stretch motions in both isomers correlate relatively well with the reference data, despite the ligands are different in Mo-complex. However, negative IR absorptions (-5.6895 cm-1 in trans and -6.466 cm-1 in cis) of P(CH3)3 group twisting about the P-Mo bond indicate the transition states of these twisting modes and the low frequencies mean that the energies required to twist the P-Mo bond are very small. Though the negative frequency implies the incomplete optimisation, the P-Mo bond twisting mode is quite far away from the most interested C=O stretching mode, therefore we can safely use the currently optimised geometries of both cis-and trans-[Mo(CO)4(P(CH3)3] to carry on the IR analysis.
According to the experimental data, the corresponding C=O stretching frequencies of cis-isomer and trans-isomer are quite close in terms of energy. However, C=O stretches in cis-isomer required slightly more energies than the corresponding C=O stretches in trans-isomer. The reason can be referred to the previous discussion that the cis-isomer is thermodynamically more stable than the trans-isomer by about 12 kJ/mol, as a result of electronic stabilisation wining over the steric destabilisation.
How to Alter the Relative Ordering of Cis- and Trans-isomers
• Intramolecular H-bonding method can be introduced in TM-complex system to favour the cis-isomer formation. This can be done by introducing ligands which contain F, O or N atom with free lone pairs and N-H, O-H or F-H hydrogens to the TM. The favourable intramolecualr H-bonding interactions can force the formation of cis-geometry[5].
• Cis-isomer is also favoured when TM-complex has attractive NH π-interactions or cation π-intractions. This can be done by introducing pyridinium or phenyl ring as ligands into the TM-complex system[5].
• However, trans-isomer can be favoured when large ligands are involved in the TM-complex to minimise the steric hindrance, provided the TM-complex is NOT in gas phase[3].
NH3
Optimisation of Different Symmetry NH3 Using Simple Method and Basis Set
NH3molecule was first optimised by Gaussian using B3LYP method with 6-31G basis set. The optimised geometry gave trigonal pyramidal NH3 which has symmetry C3v and the table below shows the corresponding calculation summary and jmol of optimised NH3
| Calculation Summary | Jmol of trigonal pyramidal NH3 | ||
|---|---|---|---|
 |
Then in a second NH3 molecule one of the N-H bond length altered from 1.00Å to 1.01Å, followed by
the same optimisation method and basis set but with the ‘ignore symmetry option’ ticked. This optimisation destroyed the symmetry of the previous C3v NH3 and gave rise to a C1 NH3 which was shown in table below.
| Calculation Summary | Jmol of trigonal pyramidal NH3 with altered bond length | ||
|---|---|---|---|
 |
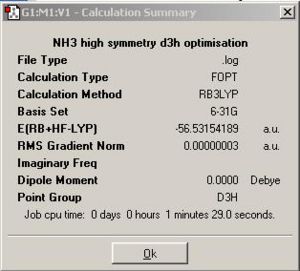
A third NH3 molecule with a dummy atom had been created by opening the existing file, http://www.ch.ic.ac.uk/hunt/teaching/teaching_comp_lab_year3/NH3_b3lyp_d3h.txt, and the optimisation was done on a restricted geometry of NH3 by that dummy atom to give symmetry D3h.
| Calculation Summary | Jmol of trigonal Planar NH3 (with restricted geometry by a dummy atom) | ||
|---|---|---|---|
 |
Conclusion on NH3 optimisation using simple method and basis set
The optimisation calculation summary of NH3 molecule with three different symmetry showed that a change in symmetry can alter the total energy, structure, the optimisation time as well as the electronic configuration of the NH3 molecule.
Firstly, we looked at the structure term. Both symmetry C3v and C1 gave trigonal pyramidal NH3, but with one N-H bond distance altered and symmetry ignored in C1 case. D3h resulted NH3 in trigonal planar structure which related to the highest symmetry among these three point groups.
Secondly, we looked at the optimisation time term. NH3 with symmetry C3v took about twice the optimisation time of C1 NH3 and NH3 with D3h symmetry took a much longer time to run optimisation calculation than the other two. This indicates higher symmetry requires longer optimisation time which is expected, as higher symmetry is associated with a larger molecular matrix which needs longer time to compute on the processor.
Thirdly, we looked at the energy term. When comparing total energies of three different symmetry NH3 molecules, it was realised that the energy differences in atomic units were very insignificant, however, when expressed in kJ/mol the energy differences become relatively noticeable (C3v: -148424 kJ/mol, C1: -148424 kJ/mol, D3h: -148423 kJ/mol). As we can see, there is almost no energy difference between C3v and C1 symmetries which are slightly lower in energy than the D3h symmetry NH3 by about 1 kJ/mol according to the results obtained from opt, B3LYP method, 6-31G basis set. When comparing RT, where R=gas constant, 8.414 J/k.mol, and T=room temperature, 298k (i.e. RT=2500 J/mol =2.5 kJ/mol), the energy differences between these three different symmetry NH3 molecules are even still not significant which means they can interexchange the structures to adopt all three different symmetries easily at room temperature, provided there is no energy barrier higher than RT. However, it is just an assumption which based on the simple optimisation calculation results and in the following section a higher calculation method along with a better basis set was employed on C3v and D3h symmetry NH3 molecules so as to generate more accurate results for further analysis and we can refer back to this interexchange mechanism at room temperature later. But so far the more stable symmetries are C3v and C1, even C1 is at lower symmetry level. As during an optimisation, a molecular symmetry can be broken down as long as the resulting molecular geometry is more stable, provided the ‘ignore symmetry’ has been chosen at before the calculation.
Last, but not least, we looked at the relationship between symmetry and electronic configuration. In Gaussview, a bond stands for electron density or electronic interaction between two atoms and as we know only orbitals with the same symmetry and in right orientations can overlap to result bonding interaction, therefore a change in symmetry leading to a direct change in electronic configuration. Consequently it gives rise to one configuration much more stable than the others as a result of good orbital overlapping. However, in the previous optimisation summary, we can see the energy differences between each different symmetry NH3 molecules were significantly small, which indicates a change in electronic configuration will not remarkably influence the relative stability of the NH3 geometry. This is because the NH3 has the ability to undergo quantum tunnelling so as to escape from the infinitely large energy barrier set by the strong attraction from the core nucleus, therefore the NH3 molecule can flip relatively easily[8].
Optimisation of Different Symmetry NH3 Using Better Method and Basis Set
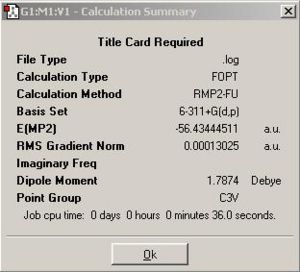
In this section of exercise, a better method MP2 along with a better basis set 6-311+G(d,p) method was used to optimise NH3 molecule, the calculation summary and the Jmol version of NH3 were listed in the table below.
| Calculation Summary | Trigonal pyramidal NH3 optimised with better method and basis set | ||
|---|---|---|---|
 |
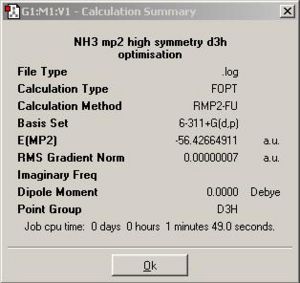
A restricted geometry of NH3 by a dummy atom was downloaded from http://www.ch.ic.ac.uk/hunt/teaching/teaching_comp_lab_year3/NH3_mp2_d3h.txt with pre-set optimisation method and basis set. The optimised NH3 has symmetry D3h and the calculation summary as well as the Jmol of D3h NH3 was listed in the table below.
| Calculation Summary | Trigonal planar NH3 optimised with better method and basis set | ||
|---|---|---|---|
 |
Conclusion on NH3 optimisation using better method and basis set
A change in method and basis set will cause changes in optimisation time as well as the accuracy of the total energy.
Firstly, we look at the optimisation time term. As we can see from the calculation summary for both D3h and C3v ammonia longer optimisation time taken when applying MP2/6-311+G(d,p), which is true as better method and basis set are more complex in terms of functions which we use to give better approximation of atomic orbitals.
Secondly, we look at the energy term. The calculation summary showed the total energies of both D3h and C3v NH3 molecules decreased by about 0.1 au when using MP2/6-311+G(d,p), and the energy difference (which is the energy barrier for inversion mechanism) between D3h ammonia and C3v ammonia in this case is 20.5 kJ/mol. This energy difference is much more significant than the one found based on B3LYP/6-31G and it is quite close to the experimentally determined barrier (24.3 kJ/mol). Now we can use this more accurate energy difference to comment on the previously discussed geometric interchange at room temperature. Both the experimentally determined and computationally determined values are much greater than RT (=2.5 kJ/mol), therefore we can surely say that the inversion mechanism will not take place at room temperature.
Last thing to discuss in this section is the electron tunnelling during the inversion mechanism. As mentioned earlier on the energy barrier is the same thing as the activation energy for the inversion mechanism through which the NH3 protons tunnel. The proton tunnelling relates to a change in Schrodinger Equation, therefore electrons can only be modelled by waves which can then explained in quantum terms.
Inversion Mechanism:
In the previous section we used the more accuracy results to find the energy difference which is 20.5 kJ/mol. In this section we explored the inversion mechanism in more details.
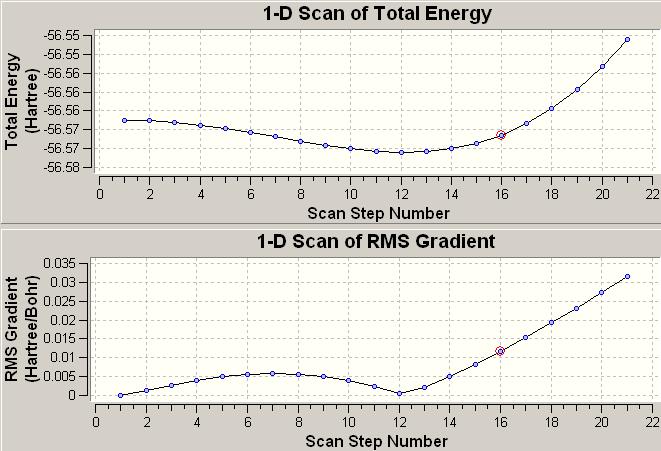
An existing file http://www.ch.ic.ac.uk/hunt/teaching/teaching_comp_lab_year3/NH3_scan_log.txt opened in Gaussview gave the variation of total energy and RMS gradient during the NH3 inversion mechanism (see Fig 14). Each dot on the energy and RMS gradient curves stands for the instantaneous energy and the RMS gradient of a specific configuration of the molecule during the inversion. Therefore from the Energy and RMS Gradient diagram below we know there are 22 steps C3v NH3 molecules have to come across (Start from C3v, then go via D3h symmetry, finally forward to C3v symmetry). The lowest energy and RMS gradient occurs at step 12 where is the formation of the equilibrium geometry of NH3 which adopts C3v symmetry; the transition state occurs at step 1 where all the H-N-H bond angels are measured to be 120o forming a trigonal planar structure and the overall geometry has D3h symmetry[9].
 |
In general, there are two ways of describing the inversion mechanism of NH3. The first issue regards the inversion mechanism as the displacement of nitrogen from the equilibrium geometry through the plane of three surrounding hydrogens. In this dynamic inversion, the plane of three hydrogens is fixed and nitrogen atoms moves up and down through the plane to perform the inversion, the height of the pyramidal therefore changes as the inversion proceeds and at the point where the height becomes zero a transition state is reached (see Fig 15). However, this issue of dynamic inversion is not quite true since when the nitrogen moves towards the centre of the equilateral triangle, the pre-assumed constant N-H bond length will make the hydrogen atoms fly off, consequently, spreading and opening the bond angel H-N-H[10].
 |
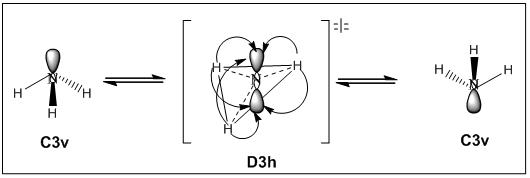
However, the second view of inversion mechanism seems more realistic in terms of considering the variation of molecular geometric parameters along with the course of the molecular vibration symmetry. The same idea here as in first view, the pyramidal structure of NH3 with C3v symmetry is the equilibrium configuration and the trigonal planar structure of NH3 with D3h symmetry is regard as the transition state configuration. The inversion takes place in 3 steps and nitrogen atom is fixed in all cases. At the first step, the plane of three surrounding hydrogens expands and proceeds symmetrically towards the central plane of nitrogen, causing the N-H bond distance and H-N-H bond angel change progressively. However, the variation of bond distance and bond angel also change as molecule vibrates, therefore, the ammonia structure goes from equilibrium (C3v) to transition state (D3h) by molecular vibrations. The electronic geometry of the transition state can be illustrated using Pauling’s Hybridization of the nitrogen atom which alters from sp3 hybridised pyramidal configuration at equilibrium to sp2 hybridised trigonal planar configuration at transition state with two lobes (orthogonal to the trigonal plane) of the nitrogen 2p orbital accommodating its lone pairs respectively (see Fig 16). At the second step, all the three hydrogen atoms locating at each vertices of the trigonal plane are competing for and attracted to the two lobes on nitrogen atom at TS, which causes a collapse of the plane of three hydrogens either into original position or into inverted side. This transformation is known as ammonia umbrella inversion and it has equal probability to go to inverted side or collapse back to original position. Finally, in order to form an inverted configuration, ammonia hydrogens must tunnel through the energy barrier of the umbrella inversion[10]. The diagram in Fig 14 shows the variation of Energy and RMS gradient during the course of this umbrella inversion.
 |
IR Analysis:
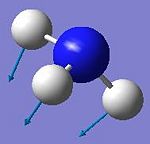
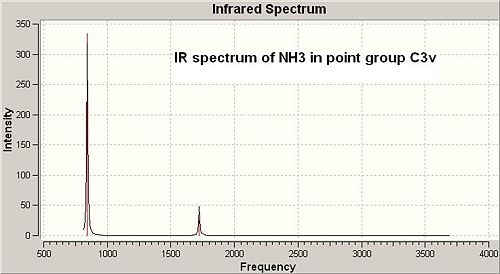
The IR spectra of both C3v and D3h symmetry ammonia were obtained by running frequency calculations using B3LYP/6-31G (method/basis set).The IR spectra of both were shown in Fig 17 and Fig 18. The vibration frequencies of both with the corresponding vibrational modes were listed in the table after the spectra.
 |
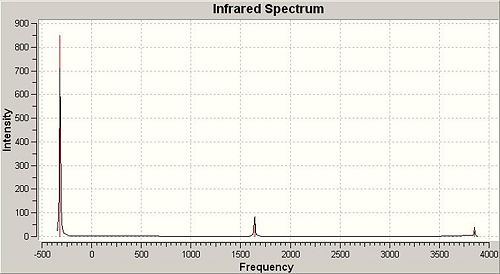 |
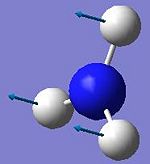
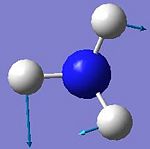
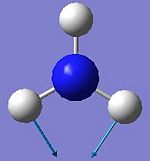
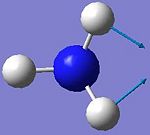
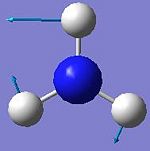
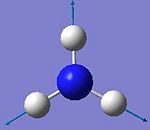
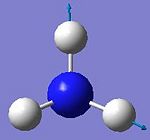
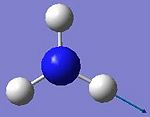
According to the vibration modes of C3v symmetry ammonia in the table above it should have 4 vibration frequencies appearing on its IR spectrum with two sets of degenerate vibrations (at 1722.67 and 3660.84cm-1). However, when looking closely at it IR spectrum, it only shows up 2 peaks at 842.611 and 1722.67 cm-1. This is because these two vibrational motions had strong IR absorptions (i.e. intensities of both were relatively high), while the vibrational motions at higher wavenumber (above 3000 cm-1) had extremely weak absorptions, therefore the IR peaks at higher wavenumber did not show up. As for D3h symmetry ammonia, it also had 6 vibrational motions with only 3 IR peaks showing up in the spectrum. This is because two sets of vibrations are degenerate (at 1640.59 and 3854.27 cm-1) and one vibrational motion had zero intensity frequency which is absent from the spectrum. However, the first vibrational motion associated with a negative wavenumber which has no physical meaning, it is an imaginary vibrational frequency resulted from purely algorithm by solving the program complex functions. It is interesting to notice that the first vibrational motions of both C3v and D3h symmetry ammonia can be regarded as the course of inversion mechanism, though the associated symmetry elements are different.
 |
When comparing to the reference[11] experimental frequencies of C3v ammonia (see the above table in Fig 19), the computational data showed a quite good correlation with the reference experimental data, which proves the reliability of the computational method and basis set used for C3v ammonia frequency calculation.
Computational Study on Structures, Energies and IR spectra of {PhGa(µ-H)H}2 and {PhGa(µ-NH2)H}2
Introduction:

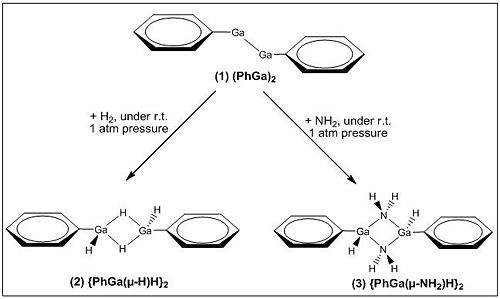
Group 13 elements often exhibit the ability of dimerisation with small molecules, such as NH3, CO, H2, generating unusual coordination, bonding as well as reactivity. The most famous examples are diborane, dialane and digallane[14]. The lightest Group 13 element, boron, has itself in one chemical form as phosphonium borate which reacts readily with hydrogen in a reverse manner under ambient conditions. In contrast, this kind of dimeriation with H2 or NH3 under ambient conditions cannot be achieved in the case of heavier Group 13 metal compounds. However, a piece of recent work from Philip P. Power showed that gallium species can react with H2 and NH3 under room temperature without photolysis[12]. In this mini project we are going to explore the dimerisation reaction of PhGaGaPh with H2 and NH3 using computational techniques and analyse the total energies, geometric structures as well as the IR spectra of the two dimer products, {PhGa(µ-H)H}2 and {PhGa(µ-NH2)H}2 (see Fig 20), based on the same optimisation method and basis set.
Reaction Schemes[12]:
See the experimental reaction schemes below (in Fig 21) for the low-valent phenyl gallium (1) species with H2 and NH3 to generate digallane (2) and (3), respectively.
 |
Optimisation of Gallium Compounds:
The starting material PhGaGaPh as well as the dimerisation products {PhGa(µ-H)H}2 and {PhGa(µ-NH2)H}2 are relatively big molecules, therefore, in order to fully optimise their geometry two levels of basis sets with the same method were employed.
First optimisation used DFT/B3LYP method with LANL2MB lower basis set. In the additional keywords area pop=loose was set as loose convergence criteria which relates to the 1st derivative of the energy. The reason for not using normal convergence criteria is because in first optimisation the lower basis set was used which cannot match with the more accurate normal convergence criteria, resulting a non-convergent calculation since the limit is unable to reach. The table below shows the first optimised geometry of starting material (1), dimerisation products (2) and (3) in jmol with corresponding calculation summaries.
| First optimisation | Calculation summary | |||
|---|---|---|---|---|
| (1) PhGaGaPh: http://hdl.handle.net/10042/to-1860 | 
| |||
| (2) {PhGa(µ-H)H}2: http://hdl.handle.net/10042/to-1852 | 
| |||
| (3) {PhGa(µ-NH2)H}2: http://hdl.handle.net/10042/to-1853 | 
| |||
Second optimisation was done using the same method but with a larger basis set LANL2DZ and normal convergence criteria to enhance the accuracy. The improved geometry of all three gallium compounds as shown in jmol after second optimisation with corresponding calculation summaries listed in the table below.
| Second optimisation | Calculation summary | |||
|---|---|---|---|---|
| (1) PhGaGaPh: http://hdl.handle.net/10042/to-1861 | 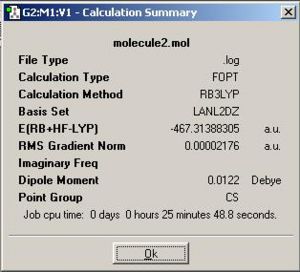
| |||
| (2) {PhGa(µ-H)H}2: http://hdl.handle.net/10042/to-1850 | 
| |||
| (3) {PhGa(µ-NH2)H}2: http://hdl.handle.net/10042/to-1851 | 
| |||
RMS gradients of all three gallium compounds are much smaller than 0.0001, which confirms that their geometries are optimised successfully.
Comment on Energy Difference Between All Three Gallium-compounds (1), (2) and (3):
• As the calculation summaries of compounds (1), (2) and (3) show the optimisation of all three compounds were used the same method as well as basis set, therefore we can reasonably and safely compare the their results.
• Firstly we look at the total energy differences between starting gallium compound and dimerisation products (2), (3) to see if both reactions are thermodynamically favourable. The table below (see Fig 22) listed all the energy terms which have been converted in units of kJ/mol for the easiness of comparison.
 |
As we can see from the above table, the total energy of starting gallium compound (1) is higher than those of dimerisation products (2) and (3) by 6359 and 297391 kJ/mol, respectively, indicating the dimerisation reactions are thermodynamically favoured. This is because gallium is group 13 element associating with 3 valence electrons and it wants to form stable octet-electron configuration. In the starting compound (1) gallium atom has 5 valence electrons, 4 of which involved in bonding interactions. In contrast, both of the dimerisation products (2) and (3) have gallium atoms in stable octet-electron configuration (see Fig 23), therefore the formation of compounds (2) and (3) are thermodynamically favoured.
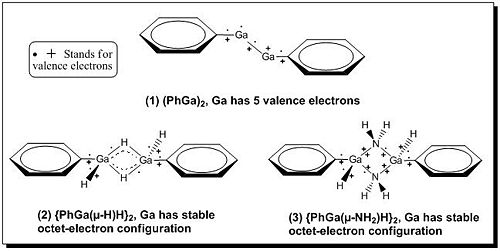 |
• Secondly we look at the energy difference between dimerisation products (2) and (3) and rationalise the energy difference. In the first part of discussion we have looked at the thermal stability of starting gallium compound (1) and dimerisation products (2), (3) in terms of valence-electron configuration, and stated that both dimerisation products (2) and (3) had gallium atoms with octet-electron configuration (referring to the Fig 23 shown above). However, it is not purely octet in the case of compound (2) since hydrogen atom only has 1 valence electron in 1s-orbital, and so Ga-H-Ga forms 3-centre-2-electron bonding with the bonding orbitals shifting towards two gallium atoms. In contrast, compound (3) has nitrogen as bridging atom which consists 5 valence electrons; therefore it is able to give 1 valence electron into bonding interaction with 1 valence electron on gallium atom as well as donate its electron long pair into the empty p-orbital on gallium atom. Hence, in compound (3) gallium has purely octet-electron configuration.
• An alternative way to look at the presence of energy difference between (2) and (3) lies in the reactivity of gallium compounds with Lewis base. NH3 is a much better Lewis base comparing to H2, therefore a reaction of PhGaGaPh with NH3 is thermodynamically more favourable[13].
• Experimental results[12] also confirmed the above rationalisation. The mp of compound (2) is 235oC which is much lower than that of compound (3) (293oC); also the yield of compound (2) is 62% which is lower than that of compound (3) by 11%. As an overall, formation of compound (3) is more thermodynamically favoured and its thermal stability is greater than that of compound (2).
Geometric Analysis on {PhGa(µ-H)H}2 and {PhGa(µ-NH2)H}2:
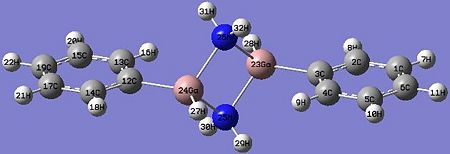
The fully optimised geometries of {PhGa(µ-H)H}2 and {PhGa(µ-NH2)H}2 were shown in Fig 24 and Fig 25 respectively. In this section of exercise we compared the optimised bond distances and bond angles of both geometric isomers internally with each other and externally with the reference data which involved much bulkier ligands (Ar’ and Ar’’) in digallane (where Ar’=2,6-(2,6-iPr2C6H3)2C6H3 and Ar’’=2,6-(2,6iPr2C6H3)2-4-(Me3Si)C6H2 ), this is due to the limitation of using large molecules as the calculations on the computer system will take very long. However, the comparison was still scientifically meaningful to be made.
The optimised {PhGa(µ-H)H}2 did not show actual bonds between bridging hydrogens and gallium in Gaussview, though they were there. This is because in Gaussview the bonds drawn are distance dependent and lying within the distance criteria, as the optimised Ga-H bridging bond distances have exceeded the pre-set values, therefore the bonds did not show up.
 |
 |
The table below (in Fig 26) listed the optimised bond distances of gallium compounds (2) and (3) as well as the corresponding experimentally determined reference data for the purpose of making comparison.
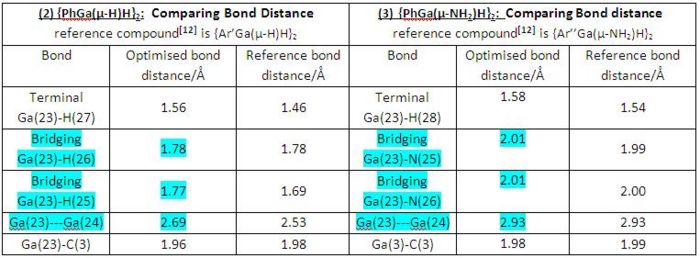 |
• Generally, both dimerisation products (2) and (3) have shown good correlations between the computationally optimised bond distances and the corresponding experimentally determined reference data, though both cases had different ligands in reference digallane compounds.
• By internally comparing the corresponding bond distances of compounds (2) and (3) we can see all the corresponding bond distances of both compounds are similar apart from bridging and Ga-Ga bond distancs. Bridging Ga-H bond distance is shorter than bridging Ga-N bond distance, also Ga---Ga internal distance is shorter in compound (2) than in compound (3). This is due to larger atomic size of nitrogen comparing to hydrogen, therefore shorter bridging Ga-H bond distance as well as Ga---Ga internal distance is expected in compound (2).
The table below (in Fig 27) listed the optimised bond angles of gallium compounds (2) and (3) as well as the corresponding experimentally determined reference data for the purpose of making comparison.
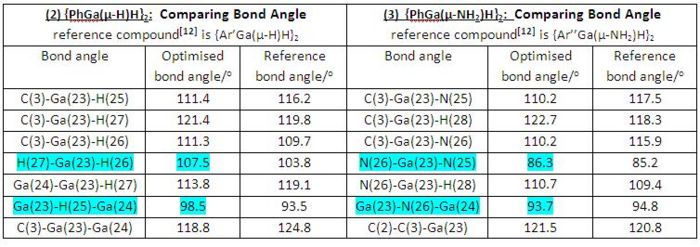 |
• Generally speaking, both dimerisation products (2) and (3) have shown reasonable correlations between the computationally optimised bond distances and the corresponding experimentally determined reference data, though both cases had different ligands in reference digallane compounds.
• When comparing the optimised bond angles of compounds (2) and (3) internally we can see all the corresponding bond angles of both compounds are similar to each other, apart from the highlighted bond angles (see the table in Fig 27). Optimised H-Ga-H bond angle is much larger than optimised N-Ga-N bond angle as well as the optimised Ga-H-Ga bond angle being larger than optimised Ga-N-Ga bond angle. This may be due to greater bonding interactions between gallium and better Lewis base, NH3, which results a contraction of the involved bond angles.
Finally we compare the dihedral angles between the Ga2H2 and Ga2N2 rings with the phenyl planes, respectively, see how well the computationally obtained values resemble with the experimentally determined data (see table in Fig 28).
 |
• Both sets of results are in good agreement with the experimentally determined dihedral angles.
• Like the previous bond angle comparison case, compound (2) has a greater dihedral angles between the Ga2H2 ring and the phenyl plane, which comes out algebraically as a result of larger Ga-H-Ga bond angles in compound (2).
Conclusion on Geometric Comparison:
After comparing the geometric elements in terms of bond distance, bond angle as well as dihedral angle of both compounds (2) & (3) internally and externally, we can partially confirm that optimisation of both (2) and (3) were quite successful. The final confirmation would be made in the following section of IR analysis.
Analysis on IR Spectra of {PhGa(µ-H)H}2 and {PhGa(µ-NH2)H}2:
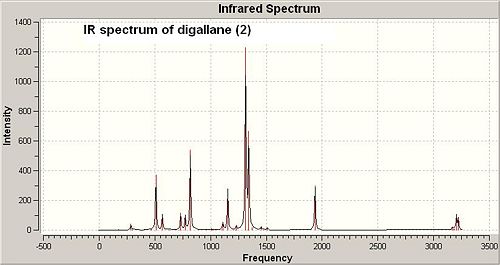
The frequency calculation of both dimerisation products (2) and (3) is based on the second optimised geometries. See the IR spectra of both digallan (2) and (3) below in Fig 29 and Fig 30:
 |
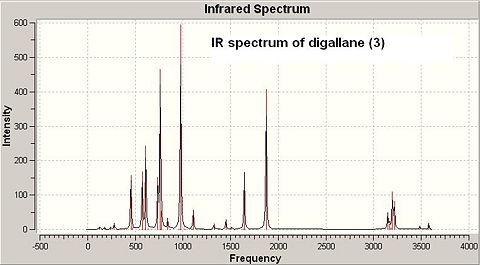 |
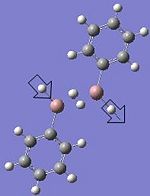
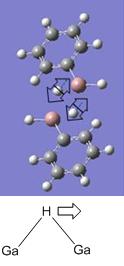
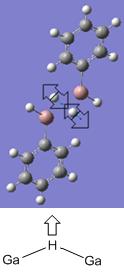
Compounds (2) and (3) had up to 78 and 90 vibrational modes and each can be animated using GaussView, however, only the characteristic ones were noted down here and analysed further. The table below shows the terminal Ga-H, bridging Ga-H and N-H vibration motions with corresponding wavenumbers which were compared with the experimentally determined reference data.
| {PhGa(µ-H)H}2: http://hdl.handle.net/10042/to-1848 | {PhGa(µ-NH2)H}2: http://hdl.handle.net/10042/to-1849 | ||||
|---|---|---|---|---|---|
| Vibrational motion | Computational/cm-1 | Reference[12],[13]/cm-1 | Vibrational motion | Computational/cm-1 | Reference[12]/cm-1 |
 |
1936.98 (medium intensity 298.6, sharp band) | 1844.00 (medium sharp band) |  |
1872.95 (high intensity 407.37, strong and sharp band) | 1864.00 (Medium and sharp band) |
 |
1935.93 (very low intensity 0.0005, due to hardly any change in net dipole moment from symmetric Ga-H bond stretch) | ****** | 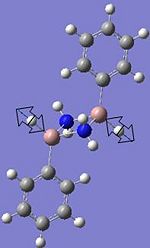 |
1874.99 (very low intensity 0.0332 due to hardly any change in total dipole moment from symmetric Ga-H bond stretch) | ****** |
 |
1314.50 (high intensity 1228.9, strong and sharp band) | 1273.00 |  |
3577.79 (low intensity 18.5, weak and sharp band) | 3365.00 (weak and sharp band) |
 |
1153.97 (medium intensity 278.3, medium and sharp band) | 1202.00 | 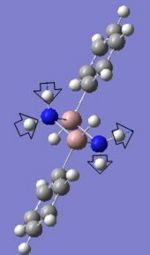 |
3483.76 (low intensity 11.0, weak and sharp band) | 3310.00 (weak and sharp band) |
• The frequency calculation is the second derivative of the PES, and if the frequencies are all positive which indicates a minimum of energy, however, if the frequencies have one negative value then it implies a presence of a transition state. But if we have more than one negative frequency, then the optimisation has failed. In this case, both compounds (2) and (3) have all positive frequencies, plus the total energies of both compounds after frequency calculation were the same as those generated from second optimisation calculation, therefore we can fully confirm that both compounds (2) and (3) have successfully optimised.
• Firstly the vibrational frequencies of the above stretches were compared externally with the reference data. All the computational data resembled well with the experimental values, even though compound (2) has terminal Ga-H asymmetric stretch frequency differed from the reference value by about 100cm-1, it is still within the terminal Ga-H bond stretch frequency range[13] 1720-2050 cm-1. Therefore, the computationally determined frequencies were reasonably accurate.
• Secondly the vibrational frequencies of terminal Ga-H were compared between compounds (2) and (3). By looking at the reference data, there is no significant difference between terminal Ga-H stretch frequencies of compound (2) and (3). However, the computationally resulted terminal Ga-H frequencies for compound (2) and (3) differed by about 64 cm-1, which means compound (1) has slightly stronger terminal Ga-H bonds than compound (2). The greater difference arising from computational method is because frequency calculation was based on previously optimised model which were obtained by solving Schrodinger equations and treating electrons as waves, but in reality electrons exhibit wave–particle duality. Therefore the computationally resulted compounds and data may not 100% match with the realities, and hence the above differences are acceptable.
Conclusion:
In this min project, the dimerisation reactions of PhGaGaPh separately with H2 and NH3 were studied based on second optimised geometry and rationalised the thermal stabilities of dimerisation products {PhGa(µ-H)H}2 and {PhGa(µ-NH2)H}2 . Geometry as well as IR spectra of {PhGa(µ-H)H}2 and {PhGa(µ-NH2)H}2 were computationally analysed and compared internally with each other and externally with the reference data. The general good agreement of computational data with experimental values shows that the computational analysis is a very powerful tool for studying inorganic chemistry and it gives reliable results as long as appropriate methods/basis sets are employed. As an overall, this mini project was conducted fairly successfully.
Reference
1. C. Yoder, Chemistry Data Tables, http://www.wiredchemist.com/chemistry/data/oxygen_selenium_compounds.html
2. 2. Character tables for determining point group symmetry: http://www.webqc.org/symmetry.php
3. DennisW. Bennett, Tasneem A. Siddiquee, Daniel T. Haworth, Shariff E. Kabir, and Farzana K. Camellia. Journal of Chemical Crystallography, Vol. 34, No. 6, June 2004.
4. Darensbourg, Inorg. Chem, 18, 1, 1979
5. L. HirsiÍaara et al.rInorganic Chemistry Communications 3(2000)508–510
6. F. Albert. Cotton, Donald J. Darensbourg, Inorg. Chem., 1982, 21, 294-299 http://pubs.acs.org/doi/pdf/10.1021/ic00131a055 7. Gary M. Gray*' 1 and Yalin Zhang. Journal of Crystallographic and Spectroscopic Research, Vol. 23, No. 9, 1993 http://www.springerlink.com/content/t078452442436q64/fulltext.pdf
8. V. Bouchiat, D. Vion, P. Joyez, D. Esteve, and M. H. Devoret, Journal of Superconductivity, Vol. 12, No. 6, 1999 http://www.springerlink.com/content/n7460711057v1222/fulltext.pdf
9. Christoph Kölmel, Christian Oehsenfeld, and Reinhart Ahlrichs, Triisopropylamine and related amines and phosphines,Theor Chim Acta (1991) 82:271-284 http://www.springerlink.com/content/r7705703678x2x58/fulltext.pdf
10. DULAL C. GHOSH, JIBANANANDA JANA, RAKA BISWAS, Quantum Chemical Study of the Umbrella Inversion of the Ammonia Molecule, International Journal of Quantum Chemistry, Vol. 80, 1–26 (2000) http://www3.interscience.wiley.com/cgi-bin/fulltext/72515501/PDFSTART
11. David A. Dixon, and Maciej Gutowski. J. Phys. Chem. A, 2005, 109 (23), 5129-5135• DOI: 10.1021/jp0445627 • http://pubs.acs.org/doi/pdf/10.1021/jp0445627
12. Zhongliang Zhu, Xinping Wang, Yang Peng, Hao Lei, James C. Fettinger, Eric Rivard, Philip P. Power Angew. Addition of Hydrogen or Ammonia to a Low-Valent Group 13 Metal Species at 25 °C and 1 Atmosphere (p NA) Chem. Int. Ed. 2009, 48, 1 – 5 http://www3.interscience.wiley.com/cgi-bin/fulltext/121671246/PDFSTART
13. Colin R. Pulham, Anthony J. Downs, Michael J. Goode, David W. H. Rankin, and Heather E. Robertson. J. Am. Chem. Soc., 1991, 113 (14), 5149-5162• http://pubs.acs.org/doi/pdf/10.1021/ja00014a003
14. M. Shen and H. F. Schaefer, III: Molecules M,H, J. Chem. Phys. 96, 2868 (1992); DOI:10.1063/1.461983 http://scitation.aip.org/getpdf/servlet/GetPDFServlet?filetype=pdf&id=JCPSA6000096000004002868000001&idtype=cvips&prog=normal

