Rep:Mod:za511
Introduction
Computational chemistry provides invaluable insights into many aspects associated with the molecular structure of a molecule. With the increasing use of inorganic compounds in catalysis, predetermining the properties of the compound is useful. Computational analysis can be used to determine the energies of various structures and their stability. Calculations can also be carried out to determine the electron density within the molecule and thus molecular orbitals within the structure. These results can be used to predict the reactivity of the molecule. Computational analysis carried out in this way has been used to find alternative catalysts for the production of ethene. Many compounds were screened relatively easily eliminating the time consuming synthesis of each individual compound. This enabled the discovery of cheaper, more selective catalytic systems. [1]
In this experiment, the structures of Lewis acids, borane, boron tribromide and gallium(III) bromide were analysed using optimisation calculations. The structure of four AlBr2 Cl4 were also studied. The relative energies of the conformers were calculated to find the most stable conformer. The vibrational modes were calculated to compute IR spectra. The molecular orbitals were calculated for the most stable conformer.
EX3 Section
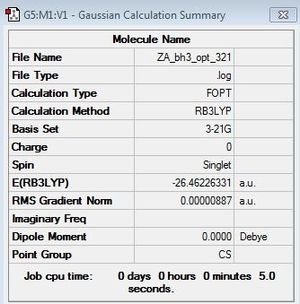
Optimisation of BH3
B3LYP/3-21G level
Optimisation log file here
B3LYP/6-31G(d,p) level
Optimisation log file here
| summary data | convergence | Jmol | |||
|---|---|---|---|---|---|

|
Item Value Threshold Converged? Maximum Force 0.000009 0.000450 YES RMS Force 0.000006 0.000300 YES Maximum Displacement 0.000040 0.001800 YES RMS Displacement 0.000025 0.001200 YES Predicted change in Energy=-5.264142D-10 |
|
Optimisation of GaBr3
GaBr3:B3LYP/LANL2DZ
optimisation file: DOI:10042/143676
| summary data | convergence | Jmol | |||
|---|---|---|---|---|---|

|
Item Value Threshold Converged? Maximum Force 0.000000 0.000450 YES RMS Force 0.000000 0.000300 YES Maximum Displacement 0.000003 0.001800 YES RMS Displacement 0.000002 0.001200 YES Predicted change in Energy=-1.307752D-12 |
|
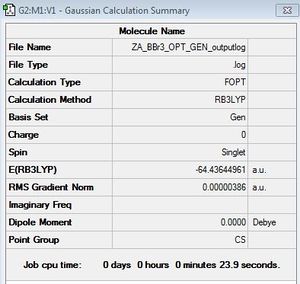
Optimisation of BBr3
BBr3:6-31G/LANL2DZ
optimisation file: DOI:10042/143887
| summary data | convergence | Jmol | |||
|---|---|---|---|---|---|
|
Item Value Threshold Converged? Maximum Force 0.000008 0.000450 YES RMS Force 0.000005 0.000300 YES Maximum Displacement 0.000036 0.001800 YES RMS Displacement 0.000024 0.001200 YES Predicted change in Energy=-3.974148D-10 |
|
Geometry Comparison
| BH3 | BBr3 | GaBr3 | |
|---|---|---|---|
| r(E-X) | 1.19 | 1.93 | 2.35 |
| θ(X-E-X) | 120.0 | 120.0 | 120.0 |
The geometry data table shows the bond lengths and bond angles found from the optimised structures of BH3, BBr3 and GaBr3. The table shows that the E-X bond length increases upon changing the ligand on the B atom from H to Br. The increase in bond length from 1.19 Å to 1.93 Å is as a result of difference in orbital overlaps. The larger, more diffuse orbitals of Br have a poorer orbital overlap with the atomic orbitals of B and so a weaker, longer bond is formed.
The H and Br atoms differ in electronegativity (χBr = 2.96, χH = 2.1). The B-Br bond will be more polarised than the B-H bond due to the higher electronegativity of the Br atom. The difference in electronic structure of the H and the Br atoms affects the stabilisation of the B-X bond. The lone pair of electrons in a 4p orbital of Br are donated to the empty 2p orbital of the electron deficient B. This results in an extra stabilisation of the Br-B bond not present in the B-H bond.
Changing the central atom from a lighter Group 13 element, B to a heavier Ga results in an increase in E-Br bond length from 1.93 to 2.35 Å. The difference in bond length can be rationalised by comparing atomic radii of Ga and B. Ga will have a larger atomic radius as it has a greater number of occupied electron shells. This will result in a longer distance between the covalently bonded Ga and Br. B and Ga are both Group 13 elements however, differ in their electronic structure. B consists of five electrons whereas Ga has thirty one electrons. This results in a difference in their electrostatic interactions however, overall, bonding interactions are similar as they have the same number of valence electrons. Strength of bonding interactions will differ between B and Ga due to the difference in size of their valence s and p orbitals. The inert pair effect is results in formation of Ga(I) compounds however, B is always found in the +3 oxidation state. However, only a relatively small number of Ga(I) compounds exist. Ga(III) compounds are more common.
In valence bond theory, the interaction of atomic orbitals on individual atoms results in formation of a bond. The wavefunctions of individual atoms are superimposed to form a new wavefunction representing the electron pair within the bond. Valence bond theory considers the bonds within the molecule as having formed due to specific interactions of two unpaired electrons. Molecular orbital theory extends the idea of individual interactions to the idea that electrons in a polyatomic molecule are delocalised over the whole molecule. The molecule is held together by interactions of the electrons distributed across the whole molecule rather than specific interactions between two unpaired electrons. Although bonds are represented as localised 2c-2e bonds, the true representation of bonding interactions is given by the molecular orbitals formed as a results of the linear combination of atomic orbitals according to molecular orbital theory. The molecular orbitals show the electron density is spread over the whole molecule. Electrons are not held in localised 2c-2e bonds as drawn.
The strongest known bond is the covalent N≡N triple bond, with a bond dissociation energy of 944.84 kJ/mol. In comparison, the Ne-Ne bond is much weaker with a bond dissociation energy of 4.31 kJ/mol. A medium bond of intermediate energy is an O=O double bond with a bond dissociation energy of 498.36 kJ/mol. [2]
A predefined value is used to draw the bond in Gaussview. Therefore, if a bond is not drawn it does not mean the bond is not present.
Frequency calculations
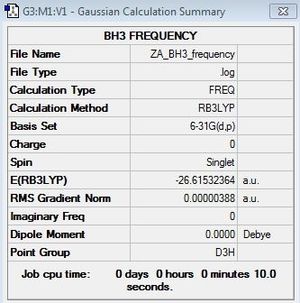
BH3:B3LYP/6-31G(d,p)
Frequency file: here
| summary data | low modes |
|---|---|
|
Low frequencies --- -13.3330 -13.3277 -9.1671 -0.0013 0.0199 0.3761 Low frequencies --- 1162.9614 1213.1301 1213.1304 |
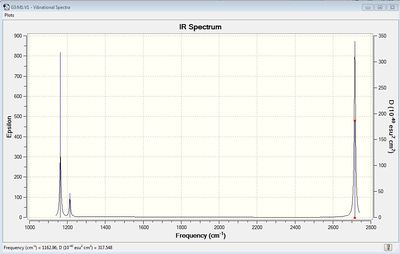
Vibrational spectrum for BH3
| wavenumber | Intensity | IR active? | type |
| 1163 | 93 | yes | bend |
| 1213 | 14 | slight | bend |
| 1213 | 14 | slight | bend |
| 2583 | 0 | no | stretch |
| 2716 | 126 | yes | stretch |
| 2716 | 126 | yes | stretch |
The results show there are six vibrations. However, only three peaks are observed in the IR spectrum. The vibrational mode of the molecule must result in a change in dipole moment in order for it to be IR active. The bends corresponding to frequencies of 1163 and 1213 cm-1 are antisymmetric thus, result in a change in dipole moment and are therefore IR active and two peaks are observed at the corresponding frequencies. The bend corresponding to the wagging mode has a greater intensity than the bend corresponding to the rocking modes at 1213 cm-1. The bends observed at 1213 cm-1 correspond to one peak on the computed IR spectrum. This is because the vibrations are degenerate. The third peak seen at a higher frequency of 2716 cm-1 arises due to antisymmetric stretches. The frequency of stretches is higher than the frequency of bends. This is because a stretch of the bond results in a greater change in potential energy of the bond due to displacement from the equilibrium bond length. This results in a greater weakening of the bond than a bend, therefore, more energy is required to cause a stretch. On the other hand, the symmetric stretch corresponding to a frequency 2583 cm-1 does not result in a change in dipole moment. Therefore, it is IR inactive and not observed on the spectrum.
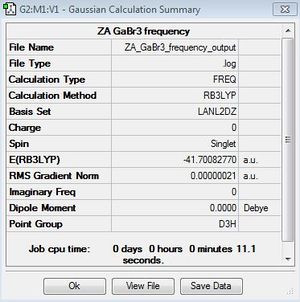
GaBr3:B3LYP/LANL2DZ
Frequency file: File:ZA GaBr3 frequency outputlog.txt
| summary data | low modes |
|---|---|
|
Low frequencies --- -1.4877 -0.0015 -0.0002 0.0096 0.6540 0.6540 Low frequencies --- 76.3920 76.3924 99.6767 |
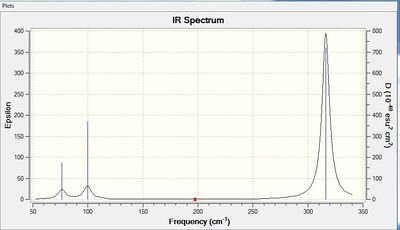
Vibrational spectrum for GaBr3
| wavenumber | Intensity | IR active? | type |
| 76 | 3 | yes | bend |
| 76 | 3 | yes | bend |
| 100 | 9 | yes | bend |
| 197 | 0 | no | stretch |
| 316 | 57 | yes | stretch |
| 316 | 57 | yes | stretch |
The results show there are six vibrations. As with borane, only three peaks are observed on the IR spectrum. The bends corresponding to the scissoring and wagging modes at 76 and 100 cm-1 respectively result in a change in dipole moment as they are antisymmetric. The third peak arises due to the antisymmetric stretches of frequency 316 cm-1. The symmetric stretch corresponding to a frequency of 197 cm-1 does not result in a change of dipole moment thus is IR inactive. The two degenerate vibrations at frequencies 76 and 316 cm-1 arise as one peak in the spectrum and thus, three peaks are observed.
Comparison of vibrational spectra of GaBr3 and BH3
One difference between the IR spectra of borane and gallium(III) bromide is the wavenumbers for the bands observed. The spectrum of gallium(III) bromide shows peaks at lower wavenumbers. This is due to the difference in mass of the two triatomic molecules. Gallium(III) bromide is approximately twenty times heavier than borane. This results in gallium(III) bromide having a much larger reduced mass and therefore, lower vibrational frequencies for its vibrations. The relationship between the wavenumber and mass is shown in Equation 1.
Equation 1: Wavenumber (cm -1) = 1/2π (k/μ)0.5
The heavier gallium and bromine atoms will move more slowly than the boron and hydrogen atoms. It is also possible that the difference in wavenumber is due to a difference in bond strength. A lower vibrational frequency indicates that the bonds are weaker. This is because the wavenumber is proportional to the force constant. The B-H bond energy of 389 kJ/mol in comparison to the bond energy of 402 kJ/mol of Ga-Br shows that this difference in frequency is observed due to the difference in mass.
The A2’’ umbrella motion corresponds to a frequency of 100 cm-1 with an intensity of 9 for gallium(III) bromide. The umbrella motion of borane appears at a higher frequency of 1163 cm-1 with a stronger intensity of 93. The difference in intensity is observed due to a difference in the strength of the change in dipole moment. If the vibration results in a strong change in dipole moment, a more intense peak is observed.
The displacement vectors show the central Ga atom is moving in gallium(III) bromide whereas it is the H atoms that are displaced in the borane molecule. This difference in the nature of the vibration is due to differences in mass. Gallium is heavier than bromine so has a larger displacement than bromine. On the other hand, the hydrogen atoms in borane are lighter than the central boron atom so it is the hydrogen that have a greater displacement in the borane molecule.
Frequency analysis in Gaussian
The basis set is a set of functions used to compute molecular orbitals to describe the electron density within the molecule. The basis set consists of a particular number and type of functions. A geometry optimisation carried out with a particular basis set will give the lowest energy structure for the basis set specified. A frequency calculation can be carried out to give the vibrational modes for the structure at equilibrium. Using a different basis set to carry out the frequency calculation will result in a different set of functions being used to approximate the molecular orbitals and electron density within the molecule. This means that there will be a difference in energies and vibrational frequencies calculated for the same structure with different basis sets.A frequency calculation gives the frequencies and intensity of vibrational modes of a molecule at equilibrium. This data can be used to compute an IR spectrum.
The “low frequencies” found from a frequency calculation correspond to the rotations and translations of the molecule. For a non-linear molecule, there will be 3N-6 vibrational modes. The six frequencies taken away are these frequencies corresponding to rotations and translations of the centre of mass of the molecule.
Molecular orbital analysis for BH3
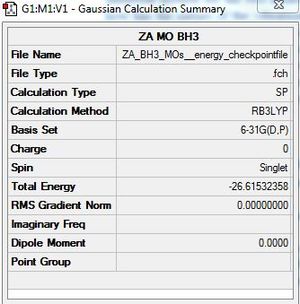
BH3:B3LYP/6-31G(d,p)
Checkpoint file: DOI:10042/146710
| summary data | Molecular orbitals [3] |
|---|---|
|
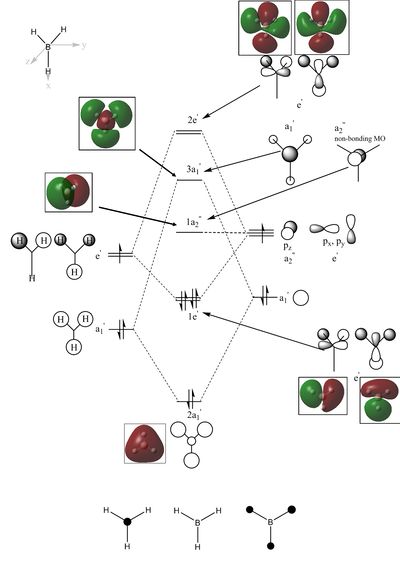
The diagram shows the molecular orbital diagram of borane produced from the LCAO and the corresponding computed molecular orbitals. The computational analysis shows the 1s atomic orbital of boron at a lower energy of -6.77. This is molecular orbital is not drawn in the LCAO MOs.
The computed molecular orbitals of three occupied molecular orbitals, 2a1’ and the two degenerate 1e’, show good agreement with molecular orbitals formed using the LCAO method. It can be seen from the computed molecular orbitals that the electron density is within the regions shown by the LCAO molecular orbitals. The LCAO 2a1’ molecular orbital shows the molecular orbital as consisting of localised 1s orbitals on the hydrogen and boron atoms with a greater contribution on the hydrogen. However, the computed 2a1’ shows the electron density spread over the whole molecule. Likewise the shape of the computed 1e’ do not correspond to localised 1s and 2p orbitals but show a shape that corresponds to an overlap of s and p orbitals. The computed non-bonding a2’’ molecular orbital looks like a pz orbital. However, the electron density is spread across the whole molecule with a nodal plane along the y axis rather than being localised at the boron atom. The 3a1’ shows electron density within the same regions of the molecule as that predicted by the LCAO 3a1’ molecular orbital. However, the orbital contributions are slightly different. There are greater contributions on the hydrogen atoms than is shown in the LCAO molecular orbital. The LCAO 3a1’ molecular orbital shows greater electron density on the boron atom than the hydrogen atoms however, the computed molecular orbital shows electron density is much more significant on the hydrogen than shown in the LCAO molecular orbital. It is difficult to assign the final two computed molecular orbitals to those of the remaining LCAO molecular orbitals. One of the LCAO 2e’ molecular orbital shows the electron density localised on boron and two of the hydrogen atoms whilst the other shows electron density on all three hydrogen atoms and the boron atom. The computed molecular orbitals show the electron density is spread across all three hydrogen atoms and the boron atom. Overall, there is a good agreement between computed molecular orbitals and those formed from LCAO approximations.
NH3
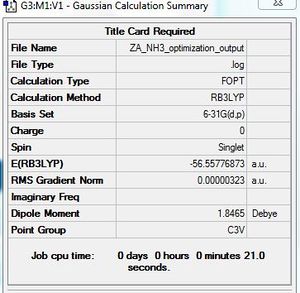
Optimisation of NH3
B3LYP/6-31G (d,p) level
Optimisation log file here
| summary data | convergence | Jmol | |||
|---|---|---|---|---|---|
|
Item Value Threshold Converged? Maximum Force 0.000006 0.000450 YES RMS Force 0.000004 0.000300 YES Maximum Displacement 0.000012 0.001800 YES RMS Displacement 0.000008 0.001200 YES Predicted change in Energy=-9.843957D-11 |
|
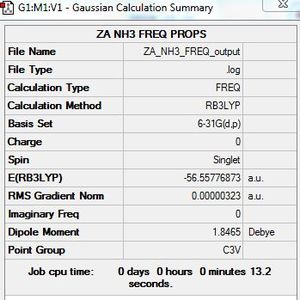
Frequency calculation: NH3
B3LYP/6-31G (d,p) level Frequency file: here
| summary data | low modes |
|---|---|
|
Low frequencies --- -0.0129 -0.0022 -0.0017 7.0722 8.1014 8.1017 Low frequencies --- 1089.3849 1693.9369 1693.9369 |
Vibrational spectrum for NH3
| wavenumber | Intensity | IR active? | type |
| 1089 | 145 | yes | bend |
| 1694 | 14 | yes | bend |
| 1694 | 14 | yes | bend |
| 3461 | 1 | very slight | stretch |
| 3590 | 0 | no | stretch |
| 3590 | 0 | no | stretch |
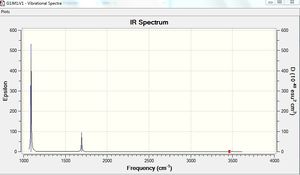
The results show there are six vibrations. However, only three peaks are observed in the IR spectrum. The vibration must result in a change in dipole moment for it to be IR active. The bend corresponding to a frequency of 1089 cm-1 results in a change in dipole moment as all the bonds bend in the same direction. This vibration corresponding to the "umbrella motion" is therefore IR active. The wagging motions corresponding to frequencies of 1694 cm-1 are also IR active. However, these degenerate stretches correspond to one peak on the IR spectrum. A small peak is observed at 3461 cm-1. The symmetric stretch must correspond to a very weak change in dipole moment and is therefore IR active but with a low intensity. The stretches corresponding to 3590 cm-1 are IR inactive as they do not result in a change in dipole moment of the molecule.
Molecular orbital analysis for NH3
NH3:B3LYP/6-31G(d,p)
Checkpoint file: DOI:10042/147305
Charge Distribution within NH3:B3LYP/6-31G(d,p)
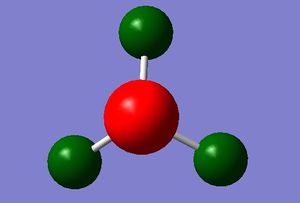
Red indicates a partial negative charge. Nitrogen is more electronegative than the hydrogen atoms therefore is red. The green colour of the hydrogen indicates a partial positive charge.
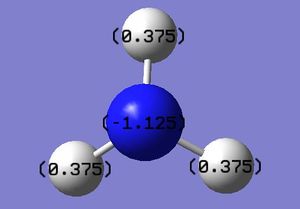
Charge range: -1.125 to +1.125
Specific NBO charges within NH3:B3LYP/6-31G(d,p)
Optimisation of NH3BH3
Optimisation of NH3BH3
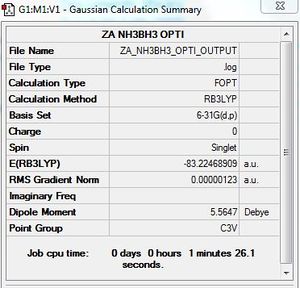
B3LYP/6-31G (d,p) level
Optimisation log file here
| summary data | convergence | Jmol | |||
|---|---|---|---|---|---|
|
Item Value Threshold Converged? Maximum Force 0.000002 0.000015 YES RMS Force 0.000001 0.000010 YES Maximum Displacement 0.000023 0.000060 YES RMS Displacement 0.000010 0.000040 YES Predicted change in Energy=-8.849071D-11 |
|
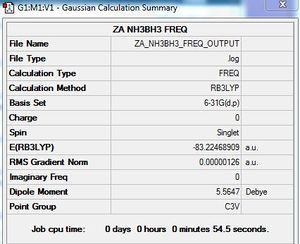
Frequency calculation: NH3BH3
B3LYP/6-31G (d,p) level
Frequency file: here
| summary data | low modes |
|---|---|
|
Low frequencies --- -5.5831 -0.3050 -0.0444 0.0008 1.2174 1.2901 Low frequencies --- 263.2843 632.9623 638.4603 |
Vibrational spectrum for NH3BH3
| wavenumber | Intensity | IR active? | type |
| 263 | 0 | no | twist |
| 633 | 14 | very slight | stretch |
| 638 | 4 | very slight | bend |
| 638 | 4 | very slight | bend |
| 1069 | 41 | yes | bend |
| 1069 | 41 | yes | bend |
| 1196 | 109 | yes | bend |
| 1204 | 3 | very slight | bend |
| 1204 | 3 | very slight | bend |
| 1329 | 114 | yes | bend |
| 1676 | 28 | yes | bend |
| 1676 | 28 | yes | bend |
| 2472 | 67 | yes | stretch |
| 2532 | 231 | yes | stretch |
| 2532 | 231 | yes | stretch |
| 3464 | 3 | extremely slight | stretch |
| 3581 | 28 | yes | stretch |
| 3581 | 21 | yes | stretch |
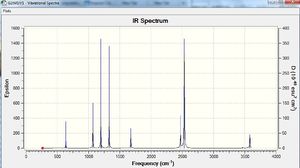
The results show there are eighteen vibrations. However, only nine bands are observed. This is due to the twist at 263 cm-1 being IR inactive as it does not result in a change in dipole moment. The degenerate vibrations at 638, 1069, 1676, 2532 and 3581 cm-1 appears one peak for each of the two degenerate vibrations. Peaks at 633 and 1203 cm-1 that are not observed on the spectrum due to their low intensity.
Comparison of energies of NH3BH3 molecule and NH3 - BH3 fragements
E(BH3) = -26.6153236 a.u
E(NH3) = -56.5577687 a.u
Energy of association of acid-base pair:
ΔE=E(NH3BH3)-[E(NH3)+E(BH3)] = -135.47 kJ/mol
By comparison with the strongest known covalent bond, the N2 triple bond, the association of ammonia and borane is weak. It is however, stronger than a weak bond. It would be classed as a medium strength bond.
Optimisation of AlCl4Br2
AlCl4Br2 - Isomer 1
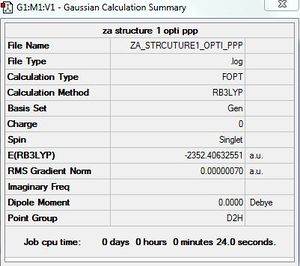
Symmetry of isomer 1 - D2h
Optimisation of AlCl4Br2 - Isomer 1
B3LYP/6-31G/LANL2DZ
Optimisation log file here
| summary data | convergence | Jmol | |||
|---|---|---|---|---|---|
|
Item Value Threshold Converged? Maximum Force 0.000002 0.000015 YES RMS Force 0.000001 0.000010 YES Maximum Displacement 0.000043 0.000060 YES RMS Displacement 0.000016 0.000040 YES Predicted change in Energy=-1.794814D-12 |
|
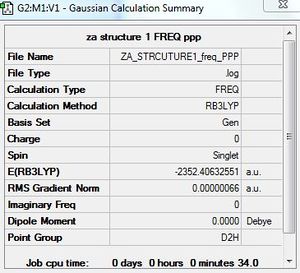
Frequency calculation: AlCl4Br2 - Isomer 1
B3LYP/6-31G/LANL2DZ
Frequency file: here
| summary data | low modes |
|---|---|
|
Low frequencies --- -0.8495 -0.0029 -0.0027 -0.0024 1.2778 1.3918 Low frequencies --- 16.0699 63.6253 86.1141 |
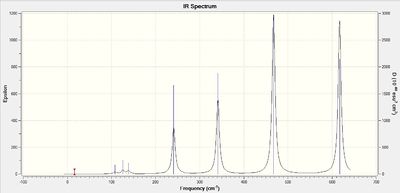
Vibrational spectrum for AlCl4Br2 - Isomer 1
| wavenumber | Intensity | IR active? | type | |
| 16 | 0 | no | Al-Cl no vibration | Al-Br bend |
| 64 | 0 | no | Al-Cl bend | Al-Br no vibration |
| 86 | 0 | no | Al-Cl bend | Al-Br bend |
| 87 | 0 | no | Al-Cl bend | Al-Br bend |
| 108 | 5 | yes | Al-Cl bend | Al-Br no vibration |
| 111 | 0 | no | Al-Cl no vibration | Al-Br twist |
| 126 | 8 | yes | Al-Cl bend | Al-Br rocking |
| 135 | 0 | no | Al-Cl bend | Al-Br rocking |
| 138 | 7 | very slight | Al-Cl bend | Al-Br wagging |
| 162 | 0 | no | Al-Cl bend | Al-Br bend |
| 197 | 0 | no | Al-Cl bend | Al-Br bend |
| 241 | 100 | yes | Al-Cl bend | Al-Br rocking |
| 247 | 0 | no | Al-Cl bend | Al-Br wagging |
| 341 | 161 | yes | Al-Cl symmetric stretch | Al-Br symmetric stretch |
| 468 | 346 | yes | Al-Cl asymmetric stretch | Al-Br stretch |
| 494 | 0 | no | Al-Cl symmetric stretch | Al-Br symmetric stretch |
| 609 | 0 | no | Al-Cl symmetric stretch | Al-Br symmetric stretch |
| 617 | 332 | yes | Al-Cl asymmetric stretch | Al-Br asymmetric stretch |
The computed IR spectrum shows seven bands. However, there are eighteen vibrational modes. Only seven bands are observed due to eleven modes being IR inactive. The IR inactive vibrations are inactive as they do not result in an overall change in dipole moment.
AlCl4Br2 - Isomer 2
Symmetry of isomer 2 - C2h
Optimisation of AlCl4Br2 - Isomer 2
B3LYP/6-31G/LANL2DZ level
Optimisation log file here
| summary data | convergence | Jmol | |||
|---|---|---|---|---|---|

|
Item Value Threshold Converged? Maximum Force 0.000020 0.000450 YES RMS Force 0.000008 0.000300 YES Maximum Displacement 0.000243 0.001800 YES RMS Displacement 0.000096 0.001200 YES Predicted change in Energy=-7.655364D-09 |
|
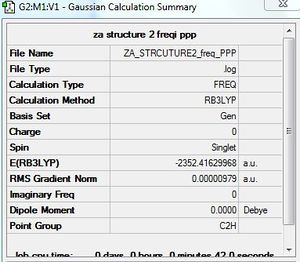
Frequency calculation: AlCl4Br2 - Isomer 2
B3LYP/6-31G/LANL2DZ level
Frequency file: here
| summary data | low modes |
|---|---|
|
Low frequencies --- -1.5733 -1.3897 -0.2647 -0.0033 -0.0025 -0.0023 Low frequencies --- 18.2042 49.1393 72.8927 |
Vibrational spectrum for AlCl4Br2 - Isomer 2
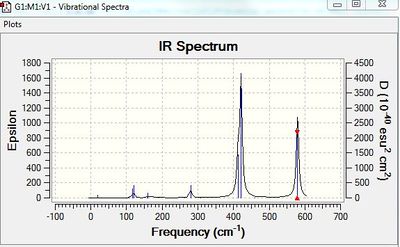
| wavenumber | Intensity | IR active? | type | |
| 18 | 0 | no | terminal Al-Cl bend | Al-Br bend |
| 49 | 0 | no | Al-Cl bend | Al-Br no vibration |
| 73 | 0 | no | Al-Cl bend | Al-Br bend |
| 105 | 0 | no | Al-Cl twist | Al-Br bend |
| 109 | 0 | no | Al-Cl twist | Al-Br no vibration |
| 117 | 9 | slight | terminal Al-Cl bend | Al-Br bend |
| 119 | 13 | slight | terminal Al-Cl bend | Al-Br bend |
| 157 | 0 | no | terminal Al-Cl bend | Al-Br bend |
| 159 | 6 | very slight | Al-Cl wagging | Al-Br bend |
| 192 | 0 | no | Al-Cl bend | Al-Br bend |
| 263 | 0 | no | Al-Cl bend | Al-Br bend |
| 280 | 29 | yes | terminal Al-Cl asymmetric stretch | Al-Br stretch |
| 308 | 0 | no | Al-Cl symmetric stretch | Al-Br stretch |
| 413 | 149 | yes | Al-Cl asymmetric stretch | Al-Br stretch |
| 421 | 438 | yes | Al-Cl asymmetric stretch | Al-Br asymmetric stretch |
| 459 | 0 | no | Al-Cl symmetric stretch | Al-Br symmetric stretch |
| 575 | 0 | no | Al-Cl symmetric stretch | Al-Br symmetric stretch |
| 580 | 316 | yes | terminal Al-Cl asymmetric stretch | Al-Br asymmetric stretch |
As with isomer 1, the IR spectrum does not show peaks corresponding to all of the observed vibrations. This is due to IR inactive vibrations not being observed. There are also bands very similar in frequency. This results in the relatively low intensity bands appearing as one peak. For example, the peaks at 117 and 119 cm-1.
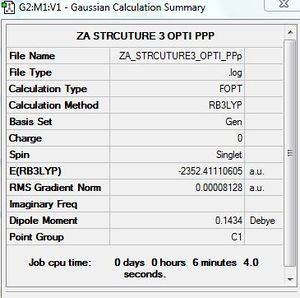
AlCl4Br2 - Isomer 3
Symmetry of isomer 3 - C1
Optimisation of AlCl4Br2 - Isomer 3
B3LYP/6-31G/LANL2DZ level
Optimisation log file here
| summary data | convergence | Jmol | |||
|---|---|---|---|---|---|
|
Item Value Threshold Converged? Maximum Force 0.000159 0.000450 YES RMS Force 0.000050 0.000300 YES Maximum Displacement 0.000452 0.001800 YES RMS Displacement 0.000187 0.001200 YES Predicted change in Energy=-5.937165D-08 |
|
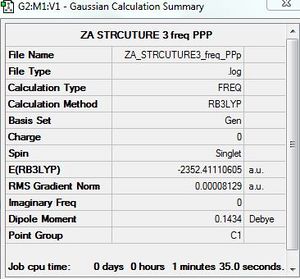
Frequency calculation: AlCl4Br2 - Isomer 3
B3LYP/6-31G/LANL2DZ level
Frequency file: here
| summary data | low modes |
|---|---|
|
Low frequencies --- -1.4179 -0.0032 -0.0026 -0.0008 1.3075 2.8005 Low frequencies --- 17.0008 55.9563 80.0686 |
Vibrational spectrum for AlCl4Br2 - Isomer 3
| wavenumber | Intensity | IR active? | type | |
| 17 | 0 | no | bridging Al-Br bend | terminal Al-Br no vibration |
| 55 | 0 | no | brdiging Al-Br bend | Al-Br no vibration |
| 80 | 0 | no | bridging Al-Br bend | terminal Al-Br bend |
| 92 | 1 | extremely slight | bridging Al-Br twist | terminal Al-Br bend |
| 107 | 0 | no | bridging Al-Br twist | terminal Al-Br no vibration |
| 110 | 5 | very slight | bridging Al-Br bend | terminal Al-Br bend |
| 121 | 8 | very slight | bridging Al-Br bend | terminal Al-Br bend |
| 149 | 5 | very slight | bridging Al-Br bend | terminal Al-Br bend |
| 154 | 6 | very slight | bridging Al-Br bend | terminal Al-Br bend |
| 186 | 1 | no | bridging Al-Br bend | terminal Al-Br bend |
| 211 | 10 | yes | bridging Al-Br bend | terminal Al-Br bend |
| 257 | 10 | yes | bridging Al-Br stretch | terminal Al-Br stretch |
| 289 | 49 | yes | bridging Al-Br stretch | terminal Al-Br stretch |
| 385 | 151 | yes | bridging Al-Br stretch | terminal Al-Br stretch |
| 423 | 275 | yes | bridging Al-Br stretch | terminal Al-Br stretch |
| 493 | 108 | yes | bridging Al-Br stretch | terminal Al-Br stretch |
| 575 | 122 | yes | bridging Al-Br stretch | terminal Al-Br stretch |
| 615 | 197 | yes | bridging Al-Br stretch | terminal Al-Br stretch |
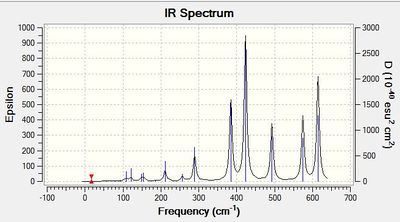
The IR spectrum does not show peaks corresponding to all of the eighteen calculated vibrations. 12 peaks are observed. This is due to the first five vibrations and the vibration corresponding to 186 cm-1 being IR inactive. These vibrations do not result in a change in dipole moment.
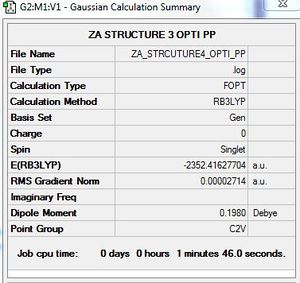
AlCl4Br2 - Isomer 4
Symmetry of isomer 4 - C2v
Optimisation of AlCl4Br2 - Isomer 4
B3LYP/6-31G/LANL2DZ level
Optimisation log file here
| summary data | convergence | Jmol | |||
|---|---|---|---|---|---|
|
Item Value Threshold Converged? Maximum Force 0.000043 0.000450 YES RMS Force 0.000025 0.000300 YES Maximum Displacement 0.001737 0.001800 YES RMS Displacement 0.000538 0.001200 YES Predicted change in Energy=-9.903822D-08 |
|
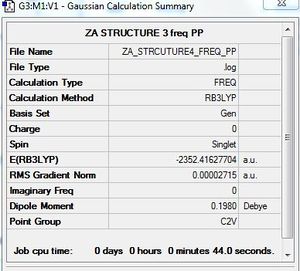
Frequency calculation: AlCl4Br2 - Isomer 4
B3LYP/6-31G/LANL2dz level
Frequency file: here
| summary data | low modes |
|---|---|
|
Low frequencies --- -1.9412 -1.6179 0.0037 0.0042 0.0043 1.1453 Low frequencies --- 17.4819 51.0454 78.6308 |
Vibrational spectrum for AlCl4Br2 - Isomer 4
| wavenumber | Intensity | IR active? | type | |
| 17 | 0 | no | Al-Cl bend | Al-Br no vibration |
| 51 | 0 | no | Al-Cl bend | Al-Br no vibration |
| 79 | 0 | no | Al-Cl bend | Al-Br bend |
| 99 | 0 | no | Al-Cl bend | Al-Br bend |
| 104 | 3 | very slight | Al-Cl bend | Al-Br bend |
| 121 | 13 | yes | Al-Cl bend | Al-Br bend |
| 122 | 6 | slight | Al-Cl bend | Al-Br bend |
| 157 | 0 | no | Al-Cl twist | Al-Br bend |
| 158 | 6 | very slight | Al-Cl wagging | Al-Br bend |
| 194 | 2 | very slight | bridging Al-Br bend | terminal Al-Br bend |
| 264 | 0 | no | Al-Cl twist | Al-Br bend |
| 279 | 26 | yes | Al-Cl stretch | Al-Br stretch |
| 308 | 2 | very slight | Al-Cl stretch | Al-Br stretch |
| 413 | 149 | yes | Al-Cl stretch | Al-Br stretch |
| 420 | 408 | yes | Al-Cl asymmetric stretch | Al-Br stretch |
| 461 | 36 | yes | Al-Cl symmetric stretch | Al-Br symmetric stretch |
| 571 | 34 | yes | Al-Cl asymmetric stretch | Al-Br asymmetric stretch |
| 583 | 276 | yes | Al-Cl symmetric stretch | Al-Br symmetric stretch |
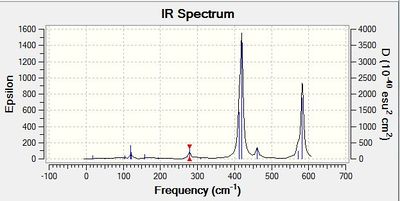
The IR spectrum does not show peaks corresponding to all of the eighteen calculated vibrations. Six peaks are observed. This is due to seven IR inactive vibrations (intensity 0). Also, three low intensity vibrations do not have a corresponding peak on the IR spectrum. The low intensity of these peaks is due to the change in dipole moment being relatively weak.
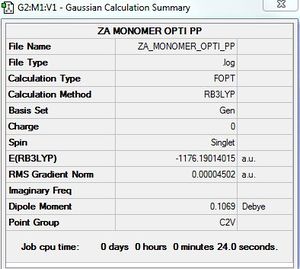
AlBrCl2 monomer: B3LYP/GEN
Optimisation of AlBrCl2 monomer
B3LYP/6-31G?LANL2DZ level
Optimisation log file here
| summary data | convergence | Jmol | |||
|---|---|---|---|---|---|
|
Item Value Threshold Converged? Maximum Force 0.000149 0.000450 YES RMS Force 0.000078 0.000300 YES Maximum Displacement 0.000751 0.001800 YES RMS Displacement 0.000541 0.001200 YES Predicted change in Energy=-9.241407D-08 |
|
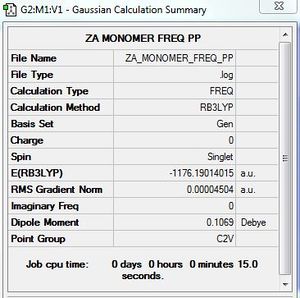
Frequency calculation: AlBrCl2 monomer
B3LYP/6-31G/LANL2DZ level
Frequency file: here
| summary data | low modes |
|---|---|
|
Low frequencies --- -0.0035 -0.0035 -0.0019 3.3756 3.6552 4.1209 Low frequencies --- 120.7185 133.9343 185.8750 |
Vibrational spectrum for AlBrCl2 monomer
| wavenumber | Intensity | IR active? |
| 121 | 5 | slight |
| 134 | 6 | slight |
| 186 | 33 | yes |
| 314 | 7 | slight |
| 552 | 174 | yes |
| 614 | 186 | yes |
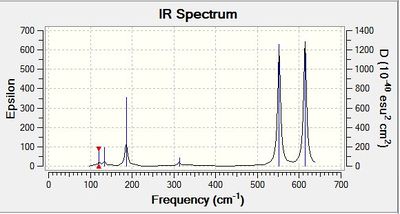
All six vibrational modes are IR active and bands are observed on the computed spectrum.
Energy of AlBr2 Cl4 isomers
Table 1 - relative energies of four isomers
| Isomer in order of stability | Energy (a.u) | Relative energy (kJ/mol) |
| 2 (most stable) | -2352.4162997 | Reference |
| 4 | -2352.4162770 | 0.06 |
| 3 | -2352.4111061 | 13.64 |
| 1 (least stable) | -2352.4063255 | 26.19 |
The lowest energy isomer is isomer 2. In this conformer, the Br atoms are in the terminal position and trans to each other. This orientation of the Br eliminates steric hindrance between them. As they are the largest atoms, reducing steric hindrance between them results in a large stabilisation of this conformer relative to the other isomers. The distance between the Br atoms is 6.77 A. This is larger than twice the van der Waals radius of Br (3.80 A). This indicates there are no steric clashes between the Br atoms.
The next most stable conformer is that of isomer 4. Orientating the Br atoms cis to each other results in the two atoms being closer together than the Br atoms of isomer 2. This could result in the small destabilisation due to steric clashes. The differences between the distances between the terminal Br atom and terminal Cl atom and the terminal Br atom and bridging Cl atom are very small. Likewise, the deviation between bond angles between the terminal Br-Al-bridging Cl and the terminal Br-Al-terminal Cl is also small. Hence, the steric repulsions with the Cl atoms does not account for the small destabilisation of isomer 4 relative to isomer 2.
Isomer 3 is less stable than isomer 2. The distance of 3.33 A between the Br atoms is much shorter than that between the Br of isomer 2. This suggests there is greater steric repulsion between the Br atoms in isomer 3 hence, it is less stable. This is confirmed by comparison with the van der Waals radii of Br. The distance of 3.33 A is less than the combined van der Waals radius of 3.80 A. This suggests the two Br atoms are close enough to have repulsive interactions. The bond angle of 109.5o between the terminal Br-Al-terminal Cl is smaller in isomer 3 than the angle of 121.5o in isomer 2. Greater steric hindrance between the terminal Br and terminal Cl will be present in isomer 3. The distance of 3.41 A between this terminal Br and terminal Cl in isomer 3 is less than the distance of 3.81 A between them in isomer 2. The combined van der Waals radii of Cl and Br is 3.65 A. The Br and Cl atoms are closer than the van der Waals radii in isomer 3 whereas they are further than the van der Waals radii in isomer 2. The greater steric clashes of the terminal Br and terminal Cl in isomer 3 could also contribute to the destabilisation of this conformer relative to that of isomer 2.
The least stable conformer is that of isomer 1. Having the two Br atoms in the bridging position results in the distance between them being much smaller than the distance between them in isomer 2. The two Br atoms are 3.57 A apart. This is closer than the combined van der Waals radii of 3.8 A. This suggests there will be steric hindrance between the two atoms. The Al-Br-Al bond angle is much smaller than the Al-Cl-Al bond angle of isomer 2.
Comparison of the four isomers shows the conformers in which the Br are terminal are more stable than when Br is in the bridging position.
Dissociation energy of isomer 2 into monomer
The dissociation energy was calculated for the lowest energy isomer into 2 AlBrCl2 monomers.
E(AlCl2Br monomer) = -1176.1901402 a.u
E(2AlCl2Br isomer 2) = -2352.4162997 a.u
ΔE = -0.0360194 a.u. = -94.57 kJ/mol
The product is more stable than the isolated monomers.
Comparison of IR spectra of isomers
The symmetry of the conformer determines the number of IR bands observed in the IR spectrum. The point group of the conformer can be used to determine the IR active normal modes using their symmetry labels. Normal modes with symmetry label corresponding to the x, y or z axes will be IR active. Isomer 3 has the greatest number of bands in the computed IR spectrum. This conformer only has a C1 rotational axis. As it is not a symmetric molecule, it will have the greatest number of bends and stretches resulting in a change in dipole moment and therefore, the greatest number of IR active vibrational modes.
IR active bands
Molecules can undergo vibrational excitation when a certain frequency of light corresponding to the energy gap between the quantised vibrational energy levels is absorbed. In IR spectroscopy, a beam of polychromatic light is passed through the sample and the intensity of the transmitted light is detected. The transmission is used to obtain the frequencies at which the molecule absorbs light and is vibrationally excited. For a vibrational transition to be IR active, the vibration on absorption of IR light must result in a change in electric dipole moment of the molecule. Interactions of the oscillating electric field with the changing dipole moment will result in excitation to a higher energy vibrational mode if the frequency of radiation corresponds to vibrational frequency of the molecule.
Comparison of terminal and bridging stretches
The Al-Br asymmetric stretch at 341 cm-1 for isomer 1 can be compared to the asymmetric stretch at 385 cm-1 of isomer 3. Swapping one of the Br atoms from the bridging position to the terminal position results in an increase in vibrational frequency. This is due to the reduction in mass upon changing from bromine to chlorine. The reduced mass is inversely proportional to the vibrational frequency thus, an increase is seen. The increase in wavenumber could also be due to an increase in bond strength. Aluminium and chlorine are in the same row of the Periodic Table therefore, there will be a better overlap of the 3p orbitals of the Al and Cl than the 3p of Al and 4p of Br. This could result in a stronger bond being formed to Cl and hence, increase the vibrational frequency upon substituting the bridging Br for a bridging Cl. A further increase in vibrational frequency is observed on changing the remaining bridging Br atom to another bridging Cl atom as in isomers 2 and 4. This is due to a further decrease in mass.
The vibrational frequency for this mode does not change dramatically between the cis and trans arrangements of the terminal Br atoms. The vibration occurs as a result of the stretching of bridging bonds thus, changing the arrangement of the Br atoms in the terminal positions will not make a difference to the vibrational frequency.
The terminal Al-Cl stretch can be compared for the four isomers. Isomer 1 has four terminal Al-Cl bonds with a stretching frequency of 617 cm-1. On going from isomer 1 to isomer 3 by changing one of the terminal Cl to a terminal Br, the stretching frequency of the bond decreases to 614 cm-1. This decrease in vibrational frequency is due to an increase in the reduced mass of the bond. However, the overall vibration is still dominated by the three remaining Al-Cl vibrations. The Al-Br stretch is relatively small. Therefore, only a small decrease is observed. A greater decrease is observed when there are two terminal Al-Br bonds as in isomers 2 and 4. A decrease from 614 to 580 cm-1 (isomer 1 to isomer 2) is seen due to a greater effect of the reduced mass. The vibration of two bonds rather than one bond is reduced due to increasing the mass of the atom involved in the stretch. This has a larger effect on the vibrational frequency.
Analysis of occupied non-core molecular orbitals of isomer 2
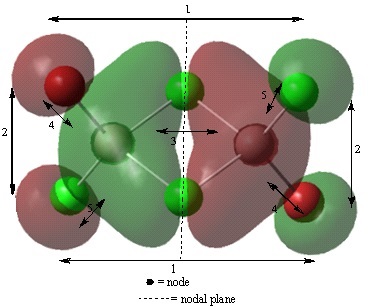
Non-core orbital 46
Bonding interactions
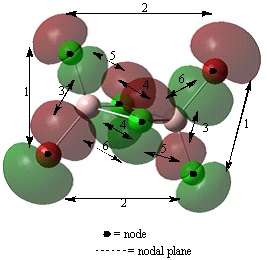
(2) There is a long range, in phase, bonding interaction between the p like orbitals localised on terminal Cl and Br atoms orientated cis to each other. The interactions occur through space, over a long distance. Therefore, this is a weak bonding interaction.
(4) There is a short range, in phase, bonding interaction between the two p orbitals localised on bridging Cl atoms. This resembles a pi type interaction however, cannot be classified as a pi bond as the electron density is localised at the two Cl atoms and not between them. Also, optimisation of the structure shows the two Cl atoms are not actually bonded. This interaction occurs over a smaller distance than interaction (2) therefore, it will be a strong interaction.
Antibonding interactions
(1) There is a long range, out of phase, antibonding interaction through space between the p like orbitals localised on the terminal Cl and Br atoms. This interaction will be stronger than interaction (2) are closer together with a distance of 3.81 angstroms compared to 5.81 between the atoms of orbitals in interaction (2).
(3) There is a through space, out of phase interaction between the alternate lobes of the p orbitals in interaction (1). This interaction will be stronger than interaction (1) as the lobes are closer together. This is a very strong antibonding interaction.
(5) There is a short range, out of phase, antibonding interaction through space between the p like orbitals of the bridging and terminal Cl. The distance between these atoms of 3.59 angstroms is shorter than the distance of 3.75 angstroms between the bridging Cl and terminal Br. Therefore, this will be a stronger antibonding interaction.
(6) There is a short range, out of phase, antibonding interaction between the p like orbitals of the bridging Cl and the terminal Br. This interaction is weaker than interaction (5).
Overall, although this molecular orbital has a greater number of antibonding than bonding interactions, it is a non-bonding molecular orbital. This is because the orbitals observed are localised on the halogens and appear to be p like orbitals. It is possible that these are the lone pairs of the halogens. The orbital contribution is larger on the bromine atoms than on the chlorine atoms. This is due to bromine having 4p orbitals that are slightly larger than the 3p of chlorine.
Non-core orbital 44
Bonding interactions
(1) There is a through space, in phase, bonding interaction between the p like orbitals on the bridging and terminal Cl atoms. The distance of 3.59 angstroms is relatively large compared to the distance between the two bridging Cl atoms therefore, the bonding interaction is weak.
Antibonding interactions
(2) There is a through space, out of phase, antibonding interaction between the orbitals on the bridging Cl atoms. The orbital contributions of these orbitals is large in comparsion to orbitals of the terminal Cl atoms. The atoms are also closer together than the atoms of interation (1). Therefore, this antibonding interaction will be strong.
The part of the molecular orbital located at the terminal chlorine atoms appears to be two p type orbitals localised at the chlorine atoms. This contribution to the overall molecular orbital is small and can be ignored. The majority of the orbital is concentrated at the bridging chlorine atoms. This part of the molecular orbital appears to be as a result of an antibonding interaction between the two p orbitals on the chlorine atoms. Overall, this molecular orbital is antibonding as antibonding interactions are stronger than bonding interactions.
Non-core orbital 38
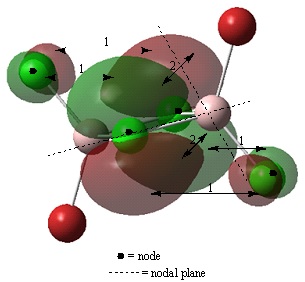
There is a large bonding region located on the four membered ring in this molecular orbital. This is a strongly bonding interaction. This could be due to a sigma type interaction of the p orbitals of the terminal halogens and the aluminium atoms as well as an interaction of the p orbitals of the aluminium with the bridging halogens. However, if this were the case, a phase change would be seen along the green bonding region. It is likely that the s orbital of the aluminium is interaction with the p orbitals of the halogen to give a large region of in phase overlap. The arrows 1, 2 and 3 show the contribution of the p orbital to the bonding region of the molecular orbital. This orbital is strongly bonding compared to orbitals 46 and 44.
Non-core orbital 37
Bonding interactions
(2) There is a through space, in phase, bonding interaction between the terminal bromine and chlorine atoms. This interaction is weak due to the long distance of 3.81 angstroms between the atoms.
Antibonding interactions
(1) There is a through space, out of phase, antibonding interaction between the terminal halogens. This interaction is very weak in comparison to interaction (2) as the distance between the atoms is larger. This is therefore a very weak interaction.
(4) (5) There is an along bond, out of phase, antibonding interaction between the terminal halogens and the region of delocalised electron density across the Cl-Al-Cl bridge. As this is along a bond, this will be a very strong antibonding interaction.
(3) There is a through space, out of phase, antibonding interaction between the electron clouds on the four membered ring. This will be a very strong antibonding interaction as there is a large concentration of the molecular orbital within this region. They are also very close together, therefore this interaction is the strongest.
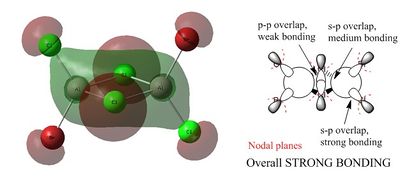
Each of the bonding region across the three atoms of the Al-Cl-Al bridge occurs due to the overlap of the p orbitals of the aluminium and bridging chlorine atoms. This shows there is a delocalisation of electron density across the 3 atoms. Overall, this molecular orbital is antibonding due to the presence of stronger antibonding interactions.
Non-core orbital 31
This orbital is a strongly bonding interaction of delocalised s orbitals primarily from the bridging chlorine atoms. The part of the molecular orbital on the terminal chlorine atom is small and can be ignored. There are no antibonding interactions therefore, this is the most bonding orbital of the five analysed.
Conclusion
The energies of four isomers of AlBr2Cl4 were calculated to determine the lowest energy conformer. The lowest energy conformer was found to be that in which the two Br atoms were terminal and trans to each other. This was the most stable conformer as this orientation minimises steric hindrance. Frequency analysis was carried out on each conformer and IR spectra were computed. A difference in symmetry between the conformers resulted in a difference in the IR active vibrational modes between conformers and therefore, different IR spectra for each conformer. The molecular orbitals were computed for the lowest energy isomer. Five of the computed orbitals were analysed to determine their bonding character. The molecular orbitals ranged from bonding to antibonding. A difference in energy was observed between core and non core molecular orbitals.
References
- ↑ Richard Van Noorden, June 2008, Cheaper Catalysts Designed by Computer, Chemistry World
- ↑ Yu-Ran Luo. Bond Dissociation Energies, Handbook of Chemistry and Physics, 87th online ed. http://www.hbcpnetbase.com/, 2010
- ↑ Dr Patricia Hunt, Lecture 2 Tutorial Problems, lecture notes distributed in Molecular Orbitals in Inorganic Chemistry, Imperial College London, 2013

