Rep:Mod:yusrah
Introduction
In this report the real MO's of simple triatomics and tetrahedral molecules are studied computationally using Gaussview software. Various basis sets to optimise for geometry, energy and frequency are used. For all optimisations, the values for: Maximum Force, RMS Force, Maximum Displacement, RMS Displacement must converge before a frequency analysis can be run. The frequency analysis must indicate the presence of very 'low frequencies' before any further analysis is done. The effects of varying the ligand, central element, symmetry and will be studied. A frequency analysis is undergone to allow for vibrational analysis of the resulting molecule. The real molecular orbitals for BH3 are studied and are compared to the MO obtained from the valence MO diagram using the LCAO approach. The mini project chosen is ionic liquids.
BH3
| BH3 | BBr3 | GaBr3 | |
|---|---|---|---|
| r(E-X)(Å) | 1.19 | 1.93 | 2.26 |
| θ(X-E-X)(°) | 120.0 | 120.0 | 120.0 |
B3LYP/3-21G level
Optimisation file: here
Here the symmetry of BH3 is not constrained to D3h symmetry as the bond lengths for the B-H bonds were constrained to 1.53,1.54 and 1.55Å before optimisation. BH3 is constrained to D3h below where the BH3 is now optimised under B3LYP/6-31G(d,p)level and is constrained to D3h symmetry before and after the optimisation.
B3LYP/6-31G(d,p)level
Optimisation log file here
| summary data | convergence | Jmol | |||
|---|---|---|---|---|---|
 |
Item Value Threshold Converged? Maximum Force 0.000001 0.000015 YES RMS Force 0.000001 0.000010 YES Maximum Displacement 0.000005 0.000060 YES RMS Displacement 0.000003 0.000040 YES |
|
B3LYP/6-31G(d,p)level
Frequency file: here
| summary data | low modes |
|---|---|

|
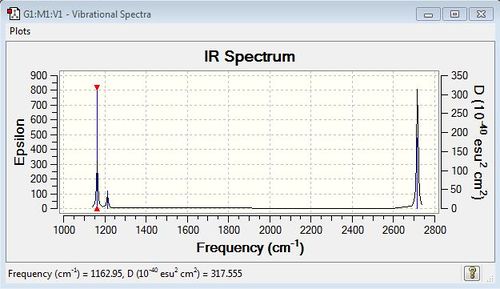
Low frequencies --- -14.5327 -14.5286 -10.8391 -0.0002 0.0168 0.3451 Low frequencies --- 1162.9507 1213.1229 1213.1232 |
Vibrational Analysis
| wavenumber (cm-1) | Intensity | IR active? | type |
| 1163 | 93 | yes | bend (wagging) umbrella motion |
| 1213 | 14 | yes (very slight) | bend (rocking) |
| 1213 | 14 | yes (very slight) | bend (scissoring) |
| 2583 | 0 | no | stretch (symmetric) |
| 2716 | 126 | yes | stretch (antisymmetric) |
| 2716 | 126 | yes | stretch (antisymmetric) |
The IR peaks that both have the same frequency are degenerate. Bends have a lower energy than stretches than stretches and hence have a lower frequency. In order for a stretch/bend to be IR active there must be an overall change in dipole moment for the molecule; if there isn't it is IR inactive (for e.g. symmetric stretches) and hence is not seen in the IR spectrum in most cases, unless the symmetry of the motion can be broken.
IR Spectrum
MO analysis
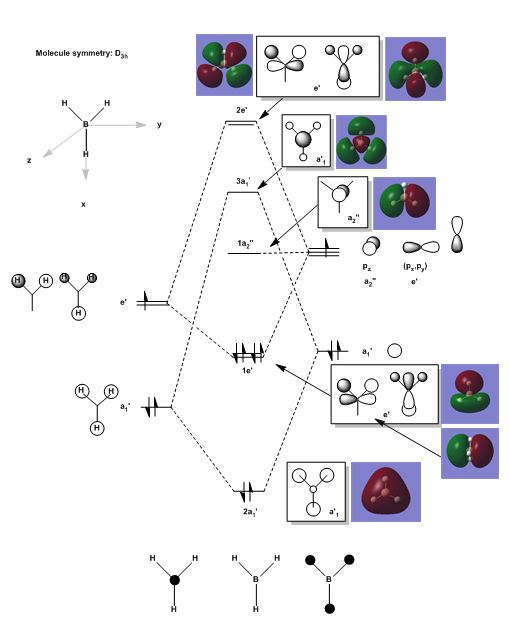
MO Diagram for BH3
| Orbital symmetry | Computed MO | LCAO MO | Comparison |
|---|---|---|---|
| 1a1 ' ' |  |
 |
This is a core orbital, therefore there are no significant differences between the atomic orbital predicted and that computed by Gaussian software. |
| 2a1 ' ' |  |
 |
The real MO implies that their is an equal contribution from all atoms, whereas the LCAO MO predicts a greater contribution from the hydrogen 1s orbitals than from the 2s of the boron atom, which presents doubt about the relative positioning of the atomic orbitals placed on the valence MO diagram for BH3 (please see MO diagram above) the boron atom 2s and the the a1 ' may be closer in energy than expected from the qualitative MO diagram. |
| 1e' |  |
 |
The visual difference between the real MO and the LCAO MO is more obvious here, on the combination of the e' orbitals from the hydrogen atoms and from boron, the orbitals in the real MO have formed a 'bonding' region where the electrons may be found, the node is the same position for both LCAO and Real MO's. |
| 1e' | 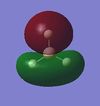 |
 |
The node is in the same position for both real MO and LCAO but again the extent to which the bonding orbital is 'bonding' is underestimated. |
| 1a2 ' ' |  |
 |
Here the prediction by qualitative MO theory is good as it is an atomic orbital. |
| 3a1 ' | 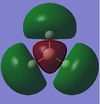 |
 |
The contribution from the boron atom to the overall antibonding orbital is underestimated, which again raises concern for the relative positions of the atomic orbitals in the qualitative MO diagram. However, the nodes are again in the correct positions. |
| 2e' ' | 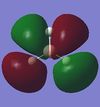 |
 |
Here the predicted MO from the qualitative MO diagram is in good agreement with the real MO the relative contributions from the atomic orbitals are fairly accurate, and again the nodes are in the correct positions. |
| 2e' ' | 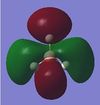 |
 |
Here there is a bonding region running through the boron atom, which is not predicted by the qualitative MO diagram, also there is 1 less node in the real MO as compared to the MO predicted from the qualitative MO diagram; therefore it is more 'bonding' than predicted. |
As stated above, the relative contributions from each atoms to the final MO is often under/over estimated. Furthermore the extent of overlap is often approximated incorrectly and hence the amount of ‘bonding' or ‘anitbonding’ an MO is, cannot be determined with great accuracy from a qualitative MO diagram. However, the qualitative MO diagram may not be extremely accurate but it is still a useful guide to what the real MO looks like, and is fairly quick and simple to draw provided the molecule is small. Also in most cases it predicts the correct positioning of the nodes.
BBr3
B3LYP/GEN
Optimisation file: here
| summary data | convergence | Jmol | |||
|---|---|---|---|---|---|

|
Item Value Threshold Converged? Maximum Force 0.000017 0.000450 YES RMS Force 0.000009 0.000300 YES Maximum Displacement 0.000073 0.001800 YES RMS Displacement 0.000049 0.001200 YES |
|
The symmetry here is denoted as Cs however, it should've been constrained to D3h the time constraints meant this optimisation could not be repeated.
GaBr3
B3LYP/LAN2DZ
Optimisation log file here
| summary data | convergence | Jmol | |||
|---|---|---|---|---|---|

|
Item Value Threshold Converged? Maximum Force 0.000000 0.000450 YES RMS Force 0.000000 0.000300 YES Maximum Displacement 0.000003 0.001800 YES RMS Displacement 0.000002 0.001200 YES |
|
B3LYP/6-31G(d,p)level
Optimisation log file here
| summary data | convergence | Jmol | |||
|---|---|---|---|---|---|

|
Item Value Threshold Converged? Maximum Force 0.000000 0.000015 YES RMS Force 0.000000 0.000010 YES Maximum Displacement 0.000000 0.000060 YES RMS Displacement 0.000000 0.000040 YES |
|
B3LYP/6-31G(d,p)level
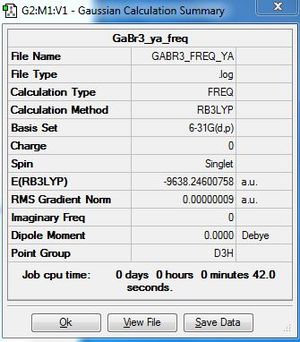
Frequency file: here
| summary data | low modes |
|---|---|
|
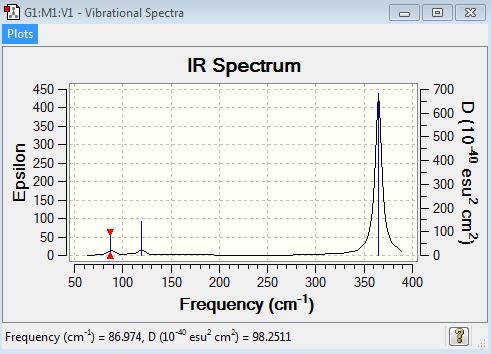
Low frequencies --- -2.3851 -2.3851 -1.4169 0.0058 0.0082 0.0269 Low frequencies --- 86.9740 86.9741 119.7677 |
Vibrational Analysis
| wavenumber | Intensity | IR active? | type |
| 87 | 2 | yes (very very slight) | bend (rocking) |
| 87 | 2 | yes (very very slight) | bend (scissoring) |
| 120 | 4 | yes (very very slight) | bend (wagging) |
| 235 | 0 | no | stretch (symmetrical) |
| 365 | 62 | yes | stretch (asymmetrical) |
| 365 | 62 | yes | stretch (symmetrical) |
IR Spectrum
Q What does the large difference in the value of the frequencies for BH3 compared to GaBr3 indicate? According to simple harmonic motion V=1/2π √(k/µ) , frequency of vibration (V) is proportional to the bond stiffness constant (k) and inversely proportional to the reduced mass (µ). As GaBr3 has heavier atoms than BH3 it has a greater reduced mass and therefore a lower vibrational frequency (for a particular vibrational mode) when compared to BH3. Br−Ga. 402 ± 13, 389 B-H. Reference: [1] Also the bond dissociation energies indicate B-H is a stronger bond, as it has a higher bond dissociation energy when compared to Ga-Br. This is due to the use of different atomic orbitals used for bonding. For BH3 it is the hydrogen (1s) and boron (2s and 2p) which are less diffuse than the atomic orbitals used for bonding in GaBr3 (4s and 4p); which indicates better overlap and hence stronger B-H bond compared to Ga-Br. As the bond dissociation energy is greater for B-H when compared to Ga-Br, B-H bond must have a higher stiffness constant (k); therefore a higher vibrational frequency for a particular vibrational mode when compared to the same vibrational mode of GaBr3.
Q Why must you use the same method and basis set for both the optimisation and frequency analysis calculations? So that the same level of accuracy is maintained throughout the analysis.
Q What is the purpose of carrying out a frequency analysis? To find all the vibrations (bends and stretches) for a particular molecule.
Q What do the "Low frequencies" represent?
As there are 3N-6 vibrational modes for non-linear molecules (N=number of atoms), and ‘3N’ are all the possible vibrations for every degree of freedom. It is the ‘-6’ that are these “low frequencies”, they are rotations or translations and therefore not vibrations so when counting the number of vibrational modes of a molecule, they must be subtracted. They should be zero but due to numerical errors they appear as small low positive or negative values.
Q Looking at the displacement vectors how has the nature of the vibration changed? Why? A In the umbrella motion the displacement vectors are different, in BH3 the displacement vectors indicate the hydrogen atoms are moving and not the central element, whereas in GaBR3 it is the central element that is undergoing the umbrella motion. This is due to the fact that the lighter elements will undergo the umbrella motion, in BH3 the light element is hydrogen, in GaBr3 the lighter element is Gallium so it is the gallium that undergoes the umbrella motion in GaBr3 and the hydrogen atoms in BH3.
Q There been a reordering of modes! This can be seen particularly in relation to the A2" umbrella motion. Compare the relative frequency and intensity of the umbrella motion for the two molecules. The ordering of modes can be rationalised by considering the other bends (rocking and scissoring) for both molecules. For GaBr3 it is the bromine atoms that undergo the rocking and the scissoring motion and vibrational frequency is inversely proportional to the square of the reduced mass. Bromine has a larger reduced mass than Gallium, any vibrational frequencies associated with the bromine atoms will be relatively lower in comparison to Gallium and hence the wagging motion is higher in frequency than the other bends for GaBr3. The intensity for the umbrella motion in GaBr3 is much lower than that in BH3 as Gallium is much heavier than hydrogen (the atoms that are undergoing the umbrella motion), it is more difficult for the Gallium atom to undergo this umbrella motion. The other bends (rocking and scissoring) are much lower in intensity for both molecules as they involve bringing some of the atoms closer together, which leads to repulsion. This is especially noticeable in GaBr3 where the scissoring bend for instance brings together two bromine atoms, this allows the lone pairs on the bromine atoms to be brought closer together and leads to high repulsion. For the scissoring in BH3, the hydrogen atoms are brought closer together as the atom has a smaller van der waals radii than bromine and has less electrons, but repulsion of bonding electrons still leads to this bend being less favourable than the umbrella motion.
Structure Comparison
Q What difference does changing the ligand have? Changing the ligand changes the bond length, the larger the ligand the larger the bond length. The bond angle hasn’t changed it remains 120° for both BBr3 and BH3 but the bond length has increased on the use of bigger ligands (with larger van der waal radii) for e.g. from BH3 to BBr3, there is the use of a larger atom bromine which has increased the bond length from 1.19Å to 1.93Å. As bromine has more electrons than hydrogen, the bond length increases to reduce repulsion between bonding electrons and electrons on bromine (also has bromine is a third row element bonds formed between boron and bromine will be weak relative to bonds between boron and hydrogen)
Q How are H and Br similar, how are they different? H has fewer electrons, and has a lower van der waals radius as a result. Bromine is also more electronegativity value of (2.96) as compared to hydrogen (2.04) on the Pauling scale.
Q What difference does changing the central element make? Bond length is affected. The larger the van der waals radius of the central atom the larger the bond length.
Q How are B and Ga similar, how are they different? Both elements are in the same group in the periodic table (group 13). Boron has 3 electrons, gallium has 31 electrons; therefore gallium has a larger van der waals radius. Boron is more electronegative than gallium with an electronegativity of (2.04) relative to that of gallium (1.81) on the Pauling scale of electronegativity. In addition answer the following in your questions on your wiki (your reply should be 2-3 paragraphs in length)
Q What is a bond? (2c-2e) bonds are how bonds are conventionally shown, and are represented by a solid line in diagrams; however this is not often true in reality. Hybridisation (the mixing of atomic orbitals for e.g. a 1s and two 2p orbital’s mix to be a hybrid sp2 orbital, where the superscript explains the relative weighting of each orbital to the hybrid orbital) is another simplified method of explaining chemical bonds. The more accepted theory is that of molecular orbital (MO) theory; where a bond is thought to be more like the distribution of electron density, it is the sum of all the orbital contributions in which the molecular orbitals are delocalised. Reference:[2] Some examples of specific bonds are covalent, polar covalent, ionic, bridging, (3c-2e) bonds etc. There are also weaker bonding interactions such as van der waals, dipole-dipole interactions, hydrogen bonding etc. A 100% covalent bond is when there is no difference in electronegativity between the atoms (in this case of the same element) involved in the bond and the electrons are shared equally between the atoms involved e.g. a Cl2. A polar covalent is also the sharing of electrons but unequally towards the more electronegative atom involved for e.g. in HF, the electrons will be distributed more towards the more electronegative fluorine atom. A more complex bond is the (3c-2e) bond where an electron deficient chemical bond tries to relieve its electron deficiency by sharing a pair of electrons between 3 atoms, like in diborane (B2H6), where a hydrogen atoms bridges between two boron atoms.
Q How much energy is there in a strong, medium and weak bond? Give examples of each type of bond (strong, medium and weak) For the comparison of bond strength’s it should be noted that the same bond type must be compared, and that the terms ‘weak’ or ‘strong’ are relative. An example of a strong bond is the Si-O sigma bond, bond dissociation energy (452kJ/mol), a medium bond strength is Si-Cl (381kJ/mol), a relatively weak bond is the Si-I bond (234kJ/mol). Reference: [3]
Q In some structures gaussview does not draw in the bonds where we expect, why does this NOT mean there is no bond? Gaussview bases its caluclations on DFT. A ‘single’ bond or ‘double’ bond is what you define it to be i.e. there is a certain range of values a bond length is considered to be. Gaussview has a certain range that is considered to be a bond, outside this range, Gaussview considers the two atoms to not be bonded (and hence the bond disappears) but this does not mean there is no bonding interaction in reality.
NH3
B3LYP/6-31G(d,p)
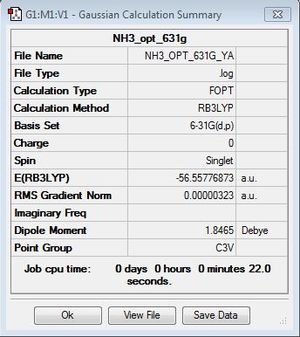
Optimisation log file here
| summary data | convergence | Jmol | |||
|---|---|---|---|---|---|
|
Item Value Threshold Converged? Maximum Force 0.000006 0.000450 YES RMS Force 0.000004 0.000300 YES Maximum Displacement 0.000012 0.001800 YES RMS Displacement 0.000008 0.001200 YES |
|
B3LYP/6-31G(d,p)level
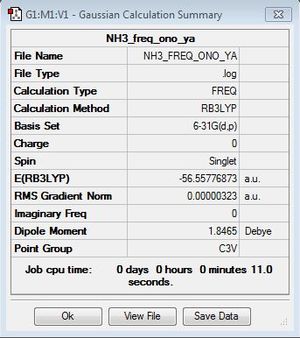
Frequency file: here
| summary data | low modes |
|---|---|
|
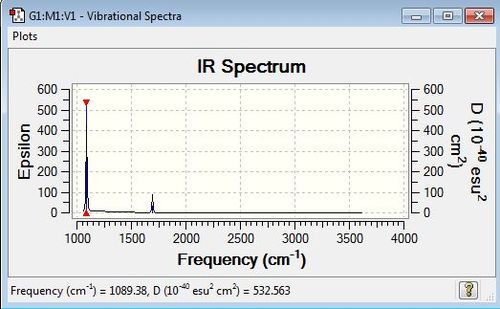
Low frequencies --- -0.0127 -0.0014 0.0017 7.0723 8.1016 8.1019 Low frequencies --- 1089.3849 1693.9369 1693.9369 |
Vibrational Analysis
| wavenumber (cm-1) | Intensity | IR active? | type |
| 1089 | 145 | yes | bend (wagging) |
| 1694 | 14 | yes (very slight) | bend (scissoring) |
| 1694 | 14 | yes (very slight) | bend (scissoring) |
| 3461 | 1 | no | stretch (symmetric) |
| 3590 | 0 | no | stretch (antisymmetric) |
| 3590 | 1 | no | stretch (antisymmetric) |
IR Spectrum
MO Analysis
B3LYP/6-31G(d,p)level
NBO Analysis
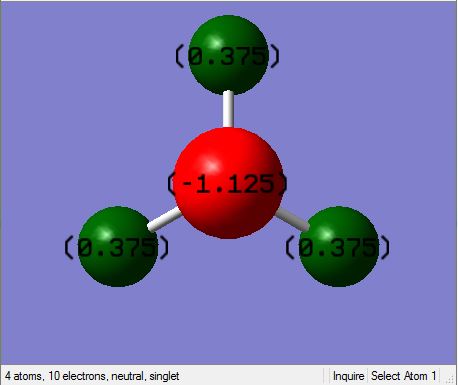
As you can see Nitrogen contributes 69% (as it is the most electronegative atom) whilst hydrogen contributes 31% to bonding.
Charge Distribution
NBO charges for Nitrogen and Hydrogen
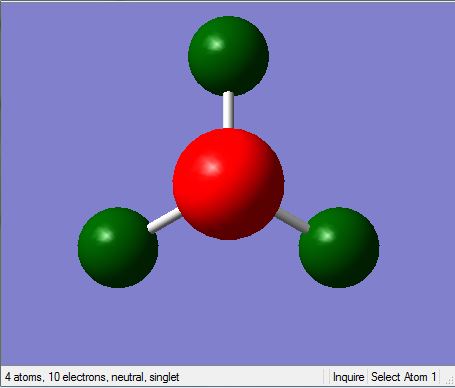
It can be seen here that the most electronegative element (nitrogen) has the highest charge distribution and hence is depicted as red (relatively negative) and hydrogen is depicted as relatively positive (green).
Ammonia Borane
Vibrational Analysis
| wavenumber (cm-1) | Intensity | IR active? | type |
| 264 | 0 | No | bend |
| 633 | 14 | yes (very slight) | Stretch (symmetrical) |
| 639 | 4 | yes (very slight) | bend |
| 639 | 4 | yes (very slight) | bend |
| 1069 | 41 | yes | bend |
| 1069 | 41 | yes | bend |
| 1196 | 109 | yes | bend |
| 1204 | 3 | yes (very slight) | bend |
| 1204 | 3 | yes (very slight) | bend |
| 1329 | 114 | yes | bend |
| 1676 | 28 | yes (very slight) | bend |
| 1676 | 28 | yes (very slight) | bend |
| 2472 | 67 | yes | stretch(symmetric) |
| 2532 | 231 | yes | Stretch (antisymmetric) |
| 2532 | 231 | yes | Stretch (antisymmetric) |
| 3464 | 3 | yes (very slight) | Stretch (symmetric) |
| 3581 | 27 | yes (very slight) | stretch (antisymmetric) |
| 3581 | 27 | yes (very slight) | stretch (antisymmetric) |
IR Spectrum
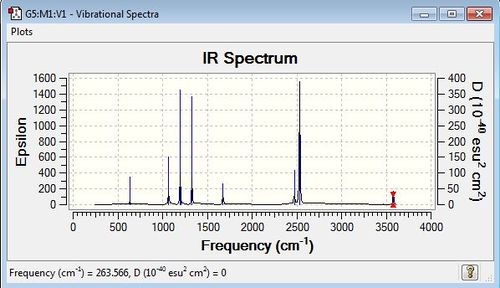
Ammonia borane's bond strength lies at a value between that of borane for a given stretch, indicating the bond strength for N-C is somewhere in between that for N-H (strongest bond) and B-H( not weak, but relatively weak bond).
Energy Analysis
| Molecule | Energy (kJ/mol) |
|---|---|
| Borane | -69880 |
| Ammonia | -148490 |
| Ammonia Borane | -218510 |
| Dissociation energy | -140 |
As you can see borane prefers to be a lewis acid-base adduct (as the dissociation energy is negative) to relieve its electron deficiency.
MO Analysis
MO analysis file here
NBO Analysis
Mini Project Section:Ionic Liquids
Ionic liquids are electrolytes that are made of predominantly ions. The effects of changing the central element of a simple tetrahedral ion is studied in part one of the project whilst the effects of functional groups are investigating in part two of the project.
| [N(Me)4]+ | [P(Me)4]+ | [S(Me)4]+ | |
|---|---|---|---|
| r(E-Me)(Å) | 1.51 | 1.82 | 1.82 |
| r(C-H)(Å) | 1.09 | 1.09 | 1.09 |
| θ(Me-E-Me)(°) | 109.5 | 109.5 | 109.4 |
| θ(H-C-H)(°) | 110.0 | 109.0 | 102.7 |
As you exchange the central element for an element with a greater van der waals radii, the C-H bond length is unaffected by varying the central element, but the H-C-H angle is varied and so is the E-Me bond.
[N(Me)4]+
B3LYP/6-31G(d,p)level
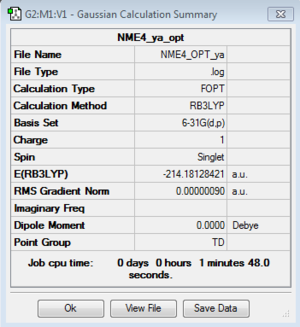
Optimisation File: DOI:10042/150669
| summary data | convergence | Jmol | |||
|---|---|---|---|---|---|
|
Item Value Threshold Converged? Maximum Force 0.000003 0.000015 YES RMS Force 0.000001 0.000010 YES Maximum Displacement 0.000013 0.000060 YES RMS Displacement 0.000005 0.000040 YES |
|
B3LYP/6-31G(d,p)level
Frequency file: DOI:10042/150650
| summary data | low modes |
|---|---|

|
Low frequencies --- -0.0010 -0.0008 -0.0003 21.5288 21.5288 21.5288 Low frequencies --- 188.5491 292.6545 292.6545 |
B3LYP/6-31G(d,p)level
Vibrational Data
| wavenumber | Intensity | IR active? | type |
| 189 | 0 | no | bend |
| 293 | 0 | no | bend |
| 293 | 0 | no | bend |
| 293 | 0 | no | bend |
| 362 | 0 | no | bend |
| 362 | 0 | no | bend |
| 456 | 0 | no | bend |
| 456 | 0 | no | bend |
| 456 | 0 | no | bend |
| 736 | 0 | no | symmetric stretch |
| 941 | 22 | yes (very slight) | bend |
| 941 | 22 | yes (very slight) | bend |
| 941 | 22 | yes (very slight) | bend |
| 1078 | 0 | no | bend |
| 1078 | 0 | no | bend |
| 1078 | 0 | no | bend |
| 1185 | 0 | no | bend |
| 1185 | 0 | no | bend |
| 1306 | 11 | yes (very slight) | bend |
| 1306 | 11 | yes (very slight) | bend |
| 1306 | 11 | yes (very slight) | bend |
| 1456 | 5 | yes (very slight) | bend |
| 1456 | 5 | yes (very slight) | bend |
| 1456 | 5 | yes (very slight) | bend |
| 1487 | 0 | no | bend |
| 1487 | 0 | no | bend |
| 1487 | 0 | no | bend |
| 1502 | 0 | no | bend |
| 1502 | 0 | no | bend |
| 1512 | 0 | no | bend |
| 1532 | 54 | yes | bend |
| 1532 | 54 | yes | bend |
| 1532 | 54 | yes | bend |
| 3087 | 1 | yes (very slight) | stretch (antisymmetric) |
| 3087 | 1 | yes (very slight) | stretch (antisymmetric) |
| 3096 | 0 | no | symmetrical stretch |
| 3189 | 0 | no | symmetrical stretch |
| 3189 | 0 | no | symmetrical stretch |
| 3189 | 0 | no | symmetrical stretch |
| 3190 | 0 | no | symmetrical stretch |
| 3195 | 1 | yes (very very slight) | symmetrical stretch |
| 3195 | 1 | yes (very very slight) | symmetrical stretch |
| 3195 | 1 | yes (very very slight) | symmetrical stretch |
IR spectrum
MO Analysis
B3LYP/6-31G(d,p)level
| Orbitals | Comments | |
|---|---|---|
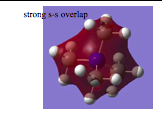 |
This is completely bonding.
The molecular orbital is completely delocalised. There are no nodes. The interactions are very strong, as there are no nodes and great overlap. Concave shape is due to the high electronegativity of the central element (nitrogen), it pulls the electron density more into itself, and hence the orbital is more concave and less delocalised. Orbitals contributing to bonding are (s-orbitals). || | |
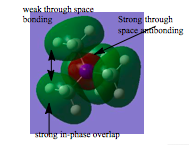
 |
There is strong s-p overlap but not as strong as s-s overlap.
There is 1 internuclear plane at the nitrogen atom. This orbital is less delocalised due to less overlap between the orbitals, relative to the most bonding orbital above and hence it is less bonding. Contribution from s (hydrogen, carbon) and p-orbital (from nitrogen) to bonding and hence the internuclear plane is at the nitrogen centre. | |
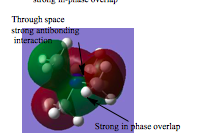
 |
There are 4 internuclear planes at every carbon atom. This orbital is less delocalised due to less overlap between the orbitals, relative to orbital's 1 and 2 and hence it is less bonding. However there is strong overlap in the green region. Contribution from s (hydrogen, nitrogen) and p orbital (carbon) and hence the internuclear node is at the carbon atom. | |
 |
There are 4 internuclear nodes at every carbon atom and 1 internuclear node at the nitrogen atom; hence the use of p-orbitals from nitrogen and carbon to bonding. This orbital is less delocalised due to less overlap between the orbitals, relative to orbital's 1 and 2 and hence it is less bonding.
However there is strong overlap in the green and red regions. | |
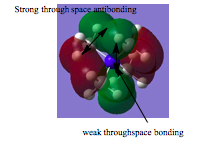 |
-There are 4 interuclear planes at the carbon atoms and 4 nodal palnes along all all the C-N bonds indicating contributions from the p-orbitals of carbon to bonding. Due to the addition of more nodes (nodal planes), this MO is the least bonding cmpared to the orbitals above. However, nodal planes contribute less to the antibonding nature of the MO. The level of bonding is less here as the bonding is mainly from p-p overlap, there is less s- contribution, therefore not as strong bonding as in the MO's above.This orbital is less delocalised due to less overlap between the orbitals, relative to orbital's 1,2,3 and 4 and hence it is less bonding. |
[P(Me)4]+
B3LYP/6-31G(d,p)level
Optimisation
| summary data | convergence | Jmol | |||
|---|---|---|---|---|---|
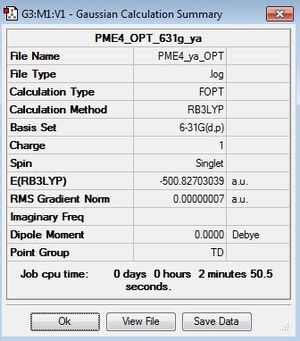
|
Item Value Threshold Converged? Maximum Force 0.000000 0.000015 YES RMS Force 0.000000 0.000010 YES Maximum Displacement 0.000001 0.000060 YES RMS Displacement 0.000000 0.000040 YES |
|
B3LYP/6-31G(d,p)level
Frequency file: DOI:10042/158524
| summary data | low modes |
|---|---|
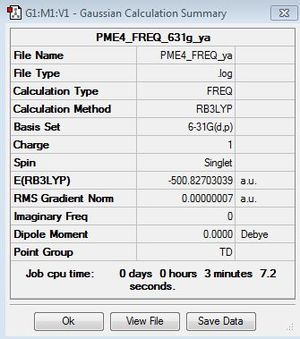
|
Low frequencies --- -0.0034 -0.0023 0.0006 24.7112 24.7112 24.7112 Low frequencies --- 160.0408 194.7804 194.7804 |
IR Analysis
Vibrational data
| wavenumber | Intensity | IR active? | type |
| 160 | 0 | no | bend |
| 195 | 0 | no | bend |
| 195 | 0 | no | bend |
| 195 | 0 | no | bend |
| 223 | 0 | no | bend |
| 223 | 0 | no | bend |
| 271 | 2 | yes (very very slight) | bend |
| 271 | 2 | yes (very very slight) | bend |
| 271 | 2 | yes (very very slight) | bend |
| 615 | 0 | no | symmetrical stretch |
| 756 | 4 | yes (very very slight) | bend |
| 756 | 4 | yes (very very slight) | bend |
| 756 | 4 | yes (very very slight) | bend |
| 824 | 0 | no | bend |
| 824 | 0 | no | bend |
| 824 | 0 | no | bend |
| 973 | 0 | no | bend |
| 973 | 0 | no | bend |
| 1013 | 78 | yes | bend |
| 1013 | 78 | yes | bend |
| 1013 | 78 | yes | bend |
| 1362 | 21 | yes | bend |
| 1362 | 21 | yes | bend |
| 1362 | 21 | yes | bend |
| 1389 | 0 | no | bend |
| 1454 | 0 | no | bend |
| 1454 | 0 | no | bend |
| 1454 | 0 | no | bend |
| 1462 | 0 | no | bend |
| 1462 | 0 | no | bend |
| 1481 | 26 | yes | bend |
| 1481 | 26 | yes | bend |
| 1481 | 26 | yes | bend |
| 3064 | 5 | yes (very very slight) | asymmetric stretch |
| 3064 | 5 | yes (very very slight) | asymmetric stretch |
| 3064 | 5 | yes (very very slight) | asymmetric stretch |
| 3066 | 0 | no | symmetric stretch |
| 3157 | 0 | no | symmetric stretch |
| 3157 | 0 | no | symmetric stretch |
| 3158 | 0 | no | symmetric stretch |
| 3158 | 0 | no | symmetric stretch |
| 3160 | 4 | yes (very slight) | symmetric stretch |
| 3160 | 4 | yes (very slight) | symmetric stretch |
| 3160 | 4 | yes (very very slight) | symmetric stretch |
[S(Me)3]+
B3LYP/6-31G(d,p)level
Optimisation file: here
| summary data | convergence | Jmol | |||
|---|---|---|---|---|---|
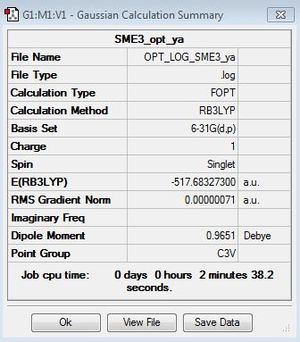
|
Item Value Threshold Converged? Maximum Force 0.000001 0.000015 YES RMS Force 0.000001 0.000010 YES Maximum Displacement 0.000050 0.000060 YES RMS Displacement 0.000016 0.000040 YES |
|
B3LYP/6-31G(d,p)level
Frequency file: here
| summary data | low modes |
|---|---|
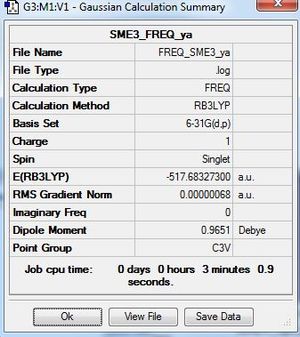
|
Low frequencies --- -7.9669 -7.8283 -7.8250 -0.0027 -0.0021 0.0085 Low frequencies --- 161.8613 199.5996 199.5996 |
Vibrational Data
| wavenumber | Intensity | IR active? | type |
| 162 | 0 | no | bend |
| 200 | 0 | no | bend |
| 200 | 0 | no | bend |
| 255 | 0 | no | bend |
| 255 | 0 | no | bend |
| 285 | 0 | no | bend |
| 624 | 2 | yes (very very slight) | symmetrical stretch |
| 704 | 1 | yes (very very slight) | asymmetrical stretch |
| 704 | 1 | yes (very very slight) | asymmetrical stretch |
| 918 | 0 | no | bend |
| 958 | 1 | yes (very very slight) | bend |
| 958 | 1 | yes (very very slight) | bend |
| 1071 | 11 | yes | bend |
| 1071 | 11 | yes | bend |
| 1076 | 12 | yes | bend |
| 1371 | 0 | no | bend (umbrella motion of 2 methyl group) |
| 1371 | 0 | no | bend (umbrella motion of 2 methyl group) |
| 1408 | 2 | yes (very very slight) | bend (umbrella motion of all methyl group) |
| 1452 | 0 | no | bend (scissoring) |
| 1464 | 10 | yes | bend (scissoring of Me groups) |
| 1464 | 10 | yes | bend (scissoring of Me groups) |
| 1473 | 25 | yes | bend (scissoring of Me groups) |
| 1473 | 25 | yes | bend (scissoring of Me groups) |
| 1485 | 42 | yes | bend (scissoring of Me groups) |
| 3074 | 0 | no | symmetrical stretch |
| 3075 | 3 | yes (very very slight) | asymmetrical stretch |
| 3075 | 3 | yes (very very slight) | asymmetrical stretch |
| 3184 | 0 | no | symmetrical stretch |
| 3185 | 8 | yes | symmetrical stretch |
| 3185 | 8 | yes | symmetrical stretch |
| 3187 | 3 | yes (very very slight) | symmetrical stretch |
| 3187 | 2 | yes (very very slight) | asymmetrical stretch |
| 3187 | 2 | yes (very very slight) | asymmetrical stretch |
IR Spectrum
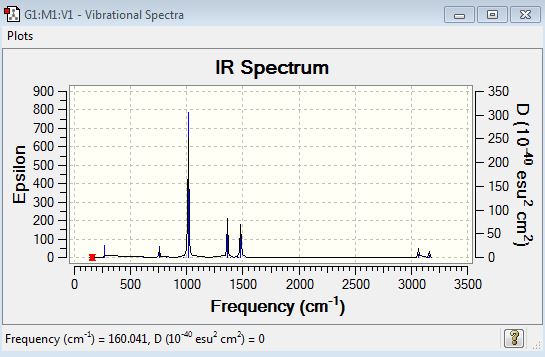
IR spectrum comparison
It is interesting to note that the symmetric stretches increase in frequency on varying the central element from N to P and then to S.
MO Analysis
NBO Analysis
| [N(Me)4]+ | [P(Me)4]+ | [S(Me)3]+ | ||
|---|---|---|---|---|
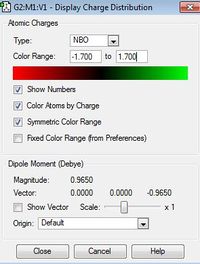
| Charge Distribution range | 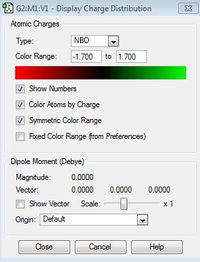 |
 |
| |
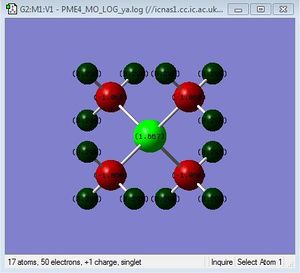
| Charge distribution of atoms in molecule | 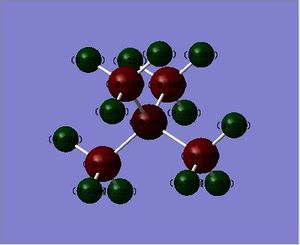 |
 |
|
| Atom | [N(Me)4]+ | [P(Me)4]+ | [S(Me)3]+ |
|---|---|---|---|
| C | -0.483 | -1.05 | -0.845 |
| H | 0.269 | 1.667 | 0.297 |
| X | -0.295 | 0.298 | 0.917 |
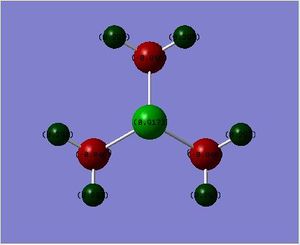
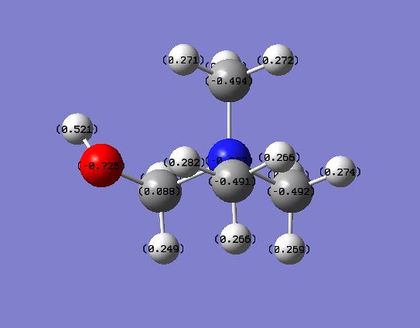
The charge disitribution is such that carbon has the most electron density, this can be rationalised by considering the electronegativity of the heteroatoms relative to carbon and the relative contribution of the heteroatoms and the carbon atom to the C-X bond (see Table 25 below). Electronegativity for the different heteroatoms are as follows Nitrogen > Carbon > Sulphur > Phosphorous. For [S(Me)3]+ and [P(Me)4]+ carbon has the most electron density as it is the most electronegative atom in the C-X bond, however with C-N in [N(Me)4]+ the charge distribution goes against what would be expected, carbon is more electron rich relative to nitrogen, even though nitrogen is more electronegative than carbon. This may be rationalised by taking into consideration the presence of the other 3 hydrogen atoms that are bonded to each carbon atom; as carbon is more electronegative than hydrogen, more of the electron density in the bond is pulled towards the carbon atom.
| [N(Me)4]+ | [P(Me)4]+ | [S(Me)3]+ | |
|---|---|---|---|
| Contribution from Carbon (%) | 34 | 60 | 49 |
| Contribution from Heteroatom (%) | 66 | 40 | 51 |
Contribution from heteroatom to the C-X bond reflects the electronegativity of the heteroatom; therefore it is reasonable to expect Nitrogen to contribute the most to the C-X bond relative to carbon as Nitrogen is more electronegative than carbon. Phosphorous contributes the least to C-X bond as it is less electronegative than carbon (therefore it will have the lowest percentage of contribution to the C-X bond). Relating this to the charge distribution above, it is reasonable for the nitrogen atom to have the most partial negative charge, however it is the carbon atom that has the most partially negative charge in this case. This may be rationalised by taking into consideration the presence of the other 3 hydrogen atoms that are bonded to each carbon atom (as explained above) For [P(Me)4]+ and [S(Me)4]+ the heteroatoms are pictured relatively positive when compared to the carbon atom, which is explained by the relatively high contribution of the carbon atom to the C-X bond, phosphorous is pictured as being the most partially positive when compared to the other heteroatoms, this is again to be expected as it contributes least (out of all the heteroatoms) to the C-X bond as it has the lowest electronegativity relative to carbon.
The formal positive charge on the Nitrogen atom in the traditional picture represents the donation of the lone pair on the nitrogen atom to another atom, this may be rationalised by looking at the relative contribution of the nitrogen atom to the C-N bond in [N(Me)4]+, it is higher than the contribution of carbon. However, it is the hydrogen atoms that are depicted as having the positive charge distribution not the nitrogen atom, this is due to the fact that electron density in the C-H bond is being pulled by the relatively more electronegative carbon atom, which in turn has its bonding electrons in the C-N being pulled by the more electronegative nitrogen atom, this leaves the hydrogen atoms with a partially positive charge. So, the positive charge in the traditional picture of [N(Me)4]+ is incorrectly placed on the nitrogen atom, it is actually distributed evenly on all the hydrogen atoms bonded to the carbons.
Part 2: Influence of functional groups
[N(Me)3(CH2OH)]+
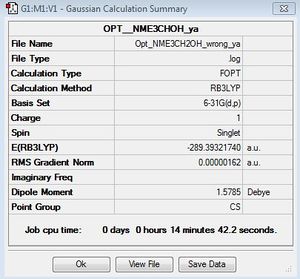
First Optimisation File: DOI:10042/155619
| summary data | convergence | Jmol | |||
|---|---|---|---|---|---|
|
         Item               Value     Threshold  Converged?
 Maximum Force            0.000004     0.000015     YES
 RMS     Force            0.000001     0.000010     YES
 Maximum Displacement     0.000016     0.000060     YES
 RMS     Displacement     0.000006     0.000040     YES
|
|
B3LYP/6-31G(d,p)level
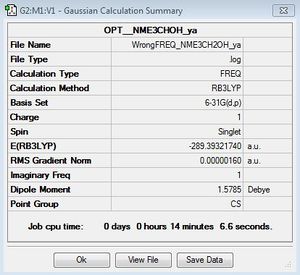
First Frequency file here: DOI:10042/155666
| summary data | low modes |
|---|---|
|
Low frequencies --- -118.6600 -7.0614 -6.6479 -4.9394 -0.0009 -0.0007 Low frequencies --- -0.0006 129.5425 217.2746 |
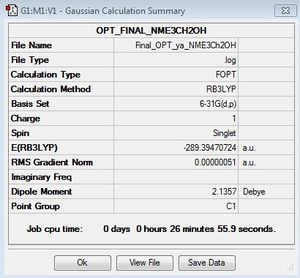
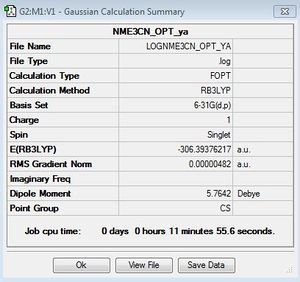
As you can see this frequency analysis shows the molecule has not been optimised correctly, when viewing the vibration at -118.66cm-1, it is found that this is due to an O-H bend, therefore this molecule is optimised under a lower symmetry (C1) with a torsion angle of 103degrees (N-C-O-H) to allow rotation of the O-H group. the nitrogen atom was fixed whilst the hydrogen atom was allowed to rotate, to remove Cs symmetry. The values for optimisation converge and the frequencies are indeed 'low' (see second Frequency analysis below.
B3LYP/6-31G(d,p)level
Second Optimisation file here: DOI:10042/155660
| summary data | convergence | Jmol | |||
|---|---|---|---|---|---|
|
Item Value Threshold Converged? Maximum Force 0.000001 0.000015 YES RMS Force 0.000000 0.000010 YES Maximum Displacement 0.000018 0.000060 YES RMS Displacement 0.000005 0.000040 YES |
|
B3LYP/6-31G(d,p)level
Second Frequency file here: DOI:10042/155653
| summary data | low modes |
|---|---|
|
Low frequencies --- -8.4224 -5.0464 -1.1177 -0.0009 -0.0007 0.0001 Low frequencies --- 131.1070 213.4641 255.7147 |
MO Analysis
[N(CH3)3(CH2CN)]+
B3LYP/6-31G(d,p)level
Optimisation file: DOI:10042/155622
| summary data | convergence | Jmol | |||
|---|---|---|---|---|---|
|
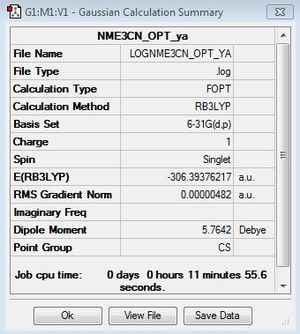
Item Value Threshold Converged? Maximum Force 0.000009 0.000015 YES RMS Force 0.000003 0.000010 YES Maximum Displacement 0.000052 0.000060 YES RMS Displacement 0.000015 0.000040 YES |
|
[N(CH3)3(CH2CN)]+
B3LYP/6-31G(d,p)level
Frequency file here: DOI:10042/161044
| summary data | low modes |
|---|---|
|
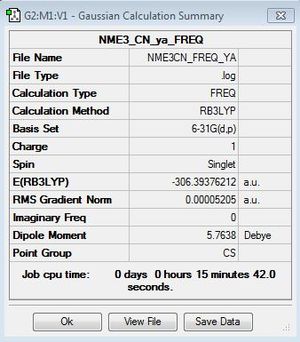
Low frequencies --- -3.4465 0.0004 0.0006 0.0012 4.3536 5.5939 Low frequencies --- 92.1416 154.3246 212.1231 |
MO Analysis
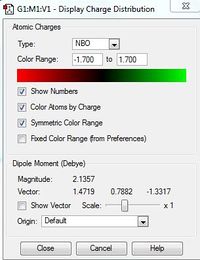
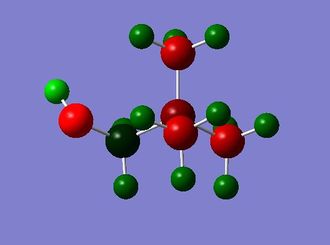
NBO Analysis
| [N(Me)CH2OH]+ | [N(Me)3CN]+ | |
|---|---|---|
| Charge Distribution range | 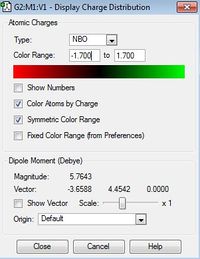 |
|
| Relative charge of atoms by colour | 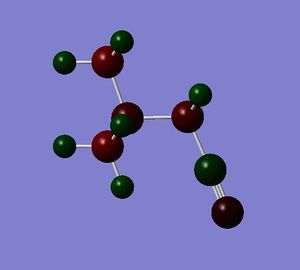 |
|
| Charge distribution on atoms | 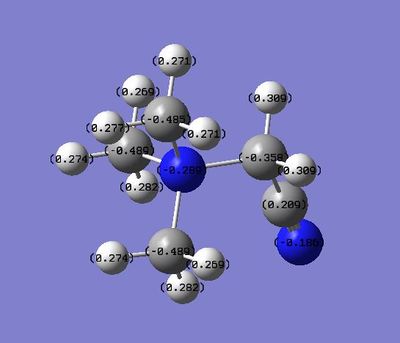 |
|
HOMO/LUMO
| [N(Me)4]+ | [N(CH3)3(CH2OH)]+ | [N(CH3)3(CH2CN)]+ | |
|---|---|---|---|
| HOMO |  |
 |
|
| LUMO | 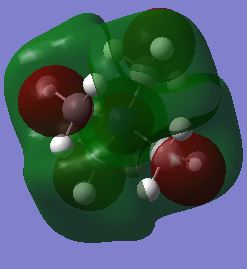 |
 |

|
Energies
| Molecule | HOMO (A.U.) | LUMO (A.U.) | Energy Gap (A.U.) |
|---|---|---|---|
| [N(CH3)4]+ | -0.57934 | -0.13306 | 0.44628 |
| [N(CH3)3(CH2OH)]+ | -0.48763 | -0.12459 | 0.36304 |
| [N(CH3)3(CH2CN)]+ | -0.50047 | -0.18182 | 0.31865 |
Q OH is an electron donating group and CN is an electron withdrawing group, what effect have these groups had on the charge distribution? As you can see above the electron withdrawing (-CN) has caused the carbon adjacent to this functional group to be relatively positive. Whereas the carbon adjacent to the electron donating (-OH) group is relatively less positive (it is not relatively negative because the molecule is still positively charged and although (-OH) is electron donating through resonance, it is electron withdrawing through inductive effects.
The functional group (-OH) is considered to be electron donating by resonance, but electron withdrawing by inductive effects.
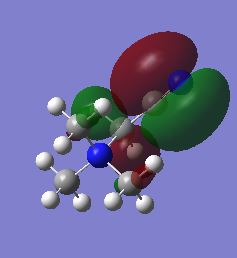
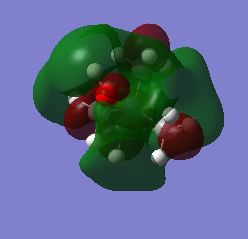
Q Compare and contrast the HOMO and LUMO of[N(CH3)4]+ [N(CH3)3(CH2OH)]+ and [N(CH3)3(CH2CN)]+ has the energy of these orbitals moved? The energy gap between the HOMO and LUMO orbitals (the frontier orbitals) indicates how stable a molecule is; the greater the energy gap between these orbitals, the more energy required to excite a molecule from the ground to excited state i.e. the more stable the molecule is. It can be seen that [N(CH3)4]+ has the highest energy gap, and therefore is the most stable. The presence of electron withdrawing groups (-CN) and (-OH) explains the relative stability (and hence the energy gap of [N(CH3)3(CH2OH)]+ and [N(CH3)3(CH2CN)]+ ), as (-CN) is the most electron withdrawing group it destabilises the positively charged [N(CH3)3(CH2CN)]+ the most, relative to the other two molecules and hence it has the lowest energy HOMO-LUMO gap and is the most reactive of all the other molecules, (-OH) is not as electronwithdrawing as (-CN) hence [N(CH3)3(CH2OH)]+ has a higher energy gap than [N(CH3)3(CH2CN)]+ but a smaller energy gap than [N(CH3)4]+. This can than explain the HOMO's and LUMO's of the molecules, The HOMO of [N(CH3)4]+ is the most stable relative to the other HOMO's (as it has one less node than the other two molecules).
Q how has the shape of the orbitals changed? It can be seen that the HOMO of [NME4]+, is the most stable (it has the most bonding interactions and has 4 internuclear nodes at carbon and 1 internuclear node at Nitrogen). The HOMO's of of [NME3CH2OH]+ and [NME3CN]+ have relatively less bonding character than [NME4]+ The HOMO of [NME3CN]+ has 5 internuclear nodes and 1 nodal plane through the (C-CN). [NME3CH2OH]+ doesn't have as many bonding interactions as [NME4]+ molecule and has 6 internuclear planes as well as one nodal plane through the H-C-O-H. This explains why the HOMO of [NME3CH2OH]+ is the highest in energy (as it has the most nodes). The LUMO of [NME4]+ is the most bonding as it has the strongest overlap; hence it is the most delocalised and is the most stable relative to the other LUMO's of the other molecules. The shapes of the HOMO's and the LUMO's reflects the electron withdrawing nature of the functional groups, i.e (-CN) is the most electron withdrawing; therefore the shapes of its HOMO are the most distorted and [NME4]+ is the most symmetrical. As the functional group becomes more and more electron withdrawing the LUMO is lowered in energy, (thus decreasing the energy gap between the HOMO and LUMO) making it easier to accept electrons as the molecule desperately wants to relieve its electron deficiency.
Q What chemical impact could these changes have? The lower the energy gap between the HOMO and LUMO the more reactive the molecule is; therefore [NME3CH2CN]+ is the most reactive as it has the lowest energy gap.
Conclusion
The use of a higher basis set results in a more accurate calculation of the energy and vibrational frequencies of a molecule.The use of a larger ligand (large van der vaals radius) results in an increase in bond length, if the elements are on different rows there is weaker bonding (as you go down the group, there is weaker bonding due to the inert pair effect i.e. the orbitals are more diffuse lower in the group and have weaker overlap with orbitals of elements further up the periodic table). Although qualitative MO theory is not tremendously accurate when predicting the real MO's it is still useful in giving an indication to what the real MO looks like. The use of more electronegative elements makes the MO's for a molecule concave in shape due to the pulling of electron density towards the electronegative central element. A lewis acid-base adduct for Ammonia borane is favoured to relieve the electron deficiency of borane. The formal positive charge on [NR3]+ is more accurately depicted on the partially positive hydrogen atoms on the R groups. The presence of an electron withdrawing functional group destabilises the HOMO MO for [NR2X]+ (where X = CH2OH, or CN) and stabilises its LUMO, thus lowering its energy gap, making the molecule more reactive and a better acceptor in order to accept electrons from a donor to relieve so it can electron deficiency. If time allowed it would've been interesting to see the effects of more electron donating groups (such as -OMe) to see if this does indeed increase the energy gap between the HOMO and LUMO of the molecul and hence lower its reactivity.
References
[1] http://staff.ustc.edu.cn/~luo971/2010-91-CRC-BDEs-Tables.pdf
[2] http://www.huntresearchgroup.org.uk/teaching/year2_mos.html#lecture4
[3] http://www.wiredchemist.com/chemistry/data/bond-energies-lengths

