Rep:Mod:yuqi1993
Week 1: Compulsory Section
Day 1- Day2
Analysing the optimised BH3 molecule with basis set: 3-21G
A BH3 was build up in the GaussView. The bond lengths of three B-Hs were set up as 1.53Å, 1.54Å and 1.55Å respectively. The molecule was geometry optimised by Gaussian. with: the method: B3LYP, the basis set: 3-21G;type of calculation : OPT.
Details about the Optimization:

ah_test |
The out-put log file:BBH3 321 Data of forces and displacements:
        Item               Value     Threshold  Converged?
Maximum Force            0.000220     0.000450     YES
RMS     Force            0.000106     0.000300     YES
Maximum Displacement     0.000940     0.001800     YES
RMS     Displacement     0.000447     0.001200     YES
Predicted change in Energy=-1.672527D-07
Optimization completed.
   -- Stationary point found.
                          ----------------------------
                          !   Optimized Parameters   !
                          ! (Angstroms and Degrees)  !
--------------------------                            --------------------------
! Name  Definition              Value          Derivative Info.                !
--------------------------------------------------------------------------------
! R1    R(1,2)                  1.1944         -DE/DX =   -0.0001              !
! R2    R(1,3)                  1.1947         -DE/DX =   -0.0002              !
! R3    R(1,4)                  1.1948         -DE/DX =   -0.0002              !
! A1    A(2,1,3)              119.9983         -DE/DX =    0.0                 !
! A2    A(2,1,4)              119.986          -DE/DX =    0.0                 !
! A3    A(3,1,4)              120.0157         -DE/DX =    0.0                 !
! D1    D(2,1,4,3)            180.0            -DE/DX =    0.0                 !
--------------------------------------------------------------------------------
GradGradGradGradGradGradGradGradGradGradGradGradGradGradGradGradGradGrad
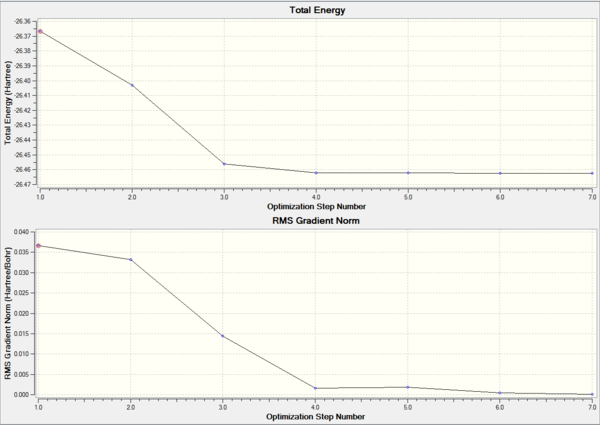
The first graph shows the energy for each state of optimisation process and the second graph shows the gradient of energy at each state of optimization. The second graph illustrates that the gradient trend to be zero at the end of optimization.This means that the molecule are in the equilibrium position.The details about optimization( image above) also proves that the value of gradient( 0.00008851 au ) is close to zero. As a result,The calculation was accomplished.
BH3 Bond length and Bond angle
| BH3 | ||
| Database | Bond length(Å) | Bond Angle(°) |
| 3-21G | 1.19 | 120.0 |
| 1.19 | 120.0 | |
| 1.19 | 120.0 | |
| Average | 1.19 | 120.0 |
From the table above, it shows that the values of three bond lengths are same up to 2 decimal place and the bond angles are 120Å. The result shows agreement with the theoretical expectation of trigonal planar molecular geometry. However, the point group of the optimized BH3 molecule is not D3h since we did not restrict point group in the calculation.
Optimized BH3 with better basis set
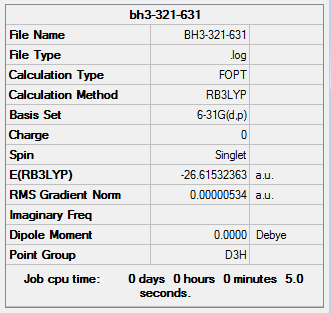
The optimized BH3 molecule (basis set: 3-21G) is then optimized again with same method but a better basis set (6-31G)
The details of optimization:
ah_test |
The out-put log file:BBH3 631
Data of forces and displacements:
        Item               Value     Threshold  Converged?
Maximum Force            0.000011     0.000450     YES
RMS     Force            0.000007     0.000300     YES
Maximum Displacement     0.000042     0.001800     YES
RMS     Displacement     0.000028     0.001200     YES
Predicted change in Energy=-6.781019D-10
Optimization completed.
   -- Stationary point found.
                          ----------------------------
                          !   Optimized Parameters   !
                          ! (Angstroms and Degrees)  !
--------------------------                            --------------------------
! Name  Definition              Value          Derivative Info.                !
--------------------------------------------------------------------------------
! R1    R(1,2)                  1.1923         -DE/DX =    0.0                 !
! R2    R(1,3)                  1.1923         -DE/DX =    0.0                 !
! R3    R(1,4)                  1.1923         -DE/DX =    0.0                 !
! A1    A(2,1,3)              120.0            -DE/DX =    0.0                 !
! A2    A(2,1,4)              120.0            -DE/DX =    0.0                 !
! A3    A(3,1,4)              120.0            -DE/DX =    0.0                 !
! D1    D(2,1,4,3)            180.0            -DE/DX =    0.0                 !
--------------------------------------------------------------------------------
GradGradGradGradGradGradGradGradGradGradGradGradGradGradGradGradGradGrad
BH3 Bond length and angle
| Database | Bond length(Å) | Angle(°) |
| 6-31G | 1.19 | 120.0 |
| 1.19 | 120.0 | |
| 1.19 | 120.0 | |
| Average | 1.19 | 120.0 |
| Literature[1] | 1.19 | 120 |
The above result shows agreement with literature values, which means that using basic data 6-31G also provides a reasonable structure of BH3.
Using pseudo-potentials and larger basis sets
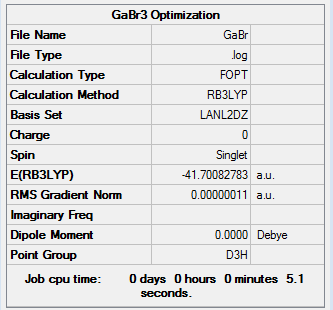
Pseudo-potentials and larger basis sets are used to study the property of heavy atom in trigonal planar structure. GaBr3 was build up in Gaussview and the symmetry was restricted to D3h point group, following by calculation through HPC system.
ah_test |
GaBr3: DOI:10042/26097
        Item               Value     Threshold  Converged?
Maximum Force            0.000000     0.000450     YES
RMS     Force            0.000000     0.000300     YES
Maximum Displacement     0.000002     0.001800     YES
RMS     Displacement     0.000001     0.001200     YES
Predicted change in Energy=-5.834384D-13
Optimization completed.
   -- Stationary point found.
                          ----------------------------
                          !   Optimized Parameters   !
                          ! (Angstroms and Degrees)  !
--------------------------                            --------------------------
! Name  Definition              Value          Derivative Info.                !
--------------------------------------------------------------------------------
! R1    R(1,4)                  2.3502         -DE/DX =    0.0                 !
! R2    R(2,4)                  2.3502         -DE/DX =    0.0                 !
! R3    R(3,4)                  2.3502         -DE/DX =    0.0                 !
! A1    A(1,4,2)              120.0            -DE/DX =    0.0                 !
! A2    A(1,4,3)              120.0            -DE/DX =    0.0                 !
! A3    A(2,4,3)              120.0            -DE/DX =    0.0                 !
! D1    D(1,4,3,2)            180.0            -DE/DX =    0.0                 !
--------------------------------------------------------------------------------
GradGradGradGradGradGradGradGradGradGradGradGradGradGradGradGradGradGrad
| Database | Bond length(Å) | Angle(°) |
| 3-61G | 2.35 | 120.0 |
| 2.35 | 120.0 | |
| 2.35 | 120.0 | |
| Average | 2.35 | 120.0 |
| Literature[2] | 2.239 | 123.1 |
The table above indicates that the bond length we obtained is about 0.11Å longer than the literature value. The solid crystal was used to determined the bond length in the literature, while in Gaussview the molecule was assumed in gas phase. Hence, the optimization result is reasonable.
Using a mixture of basis-sets and psuedo-potentials
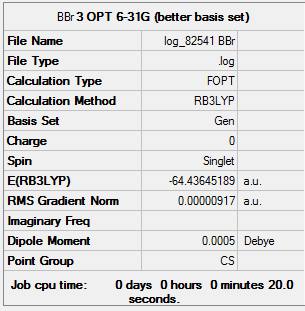
In order to study the structure of molecules which contain both heavy and light atoms, the pseudo-potential and full basis set are required in the calculation. BBr3 is build up in Gaussview and calculated through HPC system. The detail of result is present below.
Details about the Optimization:
ah_test |
BBr3 out put: DOI:10042/26096
       Item               Value     Threshold  Converged?
Maximum Force            0.000020     0.000450     YES
RMS     Force            0.000010     0.000300     YES
Maximum Displacement     0.000112     0.001800     YES
RMS     Displacement     0.000060     0.001200     YES
Predicted change in Energy=-1.914590D-09
Optimization completed.
   -- Stationary point found.
                          ----------------------------
                          !   Optimized Parameters   !
                          ! (Angstroms and Degrees)  !
--------------------------                            --------------------------
! Name  Definition              Value          Derivative Info.                !
--------------------------------------------------------------------------------
! R1    R(1,2)                  1.934          -DE/DX =    0.0                 !
! R2    R(1,3)                  1.9339         -DE/DX =    0.0                 !
! R3    R(1,4)                  1.934          -DE/DX =    0.0                 !
! A1    A(2,1,3)              120.0011         -DE/DX =    0.0                 !
! A2    A(2,1,4)              119.9962         -DE/DX =    0.0                 !
! A3    A(3,1,4)              120.0027         -DE/DX =    0.0                 !
! D1    D(2,1,4,3)            180.0            -DE/DX =    0.0                 !
--------------------------------------------------------------------------------
GradGradGradGradGradGradGradGradGradGradGradGradGradGradGradGradGradGrad
| BBr3 | ||
| Database | Bond length(Å) | Angle(°) |
| 3-61G | 1.94 | 120.0 |
| 1.93 | 120.0 | |
| 1.93 | 120.0 | |
| Average | 1.93 | 120.0 |
| Literature[3] | 1.893 | 120 |
Comparing the result with literature value, the bond length we obtained is slightly longer which is also cause by the measurement with different phase.
Structure Comperison
| Database | BH3 | GaBr3 | BBr3 |
| Average Bond length(Å) | 1.19 | 2.35 | 1.93 |
| Avergar Angle(°) | 120.0 | 120.0 | 120.0 |
The above table shows that the bond length of BH3 is shorter than that of BBr3. This indicates that bromide ligand increase bond length rather than hydride ligand with the same central atom. This is because that bromide has larger radius and is more electronegative than hydride. In addition, the sp2 overlap between Br([Ar]3d104s24p5) and B([1s22p22p1) is poor due to the mismatch of orbital sizes. The comparison is based on that both hydride and bromide are one-eletron donor, forming 2c-2e bonds with boron.
Comparing the bond length of BBr3 and GaBr3. It is clear that the gallium increases the bond length.Since boron and gallium are both in group 13 with 3 valence electrons, gallium has larger atomic radius. In addition, gallium is less electronegativity than boron, leading the Ga-Br more polar than B-Br. Moreover,Ga(4s,4p) has larger and more diffuse orbital than boron (2s,2p).The overlap between Ga([Ar]3d104s24p1) and Br is 4p-4p which is weaker than 2p-4p overlap (B-Br).In conclusion, the bond length GaBr3 is longer than BBr3 due to the larger atomic, polarized bond and poor 4p-4p overlap.
The reason that Gaussview does not draw out the bonds in some structure is because the bond length is not in the pre-defined range.[4] It does not means there is no bond between atoms. As for the definition of a chemical bond, the attraction between atoms allows to form a new chemical molecule.In general, there are three types of chemical bond, covalent bond (share electrons), ionic bond (exchange electrons), metallic bond (attraction in ions and electrons). In this project, we only study the covalent bond.
Day3-4
Frequency analysis for BH3
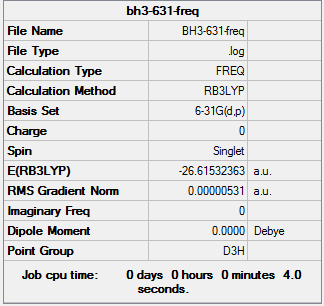
The optimized BH3 molecule is then being frequency analysis. The point group is then restricted to D3h by setting the tolerance to be very tight (0.0001).
out-put log file: BH3 frequencies
       Item               Value     Threshold  Converged?
Maximum Force            0.000002     0.000450     YES
RMS     Force            0.000001     0.000300     YES
Maximum Displacement     0.000006     0.001800     YES
RMS     Displacement     0.000003     0.001200     YES
Predicted change in Energy=-1.939377D-11
Optimization completed.
   -- Stationary point found.
GradGradGradGradGradGradGradGradGradGradGradGradGradGradGradGradGradGrad
Low frequencies ---   -4.9683   -1.2174   -0.0054    0.9957    9.0312    9.1129
Low frequencies --- 1162.9784 1213.1706 1213.1733

Animating the vibrations
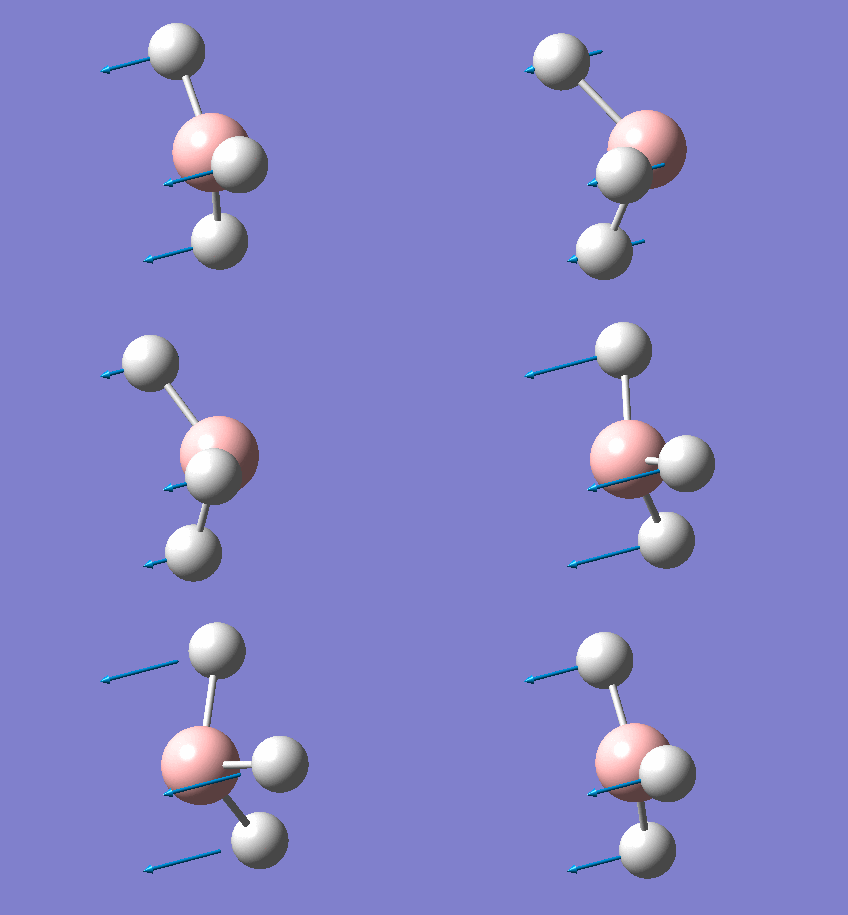
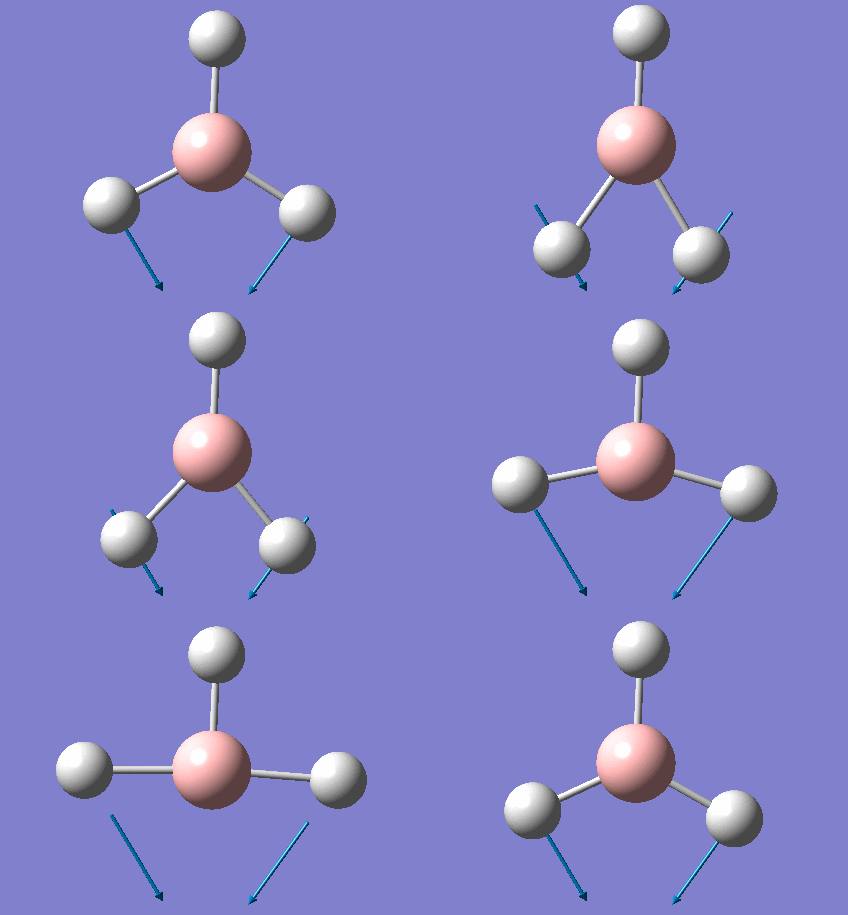
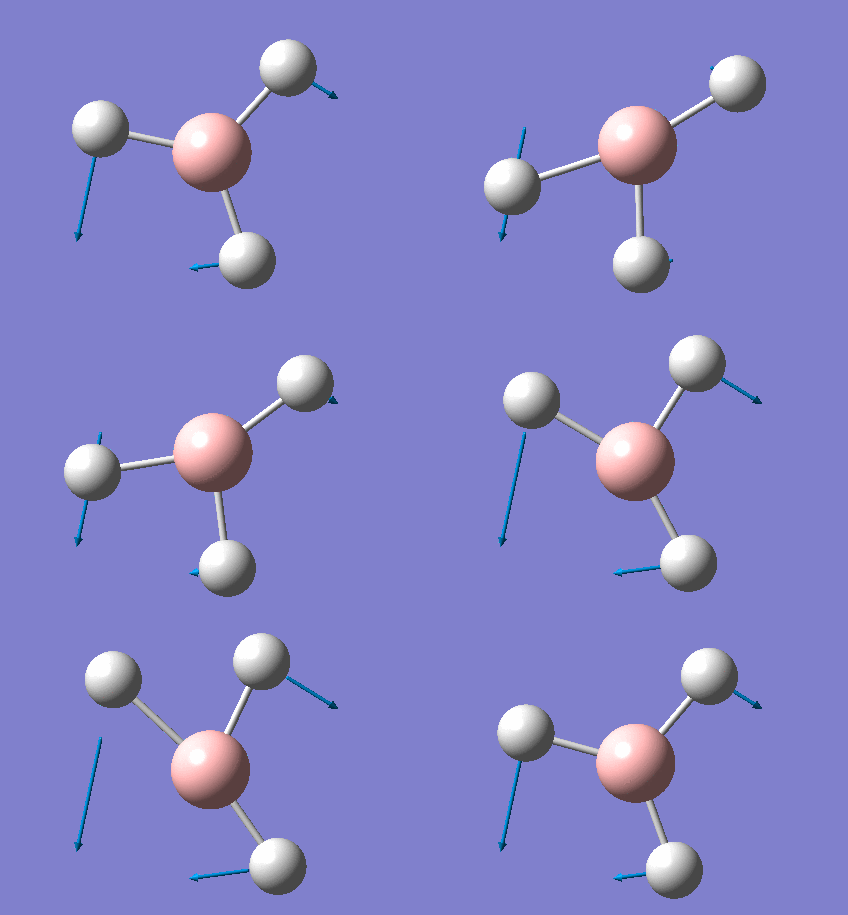
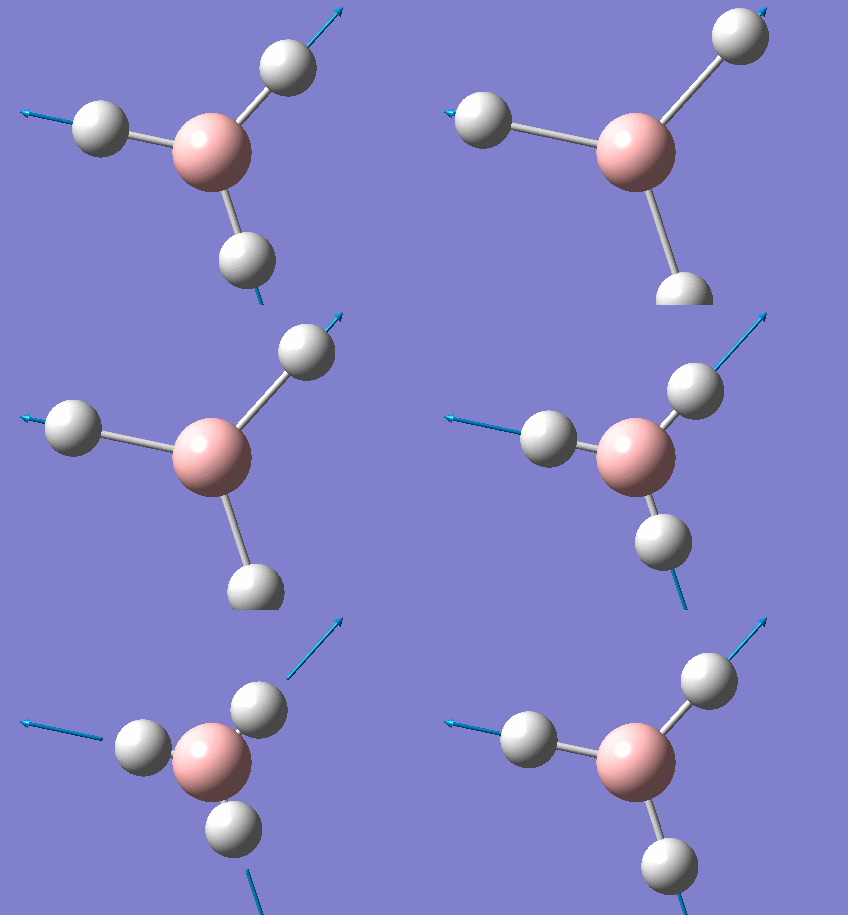
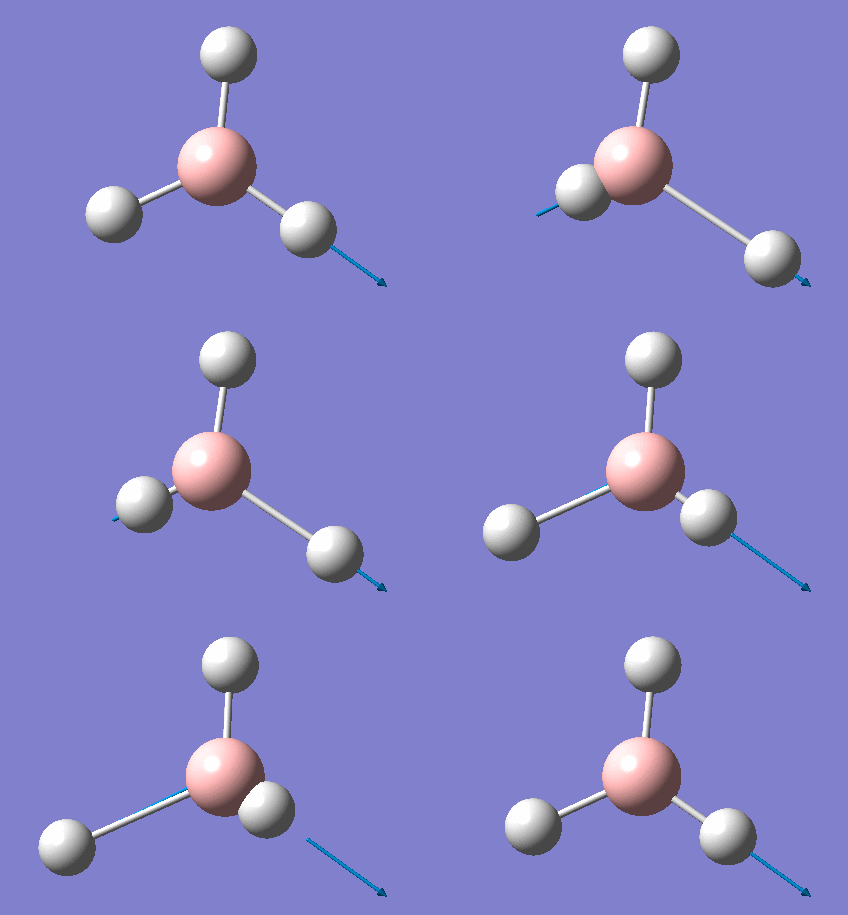
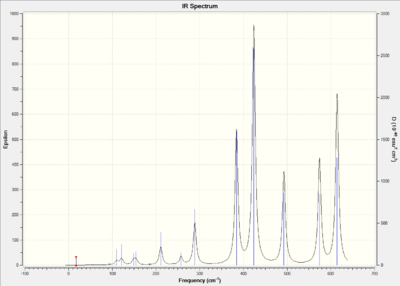
There are six types of vibration of BH3 while there are only three shows on the spectrum. This is because mode 2 and 3 are degenerate so as mode 5 and 6. Hence, there are two peaks (1213 cm-1,2715 cm-1) presented in the IR spectrum. Moreover, the selection rule of IR spectroscopy indicate that only dipole moment equals to non-zero can present peaks. Mode 4 as total symmetric vibration gives a zero value in dipole moment, since all the dipole moments are cancelled with equivalent bond angles of 120°. Hence, there is not peaks for mode 4 in the spectrum.
Frequency Analysis of GaBr3
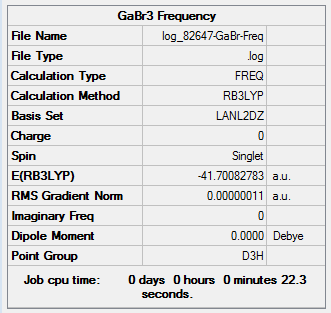
out put:DOI:10042/26140
        Item               Value     Threshold  Converged?
Maximum Force            0.000000     0.000450     YES
RMS     Force            0.000000     0.000300     YES
Maximum Displacement     0.000002     0.001800     YES
RMS     Displacement     0.000001     0.001200     YES
Predicted change in Energy=-6.142796D-13
Optimization completed.
   -- Stationary point found.
Low frequencies ---   -0.5252   -0.5247   -0.0024   -0.0010    0.0235    1.2007
Low frequencies ---   76.3744   76.3753   99.6982
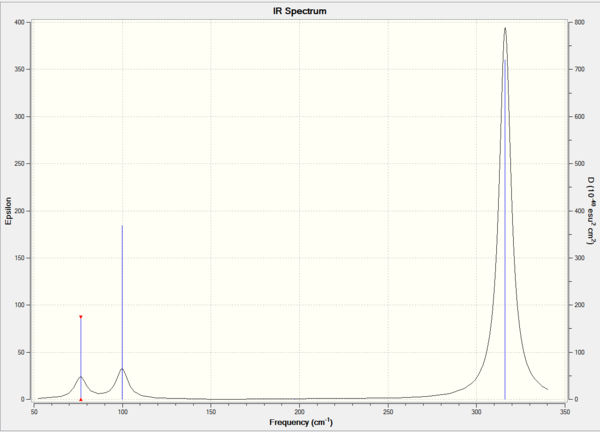
Comparison of BBH3 and GaBr3
| BBH3 | GaBr3 | |||
| Symmetry | Frequency(cm-1) | Intensity | Frequency(cm-1) | Intensity |
| A2" | 1163 | 93 | 100 | 9 |
| E' (degenerate) | 1213 | 14 | 76 | 3 |
| E' (degenerate) | 1213 | 14 | 76 | 3 |
| A1'(totally symmetric) | 2582 | 0 | 197 | 0 |
| E' (degenerate) | 2716 | 126 | 316 | 57 |
| E' (degenerate) | 2716 | 126 | 316 | 57 |
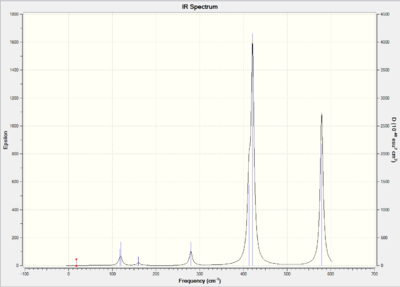
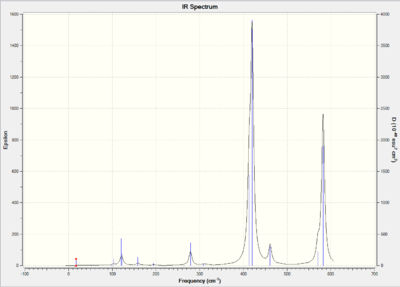
The analysis is consider successfully as the low frequencies of both BH3 and GaBr4 are in the range of 0±15 cm-1. BH3 and GaBr4 have same point group D3h hence they have similar vibrational environments. As a result, the IR spectrum of BH3 and GaBr4 shows similar pattern and three peaks.The above table illustrate that the vibrational frequencies of BBH3 is much higher than GaBr4. This indicate that the force constant of BH3 is larger than GaBr4.Force constant is reversely proportional to the reduced mass. Since GaBr4 has larger reduce mass than BBH3,lower vibrational frequencies of GaBr4 are obtained. In addition, bond length of GaBr4 is longer than BH3 due to the larger atomic radius. Moreover, the overlap between Ga-Br (4p-4p) is much weaker than B-H(2p-1s). As result, Ga-Br vibrates slower than the B-H giving lower vibrational frequencies.
For both IR spectra, the A2 and E' modes lies close together so as the other two modes(the A1' and E'). The frequencies of a1' and e' are much higher than that of a2" and e'. The is because a1" and e' are stretch motion which involves changes in bond length. Hence, a1" and e' lie closely in high energy. On the other hand, a2" and e' are bend motion which involves change in bond angle. As a result, a2" and e' are lie closely in low energy.
The purpose of frequency analysis is to confirm that the molecule is maximum optimized. The method and basis set must be same to ensure the consistency and accuracy. If different methods and basis sets are used, the result of frequency is no significance.For non-linear molecules,the number of vibration modes equals to 3N-6 where N is the total number of atoms and -6 present as low frequencies. Since low frequencies are the motions of the center of mass, it is much lower than real frequencies. The real frequency is the lowest visible peak shown in the IR spectrum. In this case, the real frequency of GaBr3 is 76 cm-1.
Molecular Orbitals of BH3
Out-put:DOI:10042/26142
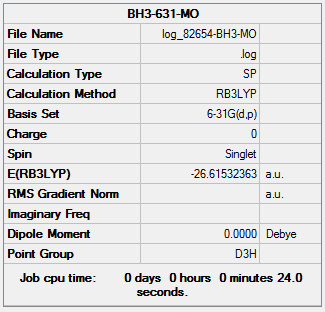
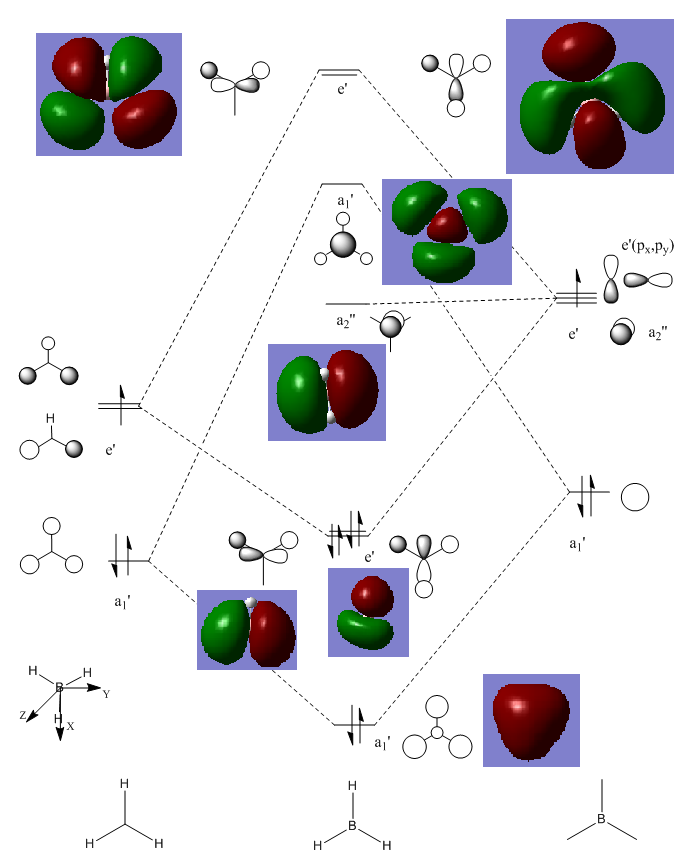
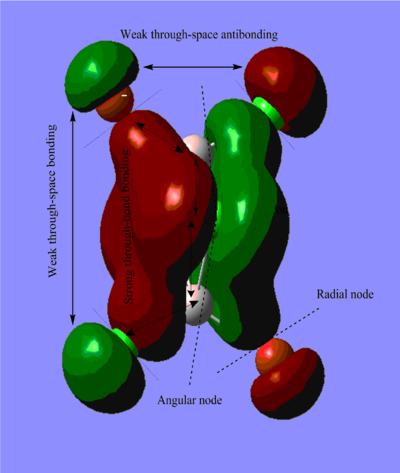
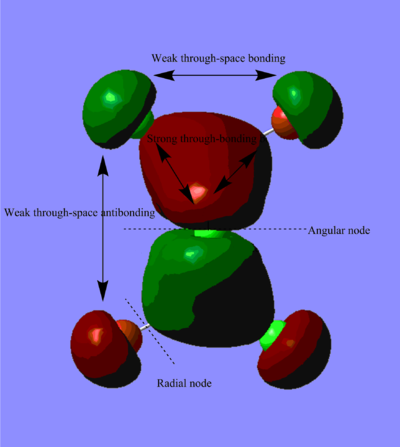
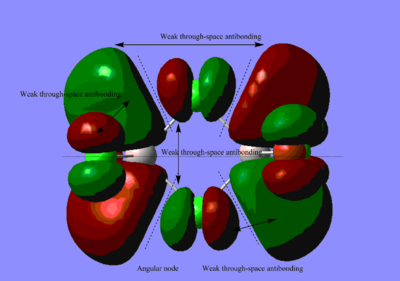
The difference between the LMAO MO and real MOs is significant. Sicne LMAO MOs is the result of combination each atomic orbital directly, neglecting the electron diffusion. LMAO MO shows general orbital combination which is useful to solve problems involve orbital interactions and nodal planes. While real MO show shape and location of the electron density clearly.
NBO Analysis of NH3
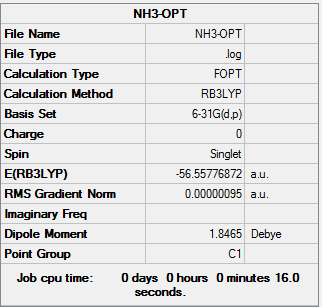
Out-put from Optomization:
        Item               Value     Threshold  Converged?
Maximum Force            0.000002     0.000015     YES
RMS     Force            0.000001     0.000010     YES
Maximum Displacement     0.000005     0.000060     YES
RMS     Displacement     0.000003     0.000040     YES
Predicted change in Energy=-9.677632D-12
Optimization completed.
   -- Stationary point found.
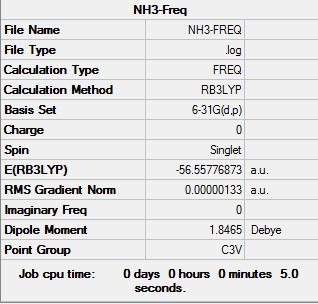
Out-put from Frequencies
        Item               Value     Threshold  Converged?
Maximum Force            0.000002     0.000450     YES
RMS     Force            0.000001     0.000300     YES
Maximum Displacement     0.000006     0.001800     YES
RMS     Displacement     0.000003     0.001200     YES
Predicted change in Energy=-1.939377D-11
Optimization completed.
   -- Stationary point found.
Low frequencies ---   -0.0668   -0.0038    0.0018    1.3611    4.3427    4.3433
Low frequencies --- 1089.3705 1693.9316 1693.9316
 |
 |
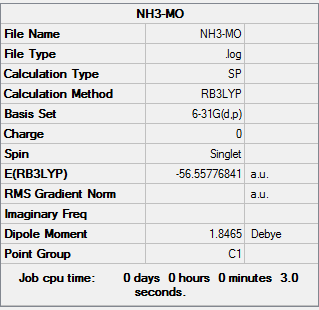 |
| NH3 optimization out put | NH3 Frequencies out put | NH3 MO out put |
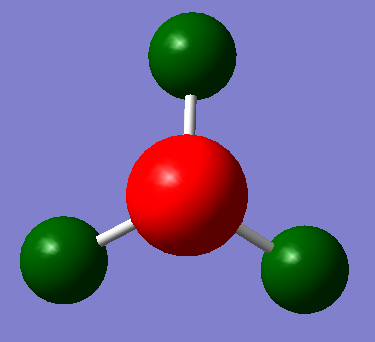
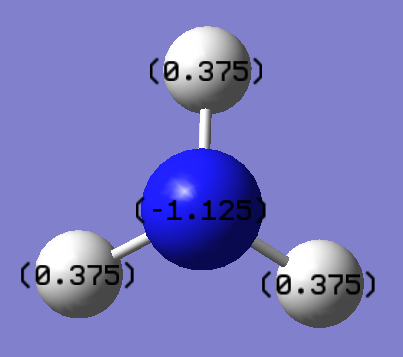
The range of the charge distribution is ±-1.00. The specific NMO charges for nitrogen and hydrogen are -1.125 and 0.375 respectively. It shows that nitrogen is more electronegative than hydrogen. In addition, the sum of charge for all atoms are zero shows that the molecule is neutral. As a result, the NBO analysis is correctly.
Frequency analysis for BH3NH3
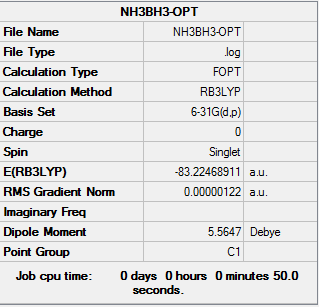
H3NBH3 was build up on Gaussview and optimised with no restriction on symmetry using the same method as NH3 and BH3. The details of analysis is provided below:
Optimization of BH3NH3:
       Item               Value     Threshold  Converged?
Maximum Force            0.000002     0.000015     YES
RMS     Force            0.000001     0.000010     YES
Maximum Displacement     0.000024     0.000060     YES
RMS     Displacement     0.000010     0.000040     YES
Predicted change in Energy=-8.746364D-11
Optimization completed.
   -- Stationary point found.
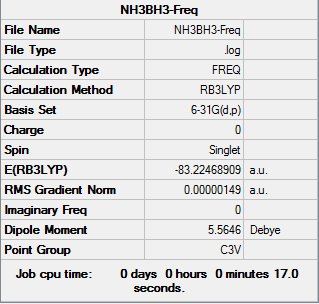
Frequencies of BH3NH3:
Low frequencies ---   -5.4756   -0.3300   -0.0490   -0.0010    1.1058    1.1927
Low frequencies ---  263.2939  632.9625  638.4640
 |
 |
| BH3NH3 Optimization | BH3NH3 Frequencies |
| Energy | |
| NH3BH3 | -83.2247 |
| NH3 | -56.5578 |
| BH3 | -26.6153 |
| Energy Difference (au) | -0.0516 |
| Energy Difference (kJ/mol) | -136 |
From the above table,the association energy of NH3BH3=ΔE(NH3BH3)-[E(NH3)+E(BH3)]
The association energy of NH3BH3 is negative means that H3NBH3 is more stable than the NH3 and BH3.This is because the formation of a new dative covalent bond by the donation of a lone pair from N sp3 orbital to the empty p orbital on BH3. Hence, the total energy of the system is lower.
Mini Project
Optimization
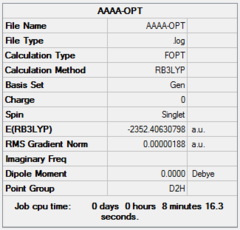
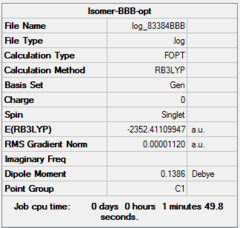
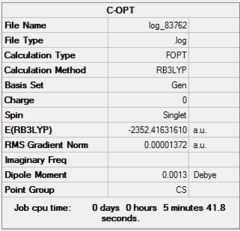
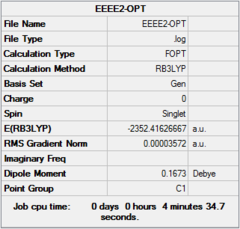
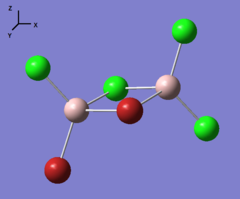
Four isomer were build up in Gaussview and then optimized with method: B3LYP and basis set: Gen. The result of calculation is list below. Aluminum, bromine and chlorine are shown in pink, red and green respectively.
| Optimization | A | B | C | D | ||||||||||||
|
|
|
| |||||||||||||
 |
 |
 |
| |||||||||||||
| Dspace | DOI:10042/26281 | DOI:10042/26283 | DOI:10042/26324 | DOI:10042/26288 | ||||||||||||
| Real point Group | D2h | C1 | C2h | C2v |
Optimization Confirmation
Isomer A:
        Item               Value     Threshold  Converged?
Maximum Force            0.000003     0.000450     YES
RMS     Force            0.000001     0.000300     YES
Maximum Displacement     0.000057     0.001800     YES
RMS     Displacement     0.000015     0.001200     YES
Predicted change in Energy=-2.950818D-10
Optimization completed.
   -- Stationary point found.
Isomer B:
        Item               Value     Threshold  Converged?
Maximum Force            0.000020     0.000450     YES
RMS     Force            0.000011     0.000300     YES
Maximum Displacement     0.000806     0.001800     YES
RMS     Displacement     0.000250     0.001200     YES
Predicted change in Energy=-1.518942D-08
Optimization completed.
   -- Stationary point found.
Isomer C:
        Item               Value     Threshold  Converged?
Maximum Force            0.000022     0.000450     YES
RMS     Force            0.000008     0.000300     YES
Maximum Displacement     0.001107     0.001800     YES
RMS     Displacement     0.000483     0.001200     YES
Predicted change in Energy=-1.142041D-08
Optimization completed.
   -- Stationary point found.
Isomer D
        Item               Value     Threshold  Converged?
Maximum Force            0.000078     0.000450     YES
RMS     Force            0.000022     0.000300     YES
Maximum Displacement     0.000877     0.001800     YES
RMS     Displacement     0.000223     0.001200     YES
Predicted change in Energy=-5.660132D-08
Optimization completed.
   -- Stationary point found.
Symmetry
| Isomer | A | B | C | D |
| Point Group | D2h | C1 | C2h | C2v |
| Symmetry |  |
 |
 |
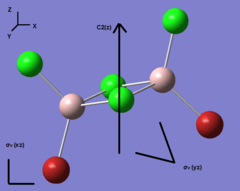
|
Comparison of Energy
| Energy (au) | Energy (kJ/mol) | Relative Energy(kJ/mol) | ||
| A | -2352.4063 | -6190543 | -26.34 | Highest Energy |
| B | -2352.4111 | -6190556 | -13.73 | |
| D | -2352.4163 | -6190569 | -0.13 | |
| C | -2352.4163 | -6190569 | 0.00 | Lowest Energy |
The above table shows that the isomer with lowest energy is isomer C, which has two bromide in terminal position and trans to each other. In the case of isomer D, there are also two bromide with position of terminal, being cis to each other.The total energy of isomer D is slightly higher than isomer C. Since bromide atoms has larger atomic radius than chlorine, isomer D is more steric hindrance;resulting in higher energy.On the other hand, isomer A as the most unstable isomer with two bromide on the bridging position. The overlap between Br-Al (4p-3p) is weaker that Cl-Al (3p-3p) which lead to weaker covalent bond. In addition, two bromide on the bridging condition cause steric effect. Comparing with isomer A, isomer B has one bromide in the bridging while the other on the terminal position. Hence, the energy of isomer B is slightly lower than isomer A.The energies of isomer C and D are lower than isomer A and B which indicates that the bromide in terminal position gives lower energy than bridging position.
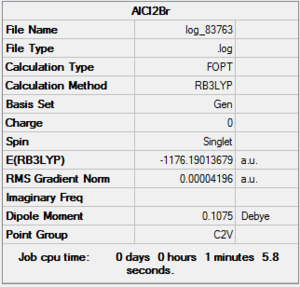
AlBrCl2 Optimization
|
|
D-Space:DOI:10042/26351
        Item               Value     Threshold  Converged?
Maximum Force            0.000136     0.000450     YES
RMS     Force            0.000073     0.000300     YES
Maximum Displacement     0.000681     0.001800     YES
RMS     Displacement     0.000497     0.001200     YES
Predicted change in Energy=-7.984436D-08
Optimization completed.
   -- Stationary point found.
Dissociation Energy
Dissociation Energy = 2E(AlBrCl2) - E(Isomer C)
| ' | Energy (au) | Energy (kJ/mol) |
| Al2Cl2Br | -1176.1901 | -3095237 |
| Isomer C | -2352.4163 | -6190569 |
| Dissociation Energy | 0.0360 | 95 |
The above table indicate that the dissociation energy of Al2Cl4Br2 (95kJ/mol)is positive, which means that the reaction is endothermic.Hence, dimer as isomer C is more stable than two isolate AlBrCl2.
Frequency
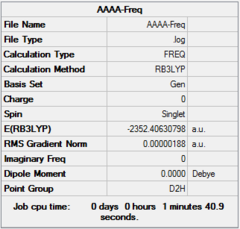
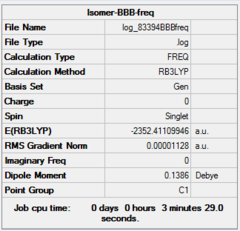
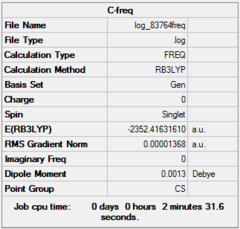
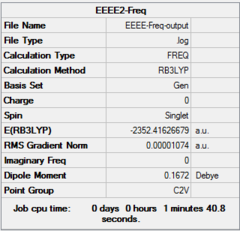
The four isomer is then analysis by calculated frequency in order to confirm that the structure is maximum optimized. The method and basic set are set same as optimization.
| Frequency | A | B | C | D | ||||||||||||
|
|
|
| |||||||||||||
 |
 |
 |
| |||||||||||||
| Dspace | DOI:10042/26268 | DOI:10042/26267 | DOI:10042/26323 | DOI:10042/26265 |
Frequency Discussion
The result of frequency is shown in the below table.
| A(D2h) | B(C1) | C(C2h) | D(C2v) | |||||
| Mode | Frequncy(cm-1) | Infrared | Frequncy(cm-1) | Infrared | Frequncy(cm-1) | Infrared | Frequncy(cm-1) | Infrared |
| 1 | 15 | 0 | 17 | 0 | 18 | 0 | 17 | 0 |
| 2 | 63 | 0 | 56 | 0 | 49 | 0 | 51 | 0 |
| 3 | 86 | 0 | 80 | 0 | 73 | 0 | 79 | 0 |
| 4 | 87 | 0 | 92 | 1 | 105 | 0 | 99 | 0 |
| 5 | 108 | 5 | 107 | 0 | 110 | 0 | 103 | 3 |
| 6 | 111 | 0 | 110 | 5 | 117 | 9 | 121 | 13 |
| 7 | 126 | 8 | 121 | 8 | 120 | 13 | 123 | 6 |
| 8 | 135 | 0 | 149 | 5 | 157 | 0 | 157 | 0 |
| 9 | 138 | 7 | 154 | 6 | 160 | 6 | 158 | 5 |
| 10 | 163 | 0 | 186 | 1 | 192 | 0 | 194 | 2 |
| 11 | 197 | 0 | 211 | 21 | 263 | 0 | 264 | 0 |
| 12 | 241 | 100 | 257 | 10 | 280 | 29 | 279 | 25 |
| 13 | 247 | 0 | 289 | 48 | 308 | 0 | 309 | 2 |
| 14 | 341 | 161 | 384 | 154 | 413 | 149 | 413 | 149 |
| 15 | 467 | 347 | 424 | 274 | 421 | 438 | 420 | 411 |
| 16 | 494 | 0 | 493 | 107 | 459 | 0 | 461 | 35 |
| 17 | 608 | 0 | 574 | 122 | 574 | 0 | 570 | 32 |
| 18 | 616 | 332 | 614 | 197 | 579 | 316 | 582 | 278 |
| Total Number of Inactive Mode: | 11 | 4 | 11 | 6 | ||||
The number of vibration mode of four isomer are all 18 due to the rule of 3N-6 where N is the number of atoms.The more symmetric of the molecule structure, the more dipole moment will be cancelled out when vibrating. When the dipole moment of the molecule vibration equal to zero, the mode are considered as IR inactive which means that there is no peaks shown on the spectrum. The above table shows that isomer A and isomer C are the molecules with most number of inactive mode. This indicates that isomer A and isomer C show less bands than the others due to the highly symmetric structures.
| Mode | Isomer A | Isomer C |
| 11 | 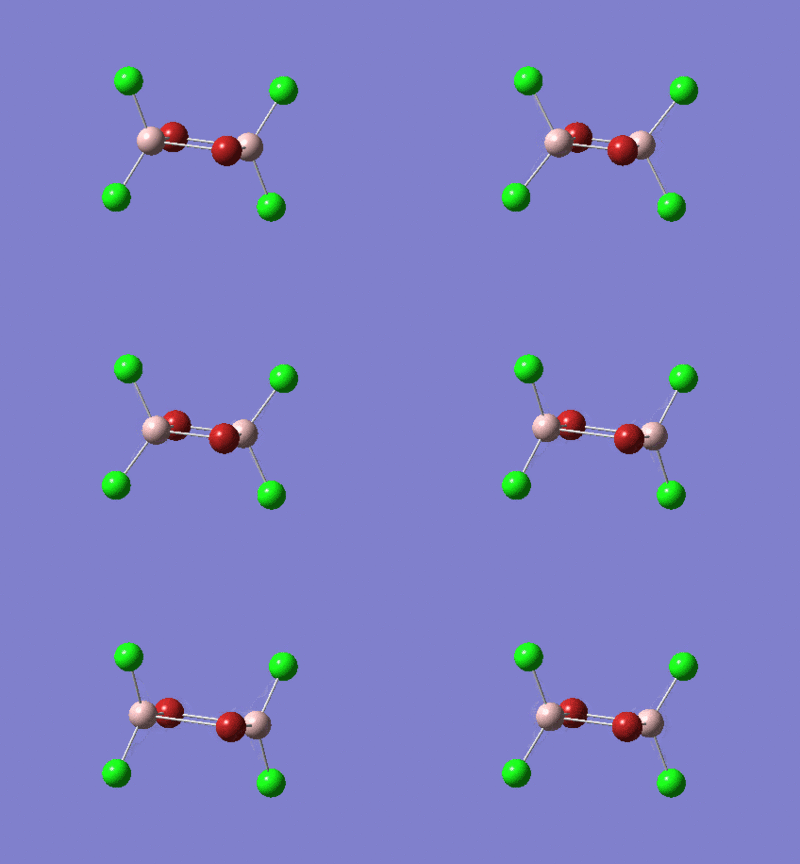 |
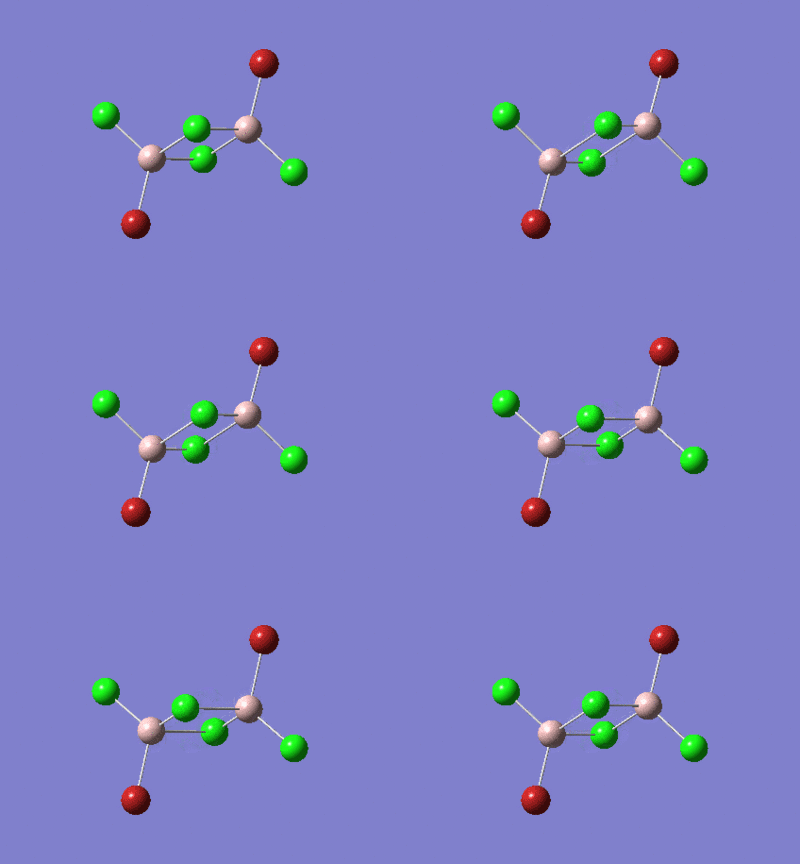
|
| Frequency | 197 | 263 |
| Intensity | 0 | 0 |
Mode 11 of both isomer A and C are the vibration of two bridging atoms. The two bridging move different directions forming stretch vibrations. Isomer A has two bromides on the bridging position, while isomer C has two bromides on the terminal position. The frequency of isomer A is lower than isomer C. In addition, the bond length of Al-Br ( 2.50 Å)in isomer A is longer than isomer C(2.27 Å). This shows that the bond strength of Al-Br in bridging position is weaker than that of Al-Br in the terminal position. This is due to steric effect since the atomic radius of bromide is large, comparing with that of chloride.
| Mode | Isomer C | Isomer D |
| 18 | 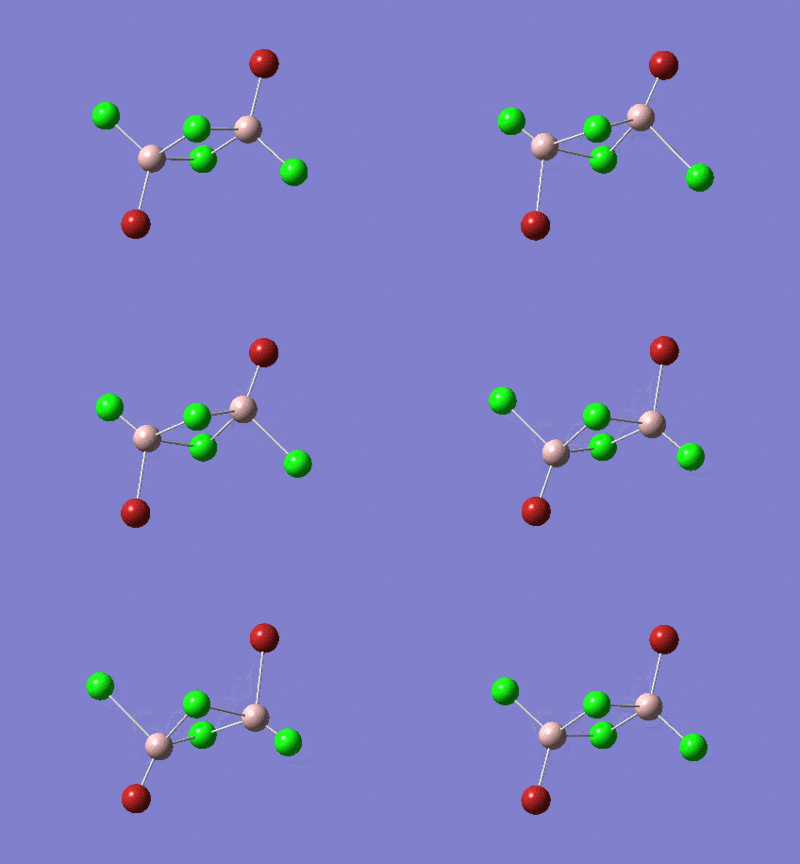 |
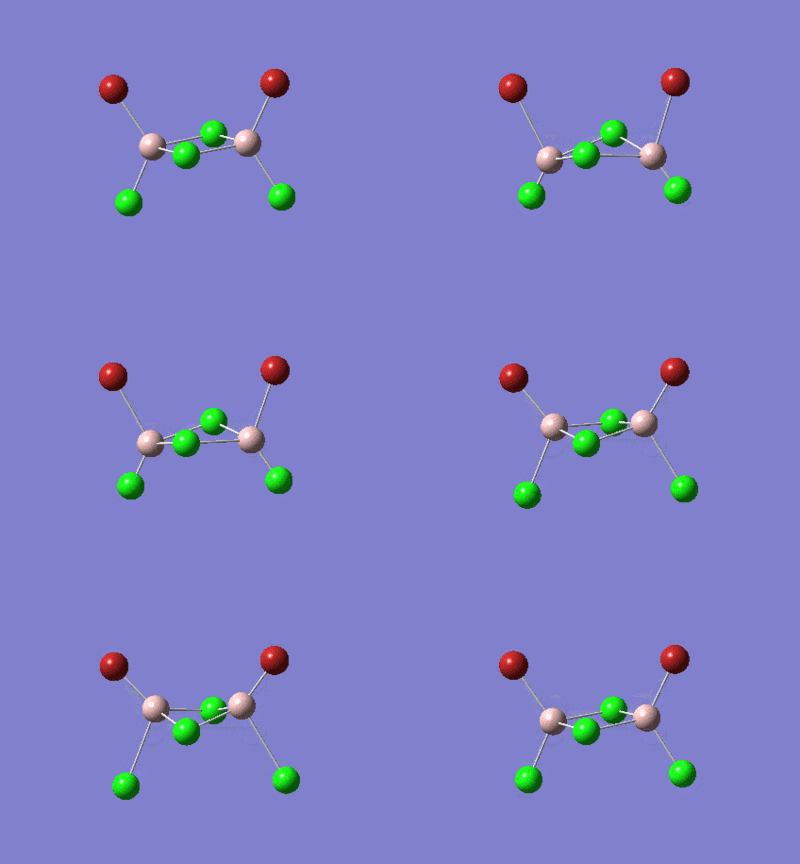
|
| Frequency | 579 | 582 |
| Intensity | 316 | 278 |
In mode 18, isomer C and D both show that the aluminium vibration with same direction. Both isomer C and D have two bromides in the terminal position. The two bromides in isomer C are trans to each other, while there are two cis bromides in isomer D. The values of frequency of both isomer are very close. In addition, the bond lengths of both isomer are the same (2.27 Å). Hence, we can obtained that the position of terminal bromide does not effect the nature of Al-Br bond.
Calculation Result
Isomer A
        Item               Value     Threshold  Converged?
Maximum Force            0.000006     0.000450     YES
RMS     Force            0.000002     0.000300     YES
Maximum Displacement     0.000066     0.001800     YES
RMS     Displacement     0.000021     0.001200     YES
Predicted change in Energy=-3.736205D-10
Optimization completed.
   -- Stationary point found.
Low frequencies ---   -5.1748   -5.0353   -3.1463    0.0027    0.0030    0.0039
Low frequencies ---   14.8261   63.2702   86.0770
Isomer B
        Item               Value     Threshold  Converged?
Maximum Force            0.000034     0.000450     YES
RMS     Force            0.000011     0.000300     YES
Maximum Displacement     0.000897     0.001800     YES
RMS     Displacement     0.000373     0.001200     YES
Predicted change in Energy=-2.934869D-08
Optimization completed.
   -- Stationary point found.
Low frequencies ---   -2.2705   -0.0027   -0.0024   -0.0019    1.2791    3.3179
Low frequencies ---   17.1478   55.9562   80.0556
Isomer C
        Item               Value     Threshold  Converged?
Maximum Force            0.000040     0.000450     YES
RMS     Force            0.000014     0.000300     YES
Maximum Displacement     0.001356     0.001800     YES
RMS     Displacement     0.000593     0.001200     YES
Predicted change in Energy=-1.805358D-08
Optimization completed.
   -- Stationary point found.
Low frequencies ---   -0.0029   -0.0024   -0.0018    1.8920    1.9704    3.9624
Low frequencies ---   18.0988   49.0858   72.9223
Isomer D
        Item               Value     Threshold  Converged?
Maximum Force            0.000020     0.000450     YES
RMS     Force            0.000011     0.000300     YES
Maximum Displacement     0.001003     0.001800     YES
RMS     Displacement     0.000378     0.001200     YES
Predicted change in Energy=-2.220935D-08
Optimization completed.
   -- Stationary point found.
Low frequencies ---   -4.3668   -2.6848   -0.0027   -0.0019    0.0002    0.8441
Low frequencies ---   17.1260   50.9136   78.5359
IR Spectrum:
Molecular Orbital
Further Study
The below compound is also considered as a isomer of Al2Cl4Br2. However, this isomer can not be directly formed from the combination of two AlCl2Br. It can be obtained via Schlenk equilibrium.
|

|
Optimization
Dspace:DOI:10042/26379
        Item               Value     Threshold  Converged?
Maximum Force            0.000023     0.000450     YES
RMS     Force            0.000011     0.000300     YES
Maximum Displacement     0.000649     0.001800     YES
RMS     Displacement     0.000222     0.001200     YES
Predicted change in Energy=-2.950670D-09
Optimization completed.
   -- Stationary point found.
Frequency
Dspace:DOI:10042/26378
        Item               Value     Threshold  Converged?
Maximum Force            0.000032     0.000450     YES
RMS     Force            0.000010     0.000300     YES
Maximum Displacement     0.000914     0.001800     YES
RMS     Displacement     0.000375     0.001200     YES
Predicted change in Energy=-2.538496D-08
Optimization completed.
   -- Stationary point found.
Low frequencies ---   -4.3022   -2.9785   -1.6814   -0.0022   -0.0022    0.0026
Low frequencies ---   17.6755   50.9353   72.1689
The range of low frequencies is 0 ± 15 cm-1 which is considered that the optimization is completed.
Reference
- ↑ "Physical Constants of Organic Compounds", in CRC Handbook of Chemistry and Physics, Internet Version 2005, David R. Lide, ed., <http://www.hbcpnetbase.com>, CRC Press, Boca Raton, FL, 2005.
- ↑ "Gallium tribromide: molecular geometry of monomer and dimer from gas-phase electron diffraction", Reffy, Balazs; Kolonits, Maria; Hargittai, Magdolna Journal of Molecular Structure, 1998, 445, 139–148.
- ↑ W. M. Haynes, D. R. Lide and T. J. Bruno, CRC handbook of chemistry and physics : a ready-reference book of chemical and physical data, 2012.
- ↑ Hunt Research Group, Understanding optimisation part a., http://www.huntresearchgroup.org.uk/teaching/teaching_comp_lab_year3/3a_understand_opt.html

