Rep:Mod:yuchengzhoulovephy
From: Zhou Yucheng
Cope Rearrangement of 1,5-hexadiene
Introduction
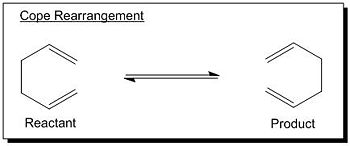
The tutorial focused on the study of the cope rearrangement of 1,5-hexadiene (see Fig 1) by locating the low-energy minima and transition structures on the C6H10 potential surface using Gaussian, thereby to determine the favoured reaction mechanism. The tutorial was divided into two parts; the first part concerned the optimisation of the reactants and products, followed by the optimisation of the “chair” and “boat” transition structures in the second part.
 |
Optimizing the Reactants and Products
The aim of this section was to optimise the geometries of both reactants and products, symmetrise them to find the corresponding point groups, run frequency calculation to check if obtaining the minimum energy geometry and finally compare the results with the experimental data.
Theoretically, 1,5-hexadiene has 27 possible conformations present, however, only 10 are energetically distinct[1]. Therefore, in order to fully study this cope rearrangement reaction the energetically distinct 10 conformations must be optimised first and based on the lowest energy conformation one could find the reactant molecular geometry, thereby to calculate the activation energies and enthalpies using that conformation as a reference.
All the possible anti-conformations were drawn in such a way that the central dihedral angels were 180o and the possible 4 energetically distinct anti conformers were obtained by alternating the relevant dihedral angels (N.B. the central dihedral angels were still kept 180o) so that the overall geometries resembled the corresponding ones given in Appendix 1. The same process applied to drawing the gauche-conformations, but in this case the central dihedral angels were set to around 60o. Then all the 10 conformations were applied ‘clean structure function’, followed by optimisation using HF/3-21G. The outcomes (geometries, energies and point groups) exactly matched with the information in Appendix 1. Further on, A higher method (B3LYP) with better basis set (6-31G*) was employed on the previously HF optimised 10 conformations which were further checked if obtaining minima by running frequency calculations. The table below listed all the DFT optimised conformations in Jmol with the corresponding energies, enthalpies, point groups and geometric changes.
| Conformer | Jmol of optimised geometry | Point group | Energy/a.u.(HF/3-21G) | Energy/a.u.(DFT/6-31G*) | sum of electronic and zero-point energies/a.u. | sum of electronic and thermal energies/a.u. | sum of electronic and thermal enthalpies/a.u. | sum of electronic and thermal free energies/a.u. | Geometric changes from using HF method to DFT method | ||
|---|---|---|---|---|---|---|---|---|---|---|---|
| Anti1 | C2 | -231.69260 | -234.61179 | -234.326805 | -234.312143 | -234.310254 | -234.389932 | C=C 1.32Å to 1.33Å; C-C 1.51Å to 1.50Å; C=C-C 124.8⁰ to 125.2⁰ | |||
| Anti2 | Ci | -231.69254 | -234.61172 | -234.32664 | -234.311955 | -234.310067 | -234.389775 | C=C 1.32Å to 1.33Å; C-C 1.55Å to 1.54Å; =C-C-C 111.3⁰ to 112.7⁰ | |||
| Anti3 | C2h | -231.68907 | -234.60962 | -234.324412 | -234.310022 | -234.308134 | -234.386524 | C=C 1.32Å to 1.33Å; C-C 1.53Å to 1.53Å; C=C-C 127.1⁰ to 127.2⁰ | |||
| Anti4 | C1 | -231.69097 | -234.61079 | -234.325598 | -234.311095 | -234.309207 | -234.388173 | C=C 1.32Åto 1.33Å; C-C 1.54Å to 1.54Å; =C-C-C 115.1⁰ to 115.9⁰ | |||
| Gauche1 | C2 | -231.68772 | -234.60788 | -234.322567 | -234.308327 | -234.306439 | -234.384243 | C=C 1.32Å to 1.33Å; C=C 1.54Å to 1.54Å; central dihedral angle 75.8⁰ to 75.4⁰; distance between chain ends 3.51Åto 3.56Å | |||
| Gauche2 | C2 | -231.69167 | -234.61069 | -234.325883 | -234.311249 | -234.309361 | -234.389347 | C=C 1.32Å to 1.33Å; C=C 1.55Å to 1.55Å; central dihedral angle 64.2⁰ to 65.2⁰; distance between chain ends 4.39Å to 4.52Å | |||
| Gauche3 | C1 | -231.69266 | -234.61133 | -234.326056 | -234.311598 | -234.30971 | -234.388877 | C=C 1.32Å to 1.33Å; C=C 1.55Å to 1.55Å; central dihedral angle 67.7⁰ to 66.3⁰; distance between chain ends 4.82Å to 4.94Å | |||
| Gauche4 | C2 | -231.69153 | -234.61048 | -234.325088 | -234.310562 | -234.308674 | -234.386898 | C=C 1.32Å to 1.33Å; C=C 1.55Å to 1.55Å; central dihedral angle 63.7⁰ to 61.9⁰; distance between chain ends 5.5Å to 5.6Å | |||
| Gauche5 | C1 | -231.68962 | -234.60911 | -234.323626 | -234.309317 | -234.307428 | -234.385766 | C=C 1.32Å to 1.33Å; C=C 1.55Å to 1.55Å; central dihedral angle 71.0⁰ to 71.8⁰; distance between chain ends 4.72Å to 4.76Å | |||
| Gauche6 | C1 | -231.68916 | -234.60889 | -234.323673 | -234.30932 | -234.307432 | -234.385846 | C=C 1.32Å to 1.33Å; C=C 1.55Å to 1.55Å; central dihedral angle 70.2⁰ to 70.5⁰; distance between chain ends 3.79Å to 3.82Å |
Comment on Frequency Calculation:
The frequencies are essentially the 2nd derivative of the PES and they can tell if certain geometry has a minimum or TS by looking at their signs. In this case the frequency calculations gave all the vibrational frequencies for each conformation, therefore all of them lie at the minima of their PES.
Comment on Changes in Geometry and Energy of Each Conformation:
• There are two ways we can look into the difference in energy and geometry of each conformation between different methods and basis sets. The first way is to look at these differences internally. By internally, I mean comparing the geometry and energy changes in each conformer between two different methods and basis sets. The second way is to look at the differences externally. By externally, I mean compare the energy and geometry of one conformer with another one and therefore to rationalise the observation.
• The first way: As the above table shows there is no significant change in geometry of each conformation when applying higher method and basis set (B3LYP/6-31G*) and the point groups kept the same when the conformers were re-optimised. However, these slight changes have given rise to remarkable decrease in energy (i.e. reduced by about 3 a.u. for each conformation).
• The second way: The HF optimisation gave the lowest energy conformation to Gauche 3, however, the DFT optimisation gave the lowest energy conformation to Anti 1. The energy differences between these two conformations are very small though (about 0.16 kJ/mol in the case of HF optimisation and approximately 1.2 kJ/mol in the case of DFT optimisation).The general explanation lies in the two competing factors which are electronic stabilisation and steric stabilisation. In anti conformations, the central dihedral angles are about 180⁰ which minimises the steric clash between vinyl groups and the chain ends; therefore anti conformations experience the steric stabilisation. In contrast, gauche conformations are bearing relatively large steric hindrance since the central dihedral angle is approximately 60⁰. However, there is a so called CH-π interaction (i.e. electronic stabilisation effect) only present in Gauche conformation and this interaction is energetically favourable between π-electrons of C=C double bond and the nearby vinyl proton[1]. In the HF optimisation case, the CH-π stabilisation interaction wins over the steric destabilisation effect on Gauche 3; while in the DFT optimisation case, the steric factor wins over the electronic stabilisaton and hence Anti 1 lies slightly lower in energy.
Optimizing the Chair and Boat Transition Structures
The aim of this section is to achieve a transition structure by setting up appropriate TS optimisations. It introduced 3 different routes which can lead to the successful optimisation of TS, however, all the 3 routes have drawback and only work when certain criterions are satisfied or certain information about the reaction are known. The first one is Hessian method based on a reasonable guess for the TS geometry and with the aid of computing the force constants at the beginning of the calculation. The second method requires using the redundant coordination editor which involves freezing the reaction coordinate first and then changing to derivative option to get the finally optimised TS. The third route is to employ QST2 which only works when the reactants and products are close to transition structure. (Due to the limitation of time, QST3 did not get chance to try out). Finally, the reaction coordination of the forward cope rearrangement via chair TS was view by running IRC and the activation energies for this reaction were calculated for chair and boat TS respectively.
Chair TS
First of all, to create a transition structure an allyl fragment was constructed and optimised at HF/3-21G level in Gaussview (see the Jmol below for the optimised allyl fragment)
Then two optimised allyl fragment were ‘cope and past’ onto a new window where they were rearranged in such a way that the overall structure mimicked the real chair like TS. The separation distances between chain end carbons were set to 2.20Å which was close to the separation in real TS. And the opt+ freq calculation was run at HF/3-21G level, with optimisation to TS(Berny) and calculating force constants once. In additional, opt=noeigen was input to avoid the system crashing when encountering the negative vibrational frequencies. This way to achieve the transition structure followed the first route (i.e. Hessian method). The optimised chair TS in Jmol with corresponding data were listed in the table below:
| Chair TS | Point group | Negative vibrational frequency/cm-1 | Energy/a.u.(HF/3-21G) | sum of electronic and zero-point energies/a.u. | sum of electronic and thermal energies | sum of electronic and thermal enthalpies | sum of electronic and thermal free energies | ||
|---|---|---|---|---|---|---|---|---|---|
| C2h | -818 | -231.61932 | -231.31409 | -231.303372 | -231.301483 | -231.371101 |
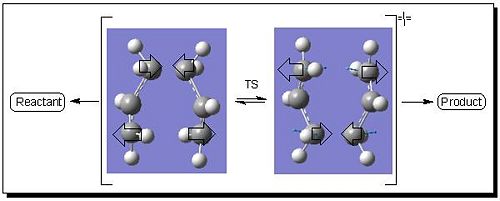
The optimised breaking/forming bond distance changed from initial 2.20Å to 2.02Å and the structure was conformed to be TS as there was only one negative vibrational frequency. The corresponding vibration is shown in Fig 2:
 |
The 2nd route requires ‘frozen coordination’ method using redundant coordinator editor to freeze the reaction coordination of chain end carbons (set to 2.20Å), followed by optimisation to a minimum (as if there was a minimum present) at HF/3-21G level. The resulting structure was then altered from ‘freeze coordination’ to ‘derivative’ option, followed by opt+freq calculation to TS(Berny) at HF/3-21G level . The table below listed the Jmol of the optimised structure under frozen coordination condition and the reoptimised TS under non-fixed bond distances as well as the corresponding energies.
| Optimised structure (at fixed bond distance) | Optimised TS (at non-fixed bond distance) | |||||
|---|---|---|---|---|---|---|
| Structure in Jmol | ||||||
| Total energy/a.u. | -231.61519 | -231.61932 |
The optimised breaking/forming bond distance in final transition structure was 2.02Å (changed from 2.20Å under fixed bond distance optimisation). The point group of final TS was C2h and the only negative vibrational frequency detected was -818 cm-1. The data shows that the 2nd route lead to the optimised TS with exactly the same energy, point group, breaking/forming bond distance and the negative frequency as the one obtained from 1st route using Hessian method. This tells that both methods will finally lead the initial structure to same point of the TS in the PES. The difference is the Hessian method does the entire job at once (i.e. run opt+freq calculation on the initial guessed transition structure to TS(Berny) with calculating the force constant once), while the ‘frozen coordination’ method does optimisation in two steps (i.e. firstly, optimise the initial guessed structure to minimum under frozen coordination condition; secondly reoptimise the obtained minimum under non-fixed bond distance condition, which directly launched at the TS on PES).
Boat TS
The 3rd route (QST2 method) was illustrated in optimisation of boat TS. The DFT optimised anti 2 conformation was used as reactant and product in cope rearrangement to generate the boat TS, which was done by copying the anti 2 conformation to a new molgroup, followed by ‘append molecule’ of anti 2 to the second window. Two anti 2 conformations were orientated in the following way with each atoms numbered in a correct way (see Fig 3)
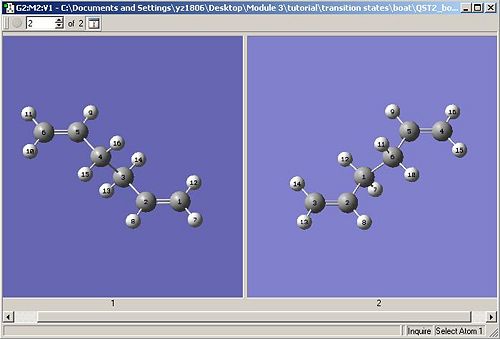 |
The opt+freq calculation this time was run to TS(QST2) instead of TS(Berny) at HF/3-21G level. As expected, the calculation failed and the resulting structure was dissociated chair like transition structure (see Jmol below). The failure is due to both reactant and product structures were not close to transition structure.
In order to avoid getting error output file, the anti 2 conformations were rearranged in the following manna that both of reactant and product structures were close to TS (see Fig 4)
 |
The opt+freq calculation was then carried out to TS(QST2) at HF/3-21G level. The QST2 method was different from previous route 1 and 2 as it did not require to construct a guessed transition structure, but instead, it would automatically result an intermediate depending on the input reactant and product structures. Therefore, to get the numbering of atoms correct is vital for getting a successfully complete output file from Gaussian. The optimised boat TS is shown in the table below.
| Optimised boat TS in Jmol | Point group | Negative vibrational frequency/cm-1 | Corresponding TS vibration | Breaking/forming bond distance/Å | Total energy/a.u. | ||
|---|---|---|---|---|---|---|---|
| C2v | -839 | 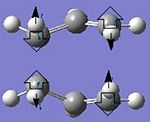 |
2.14 | -231.60280 |
Chair IRC
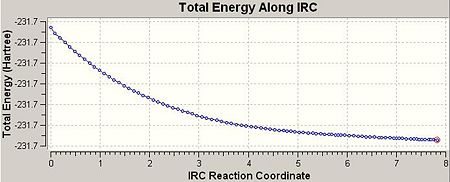
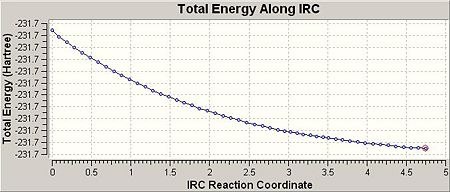
So as to view the minimum energy path from chair TS to its local minimum on PES ‘Intrinsic Reaction Coordination’ method (i.e. IRC) was employed. The work is done by creating a series of points as taking small geometry steps in the forward direction where the gradient of PES is steepest. The IRC method was then employed on the previously HF optimised chair TS with the number of steps setting to 50 at HF/3-21G level of theory. The results were shown in the table below:
| IRC path | Geometry at step 1 (chair TS) | Geometry at step 51 (product) | Total energy of final geometry (i.e. product geometry)/a.u. | Point group of final geometry | ||||
|---|---|---|---|---|---|---|---|---|
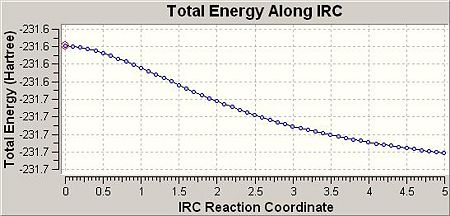 |
-231.68054 | C2 |
According to the total energy and point group of final geometry, the product resembled closely to Gauche 1 with a slight difference (by about 0.007 a.u.) in energy, which indicates that the final geometry hasn’t reached a minimum. Therefore, the minimum was further obtained through 3 different routes. The first one was optimising the final geometry (on IRC path) to minimum at HF/3-21G level of theory. The process was fast and completed in 1min 27sec, provided the final geometry was close to the local minimum. The second route was to restart the IRC but with the number of steps setting to 90 instead of initial 50. This method was more reliable comparing to the first one, and of course, required much longer time to complete (30min 50sec). The third route was essentially to redo the IRC at 50 steps but with specifying calculating the force constants always instead of once. The third method was theoretically most reliable and most time consuming (69min 23sec). The table below listed the results from 3 different routes:
As we can see from the above table, all 3 structures had C2 point group and their energies were relatively close and presented in an ascending manna (i.e. the energy increased slightly from route 1 to route 3). The total energy and point group of the route 1 structure exactly matched with the Gauch 2 conformation, which suggested that Gauche 2 conformaiton participated in the cope rearrangement via ether chair or boat TS.
Activation Energies
In order to more accurately calculate the activation energies both chair and boat transition structures were further optimised at B3LYP/6-31G* level of theory. The table below (in Fig 5) listed the activation energies for cope rearrangement via chair TS and via boat TS at 298.15K with the corresponding experimentally determined activation energies at 0k.
 |
The computed activation energies of both chair and boat TS were in good agreement with the experimental data, which shows the reliability of the calculated data at B3LYP/6-31G* level of theory. Also the higher method/bass set confirmed two pieces of information: (1) the chair TS lies lower in energy than boat TS; (2) the correct conformations involved in cope rearrangement. As a conclusion, the cope rearrangement should proceed via lower energy chair TS and the suggested conformations involved in this reaction is Gauche 2 conformer.
The Diels Alder Cycloaddition
Introduction
This exercise concerns the Diels Alder reaction which belongs to pericyclic reactions. The Diels Alder reaction requires π orbitals of the dieneophile and diene to form new σ-bonds in a concerted stereospecific fashion which requires good overlap between HOMO of one reactant with LUMO of the other reactant, therefore these HOMO and LUMO of the same symmetry must orientated in a correct direction for maximum overlap to occur.
In this exercise we are going to explore the Diels Alder reactions through studying the intermediate transition structures for two different cases: (1) prototype reaction; (2) Both substituted diene and dieneophile reaction where secondary orbital effects play an important rule for determination of which (exo or endo) product is more favoured.
Optimisation of Cis-butadiene and Generation of its MOs
In order to study the prototype Diels Alder reaction between cis-butadiene and ethylene, we need to analyse the HOMO and LUMO of both reactants, and therefore to rationalise how the reaction takes place in terms of HOMO and LUMO interaction.
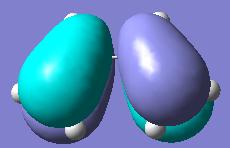
Firstly, the cis-butadiene was optimised at AM1 level of theory with additional input ‘pop=full’ to enable the plot of MOs. The table below listed the HOMO and LUMO of cis-butadiene:
| MOs of cis-butadiene | HOMO | LUMO | ||
|---|---|---|---|---|
| Quantitative MO representation | ||||
| Qualitative MO representation | 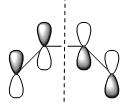 |
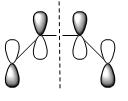
| ||
| Plane of symmetry | asymmetric | symmetric |
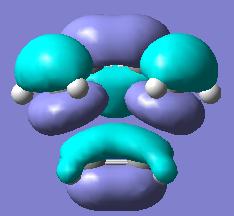
According to the table above cis-butadiene has asymmetric HOMO and symmetric LUMO with respect to plane. As mentioned earlier on, in order to perform the cycloaddiiton in a concerted stereospecific fashion a good overlap between HOMO of one reactant and LUMO of the other is essential. And as we know, cis-butadiene is more electron-rich than ethylene, therefore the HOMO of cis-butadiene is most likely to interact with LUMO of ethylene in the Diels Alder reaction. So as to prove the above statement the following part of the exercise carried out the optimisation of TS for this reaction which enabled us to see how the HOMO and LUMO interacted in TS to form product.
TS Geometry for the Prototype Reaction
The Diels Alder reaction of cis-butadiene with ethylene took place under heat condition and there were 6π-electrons involved in this cycloaddition, therefore it had a Huckel TS via suprafacial arrangement (see the reaction mechanism in Fig 6).
 |
Optimisation of TS
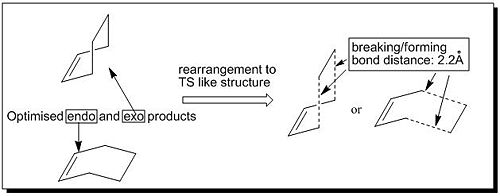
This part of exercise aimed to find the optimised TS for the Diels Alder reaction between cis-butadiene and ethylene and rationalise the nature of this prototype cycloadditon reaction path in terms of HOMO-LUMO interactions of two reactants. So first of all, we need to find the TS for this reaction. In order to propose a transition structure with reasonable guess the process was done in following steps: (1) setting up the endo (and exo) product structures; (2) optimising the product geometries; (3) manually removing the new formed σ-bonds and setting the forming/breaking bond distances to 2.20Å which looked like an envelope structure (see Fig 7).
 |
Now the constructed transition structure was based reasonable guess since it was derived from product structures. Opt+Freq calculation was then performed on the guessed TS at semi empirical/AM1 level of theory to optimise it to TS(Berny) with setting ‘calculate force constants once’ and adding input ‘opt=noeigen’. The optimisation of TS failed as the frequency calculation generated two negative vibrational frequencies. So a second trial of optimising the TS altered the calculation setting by just changing ‘calculate the force constants once’ to ‘calculate the force constant always’ and leaving the rest setting the same as for the previous optimisation. This time the calculation gave the successfully optimised TS as indicated by the presence of only one negative vibraitonal frequency. The table below contained the Jmol of the optimised TS with relevant data obtained from successful Opt+Freq calculation.
| Jmol of optimised TS | Interfragment distance/Å | Dashed double bond length in cis-butadiene/Å | Double bond length in cis-butadiene/Å | Double bond length in ethylene/Å | van der Waals radius of the C atom[2]/Å | ||
|---|---|---|---|---|---|---|---|
| 2.12 | 1.40 | 1.38 | 1.38 | 1.70 |
Geometric Analysis
The optimised TS had interfragment distance at 2.12Å which shorted slightly from initial setting 2.20Å. The dashed double bond distance in cis-butadiene was 1.40Å which is longer than normal C=C double bond length 1.34Å[3]; but shorter than the usual C-C single bond length 1.54Å[3]. This shows the evidence that the dashed double bond was in the process of forming formal C=C double bond from C-C single bond. C=C double bonds in both cis-butadiene and ethylene were at 1.38Å which was in between of single C-C and double C=C bond lengths. This also implies that these double bonds were essentially undergoing C=C double bond transformation to C-C single bond. The van der Waals radius of the carbon atom is 1.70Å comparing to the interfragment distance 2.12Å, we can see a significant overlap of the relevant carbon orbitals from cis-butadiene and ethylene fragments since these adjacent carbons were very close together. As an overall, these geometric data partially confirmed the presence of TS.
IR Analysis
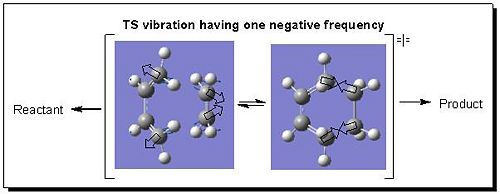
The Opt+Freq calculation generated the vibrational frequencies for the TS at the same time as optimising the TS. To fully confirm if the resulted geometry was transition structure, the best way is to check how many negative frequencies present in vibration. Since there was only one negative vibrational frequency (-956 cm-1) resulted which proved the obtainment of the TS and this negative frequency was corresponding to the bond breaking/formation process in which the intermediate species either returned back to reactant or went forwards to product (see Fig 8). Furthermore, the vibrational motion of TS below in Fig 8 was synchronous, therefore the formation of two new σ-bonds was synchronous.
 |
MO Analysis of TS
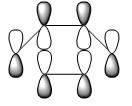
To plot MOs of the TS, the Opt+Freq calculation was carried out to reoptimise the structure at AM1 level of theory to TS(Berny) again but this time choosing ‘calculate the force constants ONCE’ with additional input ‘pop=full’. The most important MOs generated from Gaussian are HOMO and LUMO, by analysing which we can tell the formation of new σ-bonds and rationalise why the reaction is allowed. The resulted HOMO and LUMO of the TS for this prototype reaction were shown in the table below:
| MOs of cis-butadiene | HOMO | LUMO | ||
|---|---|---|---|---|
| Quantitative MO representation | ||||
| Qualitative MO representation | 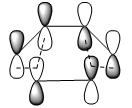 |
| ||
| Plane of symmetry | asymmetric | symmetric |
As we can see from the above table that HOMO of the TS (asymmetric) was formed by interaction between HOMO of cis-butadiene (asymmetric) and LUMO of ethylene (asymmetric); since both HOMO and LUMO in bonding interactions are asymmetric with respect to the plane, therefore the reaction is allowed. Now looking at the LUMO of TS, it is symmetric with respect to the plane and its formation came from the approach of HOMO from ethylene (symmetric) to the LUMO of cis-butadiene (symmetric). As an overall, the orbitals (HOMO from cis-butadiene and LUMO from ethylene) with the same symmetry overlapped well to generate the cycloaddition product in a concerted fashion and the Diels Alder reaction is therefore allowed.
The Study of Regioselectivity of the Diels Alder Reaction
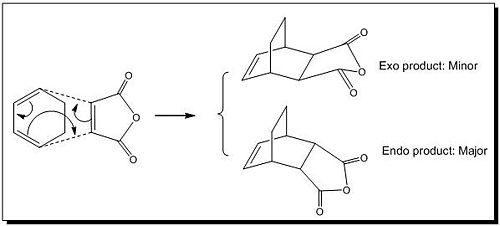
This part of exercise dealt with the cycloaddition where both diene and dieneophile were substituted, in this case, the reactants were cyclohexa-1,3-diene and maleic anhydride and the reaction primarily produced endo product which was sterically more stable than exo product. Therefore this Diels Alder reaction (see Fig 9) is proposed to be kinetically controlled. In order to fully analyse why endo formation is more favoured over exo one, we need to study their transition structures and the associated MOs.
 |
Optimisation of TS
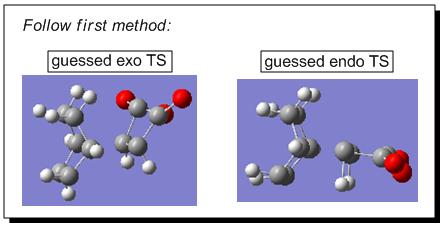
There were two ways to approach the answers of locating the endo and exo transition states for the Diels Alder reaction between cyclohexa-1,3-diene and maleic anhydride. The first way was following the Hessian method based on a reasonable guess for the transition structure geometries. Firstly, the fragments of cyclohexa-1,3-diene and maleic anhydride were arranged manually in such a way that the overall geometries mimicked the real exo and endo transition structures (based on guess, such as setting up the bond forming/breaking distance to c.a. 2.09Å, etc.)(see Fig 10).
 |
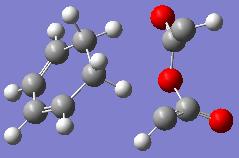
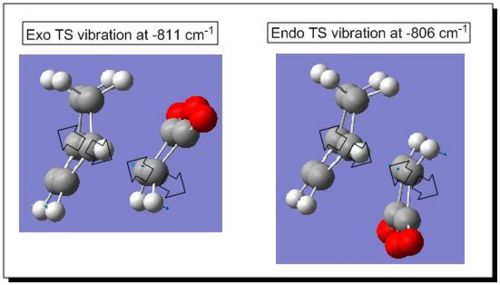
Secondly, the transition state optimisation was set up for both combinations. So following the path: opt+freq->TS (Berny)->calculate the force constants always->semi empirical->AM1->opt=noeigen->submit; the calculation resulted in a successful optimisation of exo transition structure (see Jmol) which had only one negative value at -811 cm-1 ; however, the optimisation of endo transition structure failed (see Fig 11), which is most likely due to the guessed transition structure was far from the exact transition structure. This failure can be overcome by the second method, the pathway of which was described in the following paragraph.
| Successfully optimised exo TS from method 1 | Failed optimisation of endo TS from method 1 | ||
|---|---|---|---|
 |
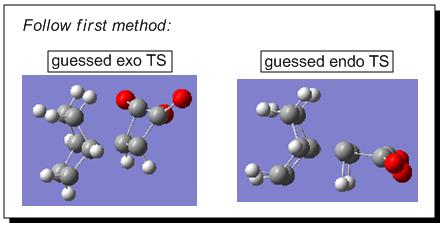
The core of the second way was following the ‘freezing the reaction coordinate’ method. Firstly, both endo and exo product geometries were optimised to minimum through the path: optimisation to minimum->semi empirical->AM1->submit. Secondly, based on the optimised geometries of the endo and exo products, we knew the transition structures are somewhere close to the optimised product structure. Therefore, in both cases the bonds forming/breaking during the Diels Alder reactions were broken manually and set to a distance of around 2.09Å. Then the coordination of the related carbons (i.e. C6-C5 and C2-C3, see Fig 12) was frozen, followed by optimisation to minimum->semi empirical->AM1->submit.
 |
Thirdly, the optimised geometries obtained under ‘freezing reaction coordination’ condition were released the frozen coordination by choosing Derivative instead of Freeze Coordination. Then the transition state optimisation was set and the followed the following optimisation: opt+freq->TS (Berny)->Calculate the force constants always->semi empirical->AM1->opt=noeigen->submit. This time both exo and endo TS geometries were optimised successfully with only one negative frequency in each case (i.e. exo TS had –811cm-1 and endo TS had –806 cm-1). The optimised exo TS geometry obtained from second method was compared with that from first method, as expected, they gave exactly the same negative vibrational frequencies and their total energies are exactly the same. This is saying that both methods will eventually lead the geometry to the real transition structure but just via different paths. The table below listed the Jmol of both optimised endo and exo TS as well as the relevant data from optimisation calculation:
| Jmol of optimised TS | Energy of TS/au.u | Energy of product/a.u. | Interfragment distance (i.e. forming/breaking bond distance)/Å | Dashed double bond length (between C4 & C1) in cyclohexa-1,3-diene fragment/Å | (the rest ) Dashed double bond length in cyclohexa-1,3-diene fragment/Å | Dashed double bond length in maleic anhydride /Å | ||
|---|---|---|---|---|---|---|---|---|
| -0.050503 | -0.159968 | 2.17 | 1.40 | 1.39 | 1.41 | |||
| -0.051594 | -0.160232 | 2.16 | 1.40 | 1.39 | 1.41 |
Geometry Analysis on Endo and Exo TS
According to the table above, both exo and endo TS had same dashed bond lengths which were initially involved in the concerted cyclo-interaction. However, the forming/breaking bond distances differed slightly between endo and exo TS (i.e. in endo case the separation was 0.01Å closer than that in exo case). This in a way showed that the endo TS was more easily formed than exo TS as the presence of steric hindrance between ‘-CH2-CH2-‘ fragment in cyclohexa-1,3-diene and the maleic anhydride caused a slightly larger distance of the forming/breaking bonds.
Energy Analysis on Endo and Exo TS
The above table showed the energies of both endo TS and product were lower than those of exo TS and product, which means that the reaction leading to endo product was kinetically favourable (i.e. via lower energy endo TS) as well as thermodynamically favourable (i.e. launching on lower energy endo product). This is because exo TS and product had a significant steric repulsion between ‘-CH2-CH2-‘ fragment in cyclohexa-1,3-diene and the maleic anhydride which was absent in endo TS and products. Also in endo TS there was a stabilising secondary orbital interactions which were absent in exo TS due to the incorrect orientations of two reactants in exo approach (see more explanation about secondary orbital overlap effect in later section of MO Analysis on Endo and Exo TS).
IR analysis on Endo and Exo TS
The frequency calculation generated only one negative vibrational frequency in each case (see the diagram below in Fig 13), which firmly confirmed that the successfully optimised endo and exo TS were obtained.
 |
MO Analysis on Endo and Exo TS
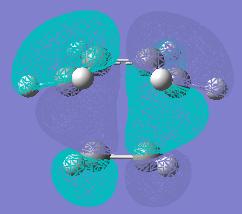
Finally, the MOs of both exo and endo TS were calculated using the optimised TS geometries through the path: opt+freq->TS (Berny)->calculate force constants once->pop=full->semi empirical->AM1->submit. The resulted HOMOs of both endo and exo TS were shown below in Fig 14:
 |
As the HOMOs in Fig 14 shows that the orientation of exo TS was not able to have the stabilising interaction of secondary orbital overlap effect, in contrast, endo TS had the right orientation which enabled the secondary orbital interactions between the π systems of -CH=CH- fragment in cyclohexa-1,3-diene and -C=O-CO-C=O- fragment in maleic anhydride. This potential overlap (i.e. secondary overlap) along with the steric hindrance in exo TS caused the HOMO energy being lower in endo TS than in exo TS. As an overall, this Diels Alder reaction primarily generated the kinetically favoured endo product via lower energy endo TS.
Reference
1. Brandon G. Rocque; Jason M. Gonzales; Henry F. Schaefer III. An analysis of the conformers of 1,5-hexadiene. MOLECULAR PHYSICS, 2002, VOL. 100, NO. 4, 441-446. DOI: 10.1080/00268970110081412. http://www.informaworld.com/smpp/content~db=all?content=10.1080/00268970110081412
2. Radii and Bond lengths: http://www.ccdc.cam.ac.uk/products/csd/radii/table.php4
3. Bond lengths and energies: http://www.science.uwaterloo.ca/~cchieh/cact/c120/bondel.html

