Rep:Mod:yr316
Study of NH3
NH3 molecule
Basic information
| Result | |
|---|---|
| Molecule | NH3 ammonia |
| Point group | C3V |
| N-H bond length | 1.10798 Å |
| H-N-H bond angle | 105.741 degree |
| Calculate Method | RB3LYP |
| Basis Set | 6-31G(d.p) |
| E(RB3LYP) | -56.55776873 a.u. |
| RMS Gradient Normal | 0.00000485 a.u. |
        Item               Value     Threshold  Converged?
 Maximum Force            0.000004     0.000450     YES
 RMS     Force            0.000004     0.000300     YES
 Maximum Displacement     0.000072     0.001800     YES
 RMS     Displacement     0.000035     0.001200     YES
test molecule |
The frequency analysis
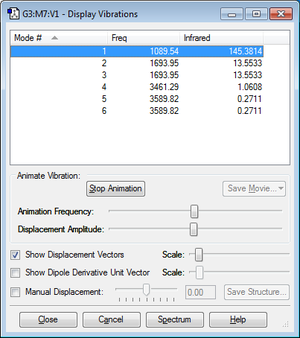
According to 3N-6 rule there are 3 vibrational modes.
From the picture above mode 2,3 are degenerate and 4,5,6 are degenerate.
1,2,3,are bending vibrations and 4,5,6 are stretching.
Mode 1 is a symmetric bend while mode 4 is a symmetric stretch.
2 bands are expected to see in a spectrum.
The two peaks should be found at 1700 cm-1 3600 cm-1. Due to mode 1 is completely symmetric and will result in a change of transitional dipole moment and therefore no peaks could be found at this frequency.
Charge Analysis
| atom | charge |
|---|---|
| N | -1.125 e |
| H | +0.375 e |
H2 molecule
Basic information
| Result | |
|---|---|
| Molecule | H2 hydrogen |
| Point group | D*H |
| H-H bond length | 0.74279 Å |
| Calculate Method | 105.741 degree |
| Calculate Method | RB3LYP |
| Basis Set | 6-31G(d.p) |
| E(RB3LYP) | -1.17853936 a.u. |
| RMS Gradient Normal | 0.00000017 a.u. |
         Item               Value     Threshold  Converged?
 Maximum Force            0.000000     0.000450     YES
 RMS     Force            0.000000     0.000300     YES
 Maximum Displacement     0.000000     0.001800     YES
 RMS     Displacement     0.000001     0.001200     YES
 Predicted change in Energy=-1.164080D-13
N2 molecule
Basic information
| Result | |
|---|---|
| Molecule | N2 nitrogen |
| Point group | D*H |
| Triple bond length | 0.74279 Å |
| Calculate Method | RB3LYP |
| Basis Set | 6-31G(d.p) |
| E(RB3LYP) | -109.52412868 a.u. |
| RMS Gradient Normal | 0.00000060 a.u. |
bond length = 0.74279 Å
Calculate Method = RB3LYP
Basis Set =6-31G(d.p)
E(RB3LYP)=-109.52412868 a.u.
RMS Gradient Normal = 0.00000060 a.u.
         Item               Value     Threshold  Converged?
 Maximum Force            0.000001     0.000450     YES
 RMS     Force            0.000001     0.000300     YES
 Maximum Displacement     0.000000     0.001800     YES
 RMS     Displacement     0.000000     0.001200     YES
 Predicted change in Energy=-3.401034D-13
Reaction Analysis
N2 + 3H2 -> 2NH3
E(NH3)=-56.55776873 a.u.
2*E(NH3)=-113.1155375 a.u.
E(N2)=-109.52412868 a.u
E(H2)=-1.17853936 a.u.
3*E(H2)=-3.53561808 a.u.
ΔE=2*E(NH3)-[E(N2)+3*E(H2)]=-0.005579074 a.u. =-146.478599028 kJ/mol
The energy change is smaller than zero. Therefore, the product is more stable.
Study of Methanal
basic information
| Result | |
|---|---|
| Molecule | HCHO methanal |
| Point group | CS |
| C-H bond length | 1.11057 Å |
| C=O bond length | 1.20676 Å |
| H-C-H bond angle | 115.219 degree |
| O=C-H bond angle | 122.395 degree |
| Calculate Method | RB3LYP |
| Basis Set | 6-31G(d.p) |
| E(RB3LYP) | -144.50319933 a.u. |
| RMS Gradient Normal | 0.00007386 a.u. |
         Item               Value     Threshold  Converged?
 Maximum Force            0.000197     0.000450     YES
 RMS     Force            0.000085     0.000300     YES
 Maximum Displacement     0.000270     0.001800     YES
 RMS     Displacement     0.000149     0.001200     YES
 Predicted change in Energy=-3.772186D-08
test molecule |
Frequency Analysis of Methanal
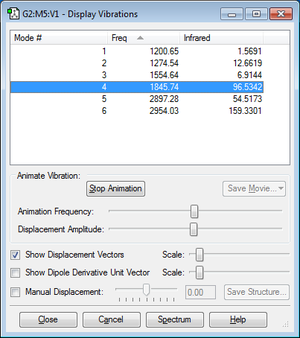
According to 3N-6 rule there are 6 vibrational modes
No modes are degenerate.
1,2,3,are bending vibrations C-H bonds. 4 is the C=O stretch along with C-H bend. 5,6 are the stretching of C-H bonds.
Mode 3 is a symmetric bend while mode 5 is a symmetric stretch.
6 bands are expected to see in a spectrum.
Molecular orbitals of methanal
To analyse the atomic orbital of HCHO needs to consider H-C-H as a whole group. The following are my interpretations according to the results obtained from Gaussview.
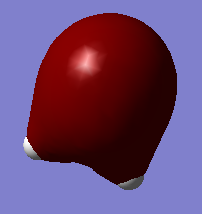
The 3σ molecular orbital of methanal. 2 electrons are filled in this orbital. This contributes to the single bond formed between carbon and oxygen.
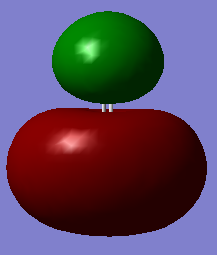
The 4σ* molecular orbital of methanal. 2 electrons are filled in this orbital. This cancels with the 3σ as a result these electrons does not contribute to the bonding between the carbon and oxygen.
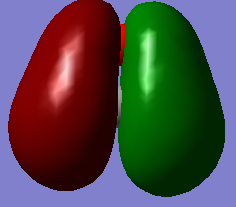
This picture shows the 1π orbital of methanal. 2 electrons are filled in this orbital. This contributes to the π-bond character with in the C=O bond. This also contributes to the single bond formed between carbon and oxygen.
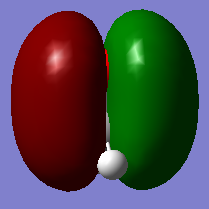
This picture shows the 2π orbital of methanal. 2 electrons are filled in this orbital.
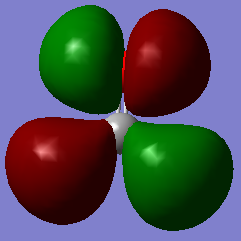
This picture shows the 3π* orbital of methanal. 2 electrons are filled in this orbital. The 3π orbital cancels with the 2π orbital and therefore the 2π orbital does not contribute to the bonding.
Charge analysis
| atom | charge |
|---|---|
| C | +0.221 e |
| H | +0.137 e |
| O | +0.494 e |
Comparison to literature and theoretical works
This part includes the comparison between my work and other literature works or other theoretical works. This is to either validate my results or back up my analysis and interpretation.
Vibrational and frequency analysis
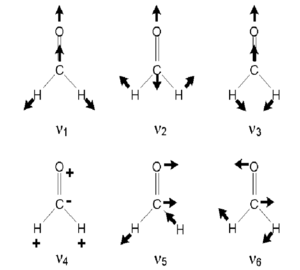
The figure "Vibrational modes of methanal" on the right shows the six vibrational modes of methanal molecule. It is identical to the modes that I have found using Gaussview only differing in the order is. As shown in the picture, v1 and v5 are C-H symmetric and asymmetric stretches. v2, v3 ,v4 and v5 represent the bending of C-bond. v2 also involves C-H stretching and therefore correspond to mode 4 in my research. While v4 and v6 involve the bending of C=O bond each in a different plane.
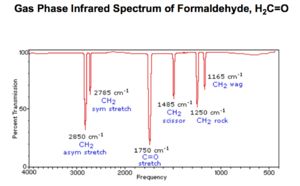
As shown in the figure "IR spectrum of methanal(1)" on the right, there are 6 peaks found on the IR spectrum of methanal which is obtained from another university's research. I compared the wavenumber from the figure to my research and constructed the following table:
| Mode # | My result (cm-1) | Literate value (cm-1) |
|---|---|---|
| 1 | 1200.65 | 1165 |
| 2 | 1274.54 | 1250 |
| 3 | 1554.64 | 1458 |
| 4 | 1845.74 | 1750 |
| 5 | 2897.28 | 2785 |
| 6 | 2954.03 | 2850 |
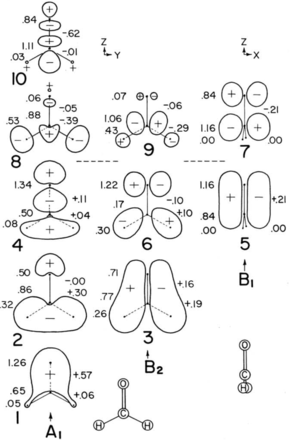
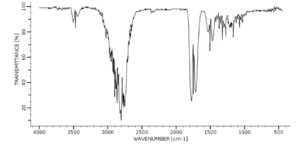
Figure "IR spectrum of methanal(2)" shows the IR spectroscopy of methanal done by another lab. No labels can be found on this spectrum. There are 7 peaks can be seen on the spectrum. The two peaks correspond to C-H symmetric and asymmetric stretches at 2800 cm-1 and the C=O stretch at 1750 cm-1 can be identified. This agrees with my research. The peaks between 1500 cm-1 and 1000 cm-1 are little bit hard to identify. The two small peaks at around 3500 cm-1 should be the first overtone of the C-H strecthing.
Further research done on molecular orbital of methanal
I found a work done by other chemist to see if my interpretation make sense. The figure on the right shows the illustrated molecular orbital of methanal presented by R.J.Olcott.[4]The molecular orbitals are arranged in the order of increasing energy labeled from number 1 to 10 and they are grouped by their symmetry. The 5 orbitals demonstrated in the last section correspond to number 1, 2, 3 ,5 and 6 respectively. Orbitals 1 to 6 are occupied by a pair of electrons while the rest are empty orbitals. They are (σCO)2(σCH)2(σ'CH)(nO)2(πCO)2(n'O)2. [4]This partially agrees with my interpretation. However, I do not quite understand how the (nO)2(n'O)2 works how are they non-bonding. I have interpreted them as π bonding and anti bonding orbitals.
References
- ↑ "Methanal." Senseair. N.p., 13 Sept. 2012. Web. 24 Feb. 2017. <http://www.senseair.com/senseair/gases-applications/methanal/>.
- ↑ "Infrared Spectroscopy." Infrared Spectroscopy. N.p., n.d. Web. 24 Feb. 2017. <https://www2.chemistry.msu.edu/faculty/reusch/virttxtjml/Spectrpy/InfraRed/infrared.htm>.
- ↑ Infrared spectral data from the Bio-Rad/Sadtler IR Data Collection was obtained from Bio-Rad Laboratories, Philadelphia, PA (US).
- ↑ 4.0 4.1 4.2 Orloff, M. K., and N. B. Colthup. "Illustrated molecular orbitals of formaldehyde." Journal of Chemical Education 50.6 (1973): 400-01. Web.
