
Rep:Mod:yi11
Year 3 Inorganic Computational Chemistry Lab 3S Part One
Optimisations of molecules
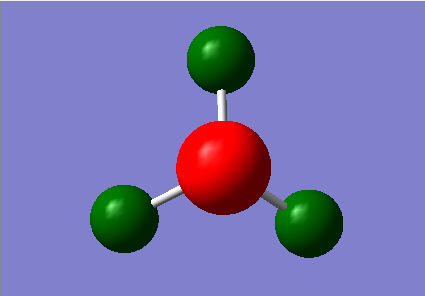
BH3
The 3-21G basis set was used to optimise borane which is linked here.
| File Name | bh3_opt | |
| File Type | .log | |
| Calculation Type | FOPT | |
| Calculation Method | RB3LYP | |
| Basis Set | 3-21G | |
| Charge | 0 | |
| Spin | Singlet | |
| E(RB3LYP) final energy | -26.46226433 | a.u. |
| RMS Gradient Norm | 0.00004507 | a.u. |
| Imaginary Frequency | ||
| Dipole Moment | 0.00 | Debye |
| Point Group | D3h |
| Geometrical Information | Value |
|---|---|
| BH Bond Length | 1.19 Å |
| HBH Bond Angle | 120 ° |
    Item               Value     Threshold  Converged?
 Maximum Force            0.000090     0.000450     YES
 RMS     Force            0.000059     0.000300     YES
 Maximum Displacement     0.000352     0.001800     YES
 RMS     Displacement     0.000230     0.001200     YES
 Predicted change in Energy=-4.580958D-08
 Optimization completed.
    -- Stationary point found.

The optimisation showed two 'intermediate' structures reflecting the small change.
Using the optimised molecule, this time the basis set was changed to 6-31G with extra d and p functions; noted as 6-31G (d,p) which is linked here.

         Item               Value     Threshold  Converged?
 Maximum Force            0.000009     0.000450     YES
 RMS     Force            0.000006     0.000300     YES
 Maximum Displacement     0.000038     0.001800     YES
 RMS     Displacement     0.000025     0.001200     YES
 Predicted change in Energy=-5.342731D-10
 Optimization completed.
    -- Stationary point found.
| Geometrical Information | Values |
|---|---|
| BH bond length | 1.19 Å |
| HBH bond angle | 120 ° |
| Basis Set | Energy /a.u. |
|---|---|
| 3-21G | -26.4623 |
| 6-31G (d,p) | -26.6153 |
GaBr3
Gallium tribromide was optimised using the LanL2DZ pseudo-potential. The results can be found here. DOI:10042/25217 .

         Item               Value     Threshold  Converged?
 Maximum Force            0.000000     0.000450     YES
 RMS     Force            0.000000     0.000300     YES
 Maximum Displacement     0.000003     0.001800     YES
 RMS     Displacement     0.000002     0.001200     YES
 Predicted change in Energy=-1.282692D-12
 Optimization completed.
    -- Stationary point found.
| Geometrical Information | Value | Literature |
|---|---|---|
| GaBr bond length | 2.35 Å | 2.3525 Å for Ga-Br diatomic[1] |
| BrGaBr bond angle | 120 ° |
BBr3
Boron tribromide was optimised using the GEN basis set and specifying 'pseudo=read gfinput' to the keywords. An input file was created to which 6-31G(d,p) basis set for boron and a LanL2DZ pseudo-potential for bromine was detailed. The results of the optimisation are found here. DOI:10042/25229 .

 Item               Value     Threshold  Converged?
 Maximum Force            0.000008     0.000450     YES
 RMS     Force            0.000005     0.000300     YES
 Maximum Displacement     0.000036     0.001800     YES
 RMS     Displacement     0.000023     0.001200     YES
 Predicted change in Energy=-4.027258D-10
 Optimization completed.
    -- Stationary point found.
| BBr bond length | 1.93 Å |
| BrBBr bond angle | 120 ° |
| Total Energy | -64.4365 a.u. |
Analysis
| Molecule | Bond | Value (Å) |
|---|---|---|
| BH3 | B-H | 1.19 |
| GaBr3 | Ga-Br | 2.35 |
| BBr3 | B-Br | 1.93 |
The B-H bond distance is the shortest at 1.19 Å with B-Br the next longest at 1.93 Å and Ga-Br the longest at 2.35 Å. Changing the ligand from H to Br has increased the bond distance by 0.7 Å due to the increased atomic size of bromine. Increasing the atomic size from row 1 to row 3 means orbital overlap between B and Br is not optimal as B is in row 1 of the periodic table so there is a weaker bond. In addition B an H are closer with respect to electronegativity whereas Br is more electronegative, withdrawing electrons towards it thus weakening the bond and lengthening it. As a consequence, BBr bond polarity is significant in BBr3 where electron density is accumulated towards the terminal Br atoms away from the central atom. Having said that, it is a lot shorter than expected (2.04 Å from the sum of covalent radii). This is due to π-donation of lone pairs on Br into the empty 2p orbital of sp2 B which shortens the bond and stabilises the electron deficient B. B and Ga are both in Group 13 however Ga3+ is highly polarisable.
Gaussview calculates molecular structures based on pre-defined distance criteria so if a bond is not visible, it may mean that the distance exceeds the value that it was set at initially. They are useful to visualise the connectivity and arrangement of atoms in a molecule but a bond is essentially a force of attraction that may lead to a more stable compound that can exist independently. That considered, Gaussview does not need to illustrate bonds every time.
Frequency Analysis
BH3
The results of the frequency analysis of borane are found here.
Low frequencies --- -3.6020 -1.1356 -0.0055 1.3734 9.7035 9.7697
Low frequencies --- 1162.9825 1213.1733 1213.1760
The types of manifested vibrations are summarised below.
| No. | Frequency (cm-1) | Form (Click image to view animation) | Intensity | Symmetry for DH3 point group |
|---|---|---|---|---|
| 1 | 1163 |  Wagging. All hydrogens move in unison vertically in the z-axis whilst theboron atom remains stationary. |
93 | A" |
| 2 | 1213 |  Scissoring. The central atom and one hydrogen atom remain stationarywhilst the bend away from the stationary hydrogen, maintaining the flat plane of the molecule. |
14 | E' |
| 3 | 1213 |  Rocking. Two hydrogen atoms bend towards each other whilst the third bends just in one direction. |
14 | E' |
| 4 | 2582 |  Symmetric stretching. All three hydrogen atoms stretch away from the central boron atom in the plane of the molecule. |
0 | A' |
| 5 | 2715 |  Asymmetric stretching. One hydrogen atom stretches away from the centre whilst another is stretched towards the centre, simultaneously. The third hydrogen remains stationary. |
126 | E' |
| 6 | 2716 |  Asymmetric and symmetric stretching. One hydrogen stretches out from the centre with the boron stretching in the same direction (B-H bond moves as one entity) whilst the other two hydrogen atoms stretch towards the central boron atom. |
126 | E' |

Above is the IR spectrum of BH3. There are three peaks at 1162 cm-1, 1213 cm-1 and 2715 cm-1 corresponding to no. 1, 2 or 3 and 5 or 6 respectively. No 5 is not observed as such stretching does not create a dipole moment in the molecule; it is totally symmetric so IR radiation is not absorbed, hence a peak is absent.
GaBr3
A frequency analysis of gallium tribromide was conducted for which the results can be found here. DOI:10042/25311 .
Low frequencies --- -0.5252 -0.5247 -0.0024 -0.0010 0.0235 1.2010
Low frequencies --- 76.3744 76.3753 99.6982
| No. | Frequency (cm-1) | Form (Click image to view animation) | Intensity | Symmetry for DH3 point group |
|---|---|---|---|---|
| 1 | 76 |  Rocking. A Br-Ga-Br entity moves as one group whilst the third bromine atom 'wags' in the opposit direction. |
3 | E' |
| 2 | 76 |  Scissoring. One bromine stretches out from the centre with the gallium stretching in the same direction (Ga-Br bond moves as one entity) whilst the other two bromine atoms stretch towards the central gallium atom. |
3 | E' |
| 3 | 100 |  Wagging. Central gallium atom moves vertically in the z-axis whilst the three bromine atoms move in unison in the z-axis but in the opposite direction. |
9 | A2" |
| 4 | 197 |  Symmetric stretching. All three bromine atoms stretch away from the central gallium atom in the plane of the molecule. |
0 | A1' |
| 5 | 316 |  Asymmetric stretching. One bromine atom and the central gallium atom stretch towards each other whilst another stretches away, simultaneously. The third bromine remains stationary. |
57 | E' |
| 6 | 316 |  Asymmetric and symmetric stretching. One bromine atom and the gallium atom stretch towards each other whilst the other two stretch away from the centre only slightly in comparison. |
57 | E' |

This shows the IR spectrum of gallium tribromide. There are three peaks at 76 cm-1, 100 cm-1 and 316 cm-1 corresponding to; No 1 and 2; 3; 5 and 6 respectively.
Comparison
| Symmetry label | BH3 | GaBr3 |
|---|---|---|
| A" | 1162.93 | - |
| E' | 1213.17 | 76.37 |
| E' | 1213.18 | 76.38 |
| A2" | - | 99.70 |
| A1' | - | 197.34 |
| A' | 2582.32 | - |
| E' | 2715.50 | 316.18 |
| E' | 2715.50 | 316.19 |
The lowest "real" normal mode is indicated by the second line of low frequencies list which indicate the lowest frequency at which an IR active mode is observed in the spectrum. The "Low frequencies" represent the -6 in 3N-6 vibrational frequencies of a molecule with N = no atoms in molecule and signify the subtle motions about the centre of mass. They should be within ±15 cm-1.
As the equation for molecular vibration ![]() shows, the frequencies of IR peaks are inversely proportional to reduced mass of the bond system. Therefore BH3 having a smaller mass will have frequencies at higher frequencies also suggesting the qualitative model that boron and hydrogen are small atoms meaning that their orbital overlap is optimal, creating shorter, stronger bonds so more energy is required to stretch the BH bond and peaks are observed at higher regions.
There is a reordering of modes in BH3 and GaBr3 due to the difference in mass that contribute to the bending motions. In BH3, the Hs are lighter so move parallel to the principle axis whilst in GaBr3 it is the ventral gallium atom that moves as it is lighter than Br. This is where the mode changes from No 1 to No 3.
These spectra are similar by the fact that there are three visible peaks; 2 pairs of degenerate modes giving two peaks, 2 individual peaks and one unobserved mode to its totally symmetric stretching nature so it is IR inactive. A1 and E' frequencies cluster at lower values due to bending motions requiring less energy and A2 and E' frequencies exist at high frequencies due to stretching motions
shows, the frequencies of IR peaks are inversely proportional to reduced mass of the bond system. Therefore BH3 having a smaller mass will have frequencies at higher frequencies also suggesting the qualitative model that boron and hydrogen are small atoms meaning that their orbital overlap is optimal, creating shorter, stronger bonds so more energy is required to stretch the BH bond and peaks are observed at higher regions.
There is a reordering of modes in BH3 and GaBr3 due to the difference in mass that contribute to the bending motions. In BH3, the Hs are lighter so move parallel to the principle axis whilst in GaBr3 it is the ventral gallium atom that moves as it is lighter than Br. This is where the mode changes from No 1 to No 3.
These spectra are similar by the fact that there are three visible peaks; 2 pairs of degenerate modes giving two peaks, 2 individual peaks and one unobserved mode to its totally symmetric stretching nature so it is IR inactive. A1 and E' frequencies cluster at lower values due to bending motions requiring less energy and A2 and E' frequencies exist at high frequencies due to stretching motions
It is vital that the same method and basis set for both the optimisation and frequency analysis calculations are used because any values for comparison will be invalid as they would have been calculated using different accuracy in measurements. It is like comparing distances of a journey measured in km and miles.
MO Analysis of BH3
The results of the energy calculation are found here DOI:10042/25350 . The molecular orbitals are shown in the MO diagram below:

Orbitals that are lower in energy are more representative to those predicted by LCAO whilst those higher in energy for example a1' anti-bonding and the two degenerate e' anti-bonding orbitals are slightly different in terms of the relative magnitudes of negative to positive areas of the MOs. From this, it suggests that LCAO theory is useful to make a qualitative anaysis of molecular orbitals; especially in prediction.
Analysis of NH3
Optimisation
Ammonia was optimised using the 6-31G(d,p) basis set for which the results are found here.

         Item               Value     Threshold  Converged?
 Maximum Force            0.000024     0.000450     YES
 RMS     Force            0.000012     0.000300     YES
 Maximum Displacement     0.000079     0.001800     YES
 RMS     Displacement     0.000053     0.001200     YES
 Predicted change in Energy=-1.629718D-09
 Optimization completed.
    -- Stationary point found.
Frequency Analysis
The results of the second frequency analysis can be found here.
Low frequencies --- -30.8045 0.0012 0.0012 0.0013 20.2188 28.2150
Low frequencies --- 1089.5530 1694.1235 1694.1861
MO Analysis
The results of the population analysis can be found here. DOI:10042/25354
Natural Bond Orbital (NBO) Analysis
The charge distribution in NH3 is identified from red to green with charge limits of -1.000 to +1.000 here.
| atom | charge |
|---|---|
| N | -1.125 |
| H | 0.375 |
Association energy of NH3BH3
Optimisation
Ammonia-borane was correctly created and optimised using the same method as above. The results are shown here. https://spectradspace.lib.imperial.ac.uk:8443/dspace/handle/10042/25375.

         Item                Value    Threshold  Converged?
 Maximum Force             0.000128    0.000450     YES
 RMS     Force             0.000057    0.000300     YES
 Maximum Displacement      0.000631    0.001800     YES
 RMS Displacement          0.000304    0.001200     YES
 Predicted change in Energy=-1.626467D-07
 Optimization completed.
   -- Stationary point found.
Frequency Analysis
The results of the analysis can be found here. DOI:10042/25377 .
Low frequencies --- -0.0006 0.0003 0.0003 18.4763 23.1317 41.3195
Low frequencies --- 266.3031 632.3364 639.4683
Determination of Association Energy
| Molecule | Energy (a.u.) |
|---|---|
| E(NH3) | -56.5578 |
| E(BH3) | -26.6153 |
| E(NH3BH3) | -83.2249 |
ΔE = E(NH3BH3)-[E(NH3)+ E(BH3)]

   = -83.2249 - (-56.558 + -26.6153)

   = -0.0510 a.u.
Association energy of NH3BH3 = -134 kJmol-1. This is more realistic as it has the same order of magnitude as an average bond energy. Therefore the dissociation energy is +134 kJmol-1 as it is the opposite reaction and requires an input of energy for bond cleavage.