Rep:Mod:yh1710
Optimisation of a Molecule
BH3 - B3LYP, 3-21G optimisation
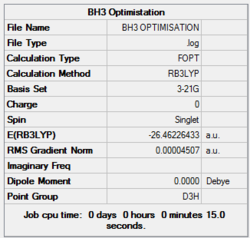
Initially, a minimal basis set (3-21G) was chosen along with a DFT method and B3LYP hybrid functional. Results from log file and Gaussview summary provided below:
Item Table
        Item               Value     Threshold  Converged?
 Maximum Force            0.000413     0.000450     YES
 RMS     Force            0.000271     0.000300     YES
 Maximum Displacement     0.001610     0.001800     YES
 RMS     Displacement     0.001054     0.001200     YES
 Predicted change in Energy=-1.071764D-06
Data indicates that the optimisation has been completed where all values have successfully converged – the value for “RMS Gradient Norm” is less than 0.001.
B-H bond distance: 1.19 Å
H-B-H bond angle: 120.0˚ (D3 symmetry group, trigonal planar)
These values agree with those quoted in literature: 1.19 Å and 120˚ [1] respectively
BH3 - B3LYP, 6-31G d,p optimisation
To investigate different parameters of optimisation, a higher level basis set (6-31G d,p) was used in conjunction with the DFT and B3LYP method from the previous calculation.
Results from the log file were saved, and the Gaussview summary is presented below:
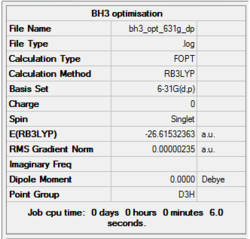
Item Table
Item               Value     Threshold  Converged?
 Maximum Force            0.000005     0.000450     YES
 RMS     Force            0.000003     0.000300     YES
 Maximum Displacement     0.000019     0.001800     YES
 RMS     Displacement     0.000012     0.001200     YES
 Predicted change in Energy=-1.304899D-10
The data indicates that the forces and placements have converged suggesting the completion of the optimization - the value for “RMS Gradient Norm” is less than 0.001.
From this point forward, the completion of the optimisation/calculation will not be commented on, but the convergence table should be used as an indicator for this.
B-H bond distance: 1.19 Å
H-B-H bond angle: 120.0˚ (D3 symmetry group, trigonal planar)
Comparison of two optimisation methods
Total energy of 3-21G optimised BH3: -26.46226433 a.u.
Total energy of 6-31G (d,p) optimised BH3: -26.61532363 a.u.
TlBr3 - optimisations using pseudo-potentials (LanL2DZ)
Most of chemistry is based on the assumption that it is really the valence electrons that dominate in bonding interactions, and so we can safely model the core electrons of an atom by a special function called a pseudo-potential (PP). The pseudo-potential is useful in the case where the atoms are large, making these assumptions will save time in calculations (well documented that PP is accurate and does not affect the results significantly for heavy atoms.
Thus an optimisation using PP was performed on TlBr3 with a point group restriction (D3h 0.001 - very tight) with the LANL2DZ basis set and B3LYP hybrid functional. The calculation was submitted to the HPC server instead of Gaussian.
The log file was saved and the summary of the optimisation is presented below:

Item Table
Item               Value     Threshold  Converged?
 Maximum Force            0.000002     0.000450     YES
 RMS     Force            0.000001     0.000300     YES
 Maximum Displacement     0.000022     0.001800     YES
 RMS     Displacement     0.000014     0.001200     YES
 Predicted change in Energy=-6.084011D-11
Tl-Br bond distance: 2.65 Å
Br-Tl-Br bond angle: 120.0 (D3 symmetry group, trigonal planar)
These values agree with those quoted in literature: 2.52 Å[2] and 120[3] respectively
The optimisation was published onto D-Space which the following link will be directed to: DOI:10042/23335
BBr3 - optimisation using a mixture of basis sets and pseudo potentials
When compunds contain both heavy atoms which require a pseudo-potential, and light atoms, which are treated more accurately with a full basis set we need to be able to mix pseudo-potentials and basis sets. Thus for the optimisation of BBr3, this very mix of PPs and full basis sets was accounted for.
The calculation was performed with the method set to GEN which allows the option to specify basis sets for each individual atom, and thus an additional keyword ("pseudo=gfinput")was inserted and the following was added to the text file before submission of calculation to HPC:
B 0
6-31G(d,p)
****
Br 0
LanL2DZ
****

Br 0
LanL2DZ
The log file was saved and the summary received from Gaussian is presented below:
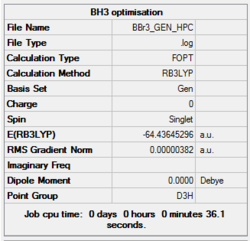
Item Table
Item               Value     Threshold  Converged?
 Maximum Force            0.000008     0.000450     YES
 RMS     Force            0.000005     0.000300     YES
 Maximum Displacement     0.000036     0.001800     YES
 RMS     Displacement     0.000023     0.001200     YES
 Predicted change in Energy=-4.026910D-10
The published file to D-Space is given in the following link: DOI:10042/23336
Comparison of bond distances
Having carried out a series of calculations and optimizations, it is worth comparing the results obtained, particularly the bond lengths as it is the value with the largest degree of variance (understandably). The following table lists the bond length of the three molecules that were investigated:
| Molecule | Bond Lengths, Å |
|---|---|
| BH3 | 1.19 |
| BBr3 | 1.93 |
| TlBr3 | 2.65 |
By comparing the differences in bond length, some conclusions can be drawn regarding the effect of the substituents on the bond length.
A key difference between the substituents Br and H, is their size. As a relatively large atom, the valence orbital in bromine (4p) will be large and very diffuse, which hinders the effectiveness of its electronic interaction (poor overlap) with the boron atom. Another difference worth considering is electronegativity. Bromine has a Pauling electronegativity of 2.74 compared to 2.1 for hydrogen. A value of 2.01[4] for the boron atom suggest that in terms of electronegativity B and H are a lot more well-matched and results in a higher stabilisation energy and thus shorter bond length.
The same analysis can be conducted for TlBr3 and BBr3, in this case determining the effect of changing the central atom on the bond length The same argument as above can be used where Thallium, with its valence 6p orbitals is a lot larger in terms of electronic size in comparison to boron and will be very diffuse with a low electron density. This, as expected, results in a very poor orbital overlap between Tl and Br thus explaining the long bond distance of Tl-Br compared to B-Br.
Bonding in Gaussview
A bond represents the attractive interaction between two or more atoms. It is not necessarily simple force but a combined effect. For example, a bond strength can be affected by the repulsion of nuclei or the attraction between the oppositely charged ions. Thus in some specific cases, Gaussview may not display bonds where they are expected to be. This is a result of the fact that Gaussview is primarily accustomed to bond lengths in organic molecules. Thus when a calculated bond length is longer than that would be usually expected, a bond is not drawn. However, it does not mean that there is no interaction between the atoms, just too weak to be considered as a significant bond.
Frequency Analysis
When we carry out a frequency or vibrational analysis we are doing two things at once. The frequency analysis is essentially the second derivative of the potential energy surface, if the frequencies are all positive then we have a minimum, if one of them is negative we have a transition state. The frequency analysis has another important role to play because it provides the IR and Raman modes to compare with experiment.Thus in this section we will explore the frequency analysis of different molecules to determine their individual IR modes.
BH3 vibrational analysis
The first molecule we will investigate is BH3 again due to its simplicity and size. Thus the frequency analysis of BH3 was performed with the method employed in the previous optimisation of the molecule (DFT, B3LYP, 6-31G (d,p)).
The frequency analysis was performed successfully, and the summary obtained from Gaussian is presented below. It is worth noting that the energy that was calculated is the same value as the previous optimisation calculation, suggesting that the same structure was indeed obtained.
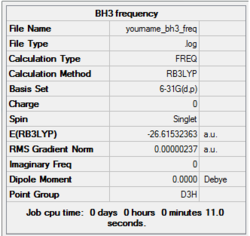
Item Table
Item               Value     Threshold  Converged?
 Maximum Force            0.000005     0.000450     YES
 RMS     Force            0.000002     0.000300     YES
 Maximum Displacement     0.000019     0.001800     YES
 RMS     Displacement     0.000009     0.001200     YES
 Predicted change in Energy=-1.323374D-10
 Low frequencies ---   -0.9033   -0.7343   -0.0054    6.7375   12.2491   12.2824
 Low frequencies --- 1163.0003 1213.1853 1213.1880
The six vibrational modes (3N-6) are indicated in the "Low frequencies". The better the method employed, the closer to zero the six frequencies will be. However any values smaller than +/- 15 cm-1 are acceptable, and so the method employed is suitable. The vibrations were animated in GaussView and are presented in the table below along with their frequencies, point group and a brief description of the vibrational mode.
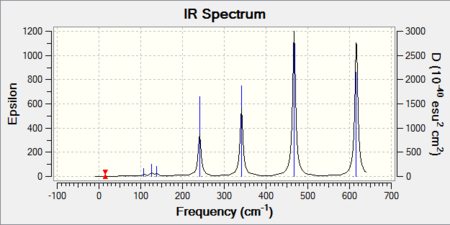
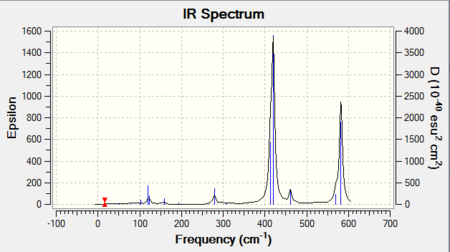
The frequency analysis also yields an infrared spectrum which is presented below in Figure 6. However it can be seen that the spectrum only accounts for three peaks despite there clearly being 6 vibrational modes. There are two reasons for this. Firstly it is because the symmetric stretches are IR inactive as the pre-requisite for IR activity is that vibrations result in a change of dipole. Thus the symmetric A1' mode is IR silent and does not appear in the spectrum. Secondly the E' vibrations at 1213 cm-1 and 2715 cm-1 respectively are degenerate and as seen from the table possess the same frequency. Thus out of the four bands, only two will be present in the spectrum.

TlBr3 vibrational analysis
A frequency analysis of the TlBr3 was also conducted to confirm that the optimisation of the molecule is at a minimum. The same procedure was applied to the TlBr3 as the BH3 but performed using the same method as the optimised structure (DFT, LanL2DZ, 6-31G (d,p)). The GaussView summary is provided below:
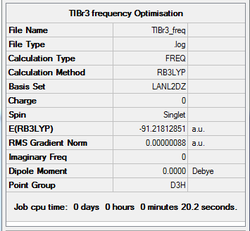
Item               Value     Threshold  Converged?
 Maximum Force            0.000002     0.000450     YES
 RMS     Force            0.000001     0.000300     YES
 Maximum Displacement     0.000022     0.001800     YES
 RMS     Displacement     0.000011     0.001200     YES
 Predicted change in Energy=-5.660901D-11
The file was submitted to HPC and published to D-Space, which the following link directs to: DOI:10042/23387
Low frequencies ---   -3.4213   -0.0026   -0.0004    0.0015    3.9367    3.9367
 Low frequencies ---   46.4289   46.4292   52.1449
Again the "Low frequencies" were obtained and it can be seen that the analysis method was suitable with frequencies close to zero. Note that the lowest "real" normal mode occurs at 46.4289 cm-1. The table below presents the vibrational modes (3N-6) along with their respective frequencies, intensities, point groups and a brief description of the vibrational motions.
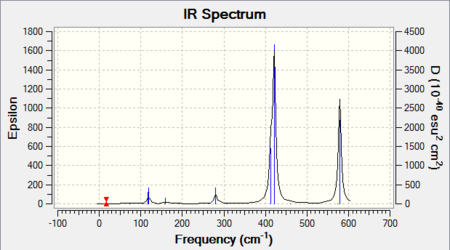
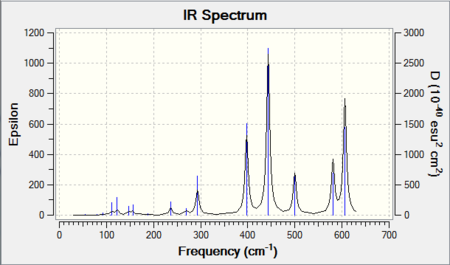
IR spectrum presented below:
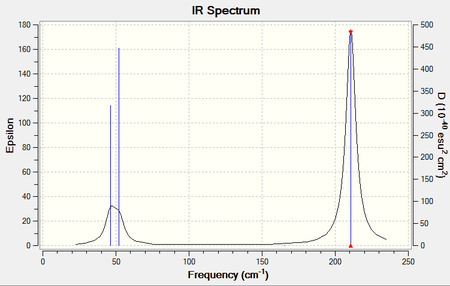
A summary of the vibrational frequencies considered is presented in the table below:
| TlBr3 frequency / cm-1 | BH3 frequency / cm-1 |
|---|---|
| 46 | 1163 |
| 46 | 1213 |
| 52 | 1213 |
| 165 | 2582 |
| 211 | 2715 |
| 211 | 2715 |
Numerically, the frequency values of BH3 are significantly larger than that of TlBr3. This can easily be rationalised as the vibrational frequency of bonds directly relate to their bond strength, and as discussed earlier the Tl-Br bond strength is much weaker than the B-Br which supports the calculations obtained.
The order of vibrational modes in the two molecules is also slightly different. In BH3, the order is A2’, E', E', A1', E', E', whereas in TlBr3, it is E',E', A2’, A1' E', E'. Both however exhibit six modes, consistent with the isostructural relationship of the two molecules. Similarly, in the spectra of the two molecules, both present three vibrational peaks.
A trend that can be seen is the closeness of two different sets of modes, the A2’ and E’ modes and the A1’ and E’ modes. This is perhaps a sign of vibronic coupling between modes of vibration in both molecules. A prerequisite for strong coupling interactions in polyatomic systems is that the two vibrational modes that couple should possess a common atom or bond. In the trigonal planar arrangement, this is easily fulfilled – hence the closeness of the pairs of modes. Thus, modes at higher energy may be a result of coupling interactions experienced by the pair at lower energy.
The same methods and basis sets must be used despite two separate molecules being analysed. This is because using the same methods and basis sets will apply the same parameters and the same approximations (this includes errors as well). This way even if there are some weaknesses in the calculations, the limitations/errors will be the same for both molecules, so comparison is more reliable and valid. Different methods and basis sets would mean that the calculation would be done differently, with different level of accuracy and the error. Hence, it is important to ensure that all the analysis are made based on same set-up, to ensure that the answers would have similar level of accuracy and the error would be similar.
A frequency analysis enables us to ensure that the optimisation was done correctly. For the optimisation to be successful, it has to be either a highest point/peak or a lowest point/trough. This is carried out by taking the first and second derivatives. At any stationary point, the first derivative should be close to 0. The frequency analysis test the second derivative. If all second derivative are positive, a minimum is obtained. If one negative value is obtained, then a maximum is obtained. Thus by checking with frequency analysis, one can ensure that the calculation was done correctly.
Population analysis
Molecular orbitals of BH3
One of the very useful aspects of carrying out calculations is that the electronic structure is solved and we obtain the MOs. These are the quantitative or computed MOs which we can compare to the qualitative or approximate MOs produced via MO diagrams. By selecting "Energy" as the method, typing in the additional keyword "pop=full" and selecting "Full NBO" the MO analysis is switched on, and depiction of the molecular orbitals of BH3 can be obtained.
The energy calculation was performed using the previously optimised structure (DFT, B3LYP, 6-31G (d,p)) and the log file was obtained and saved. In addition the GaussView summary is provided in the image below:
The file was submitted to HPC and the published in D-Space (DOI:10042/23386 )
The MO diagram constructed using the LCAO method is presented in Figure 10. Computed visualisations of the MOs are also included alongside the theoretical model. It can be seen from Figure 10 that there are no significant differences between the "real" MOs and the LCAO MOs, thus validating qualitative MO theory as an accurate tool in modelling the molecular framework of simple molecules.

NBO analysis
In quantum chemistry, a natural bond orbital or NBO is a calculated bonding orbital with maximum electron density. NBO methodology is based intrinsically on the quantum wavefunction W and its practical evaluation by modern computational methods. Unlike conventional valence bond (VB) or molecular orbital (MO)viewpoints, NBO theory makes no assumptions about the mathematical form of W. Instead, the NBO bonding picture is derived from variational, perturbative, or density functional theoretic (DFT) approximations of arbitrary form and accuracy, up to and including the exact W.[5]
NH3 optimisation practice
To implement the concept of NBO in computational chemistry, the NBO analysis was performed on NH3. The same basis set was used as for the higher level BH3 calculation (DFT, B3LYP, 6-31G (d,p)). Because this molecule is so small we can in-fact go straight to the high level basis set. The additional keyword "nosymm" was added.
The log file of the optimisation was saved, and the GaussView summary of the optimisation is provided below:

Item               Value     Threshold  Converged?
 Maximum Force            0.000024     0.000450     YES
 RMS     Force            0.000012     0.000300     YES
 Maximum Displacement     0.000079     0.001800     YES
 RMS     Displacement     0.000053     0.001200     YES
 Predicted change in Energy=-1.629727D-09
Frequency analysis
Having successfully performed an optimisation of the NH3 (where all forces have converged) the frequency analysis was conducted to ensure a minimum was obtained.
The log file was saved and the GaussView summary is presented below:

Item               Value     Threshold  Converged?
 Maximum Force            0.000022     0.000450     YES
 RMS     Force            0.000009     0.000300     YES
 Maximum Displacement     0.000078     0.001800     YES
 RMS     Displacement     0.000039     0.001200     YES
 Predicted change in Energy=-1.621683D-09
Low frequencies ---  -30.7013   -0.0011    0.0008    0.0012   20.2662   28.2997
 Low frequencies --- 1089.5562 1694.1246 1694.1863
The minimum was obtained and the low frequencies are presented above. Note that two of the frequencies exceed 15cm-1. Although this is not ideal, the deviation was determined to be acceptable for further calculations.
Population analysis
The energy calculation was performed using the previously optimised structure (DFT, B3LYP, 6-31G (d,p)), in order to obtain the NBOs in the next section.
The log file was saved and the GaussView summary is provided below:

NBO analysis of NH3
Now we are going to carry out a "Natural Bond Orbital Analysis", both inside Gaussview and in the log file from Gaussian.Initially the NBO was visualised where the atoms were coloured by charge.
The charge range is between -1.000 and 1.000


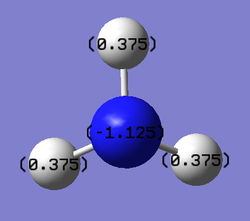
NBO charge on nitrogen: -1.125
NBO charge on hydrogen: 0.375
The NBO analysis gives much more information than the "atomic charges", however GaussView only provides a graphical interface for viewing specific information, it is not sophisticated enough to deal with the NBO analysis. Thus to extract crucial information in NBO analysis one must look in the log file and thus obtain information regarding bond orbital/coefficents/hybrids, the Second Order Perturbation Theory Analysis of Fock Matrix in NBO Basis and most importantly, a summary of the natural bond orbitals (energy and population or occupation of the N-H bonds, and the nitrogen lone pair)
NH3BH3 Analysis
Ammonia borane NH3BH3 is an interesting compound worth investigating. Its high hydrogen content which may allow it to serve as an alternative for hydrogen storage as it is a stable solid at r.t. eliminating the need for high pressure storage tanks. More importantly in the case of this project, it is an acid-base complex and thus determining the energy between the N-B bond may shed light on the dative bonding seen in Lewis acid-base pairs.
To compute a reaction energy, which in this case is the dative bond energy, we need the energy of the reactants and products.As we have already performed calculations on the two reactants, we will focus on completing calculations on the product.
3-21g optimisation
Initially, a minimal basis set (3-21G) was chosen along with a DFT method and B3LYP hybrid functional.
The log file was saved and the Gaussview summary is provided below:
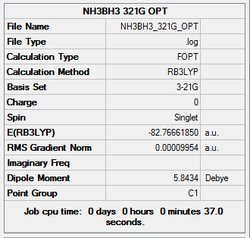
Item               Value     Threshold  Converged?
 Maximum Force            0.000185     0.000450     YES
 RMS     Force            0.000075     0.000300     YES
 Maximum Displacement     0.001140     0.001800     YES
 RMS     Displacement     0.000344     0.001200     YES
 Predicted change in Energy=-3.375293D-07
6-31g (d,p) optimisation
Next, a higher level basis set (6-31G, (d,p)) was chosen along with a DFT method and B3LYP hybrid functional.
The log file was saved and the Gaussview summary is provided below:
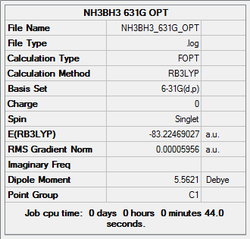
Item               Value     Threshold  Converged?
 Maximum Force            0.000143     0.000450     YES
 RMS     Force            0.000038     0.000300     YES
 Maximum Displacement     0.001016     0.001800     YES
 RMS     Displacement     0.000222     0.001200     YES
 Predicted change in Energy=-1.148584D-07
Frequency analysis
A further frequency analysis was performed using the previously optimised structure (DFT, B3LYP, 6-31G (d,p))
The log file was saved, and the Gaussview summary is provided below:
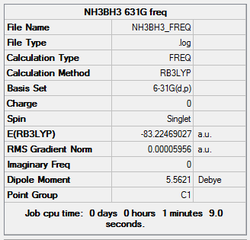
Item               Value     Threshold  Converged?
 Maximum Force            0.000271     0.000450     YES
 RMS     Force            0.000060     0.000300     YES
 Maximum Displacement     0.001492     0.001800     YES
 RMS     Displacement     0.000378     0.001200     YES
 Predicted change in Energy=-2.217937D-07
 Low frequencies ---   -9.2622    0.0007    0.0008    0.0010   19.3386   19.5577
 Low frequencies ---  263.2748  631.1791  638.5342
Determination of the Dissociation Energy
Summary of the energies calculated from optimised structures:
E(NH3)= -55.55776856a.u.
E(BH3)= -26.61532374a.u.
E(NH3BH3)= -83.22468993 a.u.
Dissociation for NH3BH3 adduct is the difference between the energy of a molecule of
NH3BH3 and the sum of the energies of its components (NH3 and BH3). The result was converted from atomic units (a.u.) to kJ/mol via the conversion ratio of 2625.50.
Edissociation = E(NH3BH3) - E(NH3 + BH3)
Edissociation = (-83.22468993)-[(-56.55776856)+(-26.61532374)] = -0.05159763 a.u.
Edissociation = -135.4 kJ/mol
Mini-Project - Lewis Acids and Bases
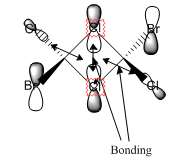
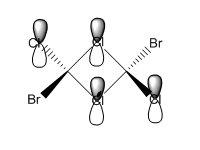
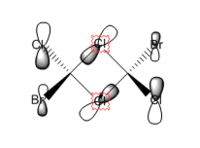
AlClBr2 is a strong Lewis acid. However it shows a strong tendency to aggregate and form dimers (Al2Cl2Br4) as it is common for heavier main group halides to exist as aggregates larger than implied by their empirical formulae. The halide bridge in the dimer can either be formed via the Cl atoms or Br atoms, and this yields interesting observations in terms of characterisation. In this section we will investigate the different isomers (conformers) of Al2Cl2Br4 as well as their vibrations and MOs.
Conformers of Al2Cl2Br4
The dimer molecule Al2Cl2Br4 can take 4 possible isomers with different symmetries. This section will focus on optimising the four isomers and comparing their energies relative to each other to determine the lowest energy conformer.
Optimisation and Frequency Calculations
As the dimer contains both light and heavy atoms, it is necessary to combine full basis set and pseudo-potential calculations. Thus all optimisation and frequency calculations were carried out using B3LYP functional and 6-31G (d,p) basis set for Al and Cl atoms (light), and LANL2DZ pseudo-potential was used for Br atoms. This was done by selecting "GEN" as the method and editing the text file to contain the following segment:
Title Card Required

0 1
 B                  0.00000000    0.00000000    0.00000000
 Br                 0.00000000    2.02000000    0.00000000
 Br                 1.74937123   -1.01000016    0.00000000
 Br                -1.74937123   -1.01000016    0.00000000

 1 2 1.0 3 1.0 4 1.0
 2
 3
 4

Al 0
6-31G(d,p)
****
Cl 0
6-31G(d,p)
****
Br 0
LanL2DZ
****

Br 0
LanL2DZ
Due to the size of the molecule, the files were submitted to the HPC for faster calculation. The log file of isomer 1, isomer 2, isomer 3, isomer 4 were saved, and a table of summary of the results from Gaussview are provided below. Furthermore the frequency analysis log files were saved 1,2,3 and 4 and the low frequencies were shown to ensure that the minimum was obtained.


