Rep:Mod:xl98149814
Thermal expansion of MgO
Abstract
In this experiment, the thermal expansion of the lattice structure MgO was computed by two methods: the Quasi-harmonic approximation and the Molecular Dynamics. The experiment was done over the temperature range 0k-1000K in steps of 100K and the grid size used was 32x32x32. The Molecular dynamics method works better at high temperture and the quasi-harmonic approximation works better at low temperature. The molecular dynamics method agrees better with the literature.
Introduction
Magnesium Oxide has a lot of refractory and electrical applications. It has good refractoriness, high thermal conductivity and low electrical conductivity.[1]Because of these properties,MgO can be used to investigate the thermal expansions of crystals.
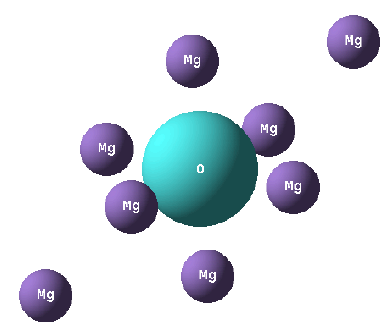
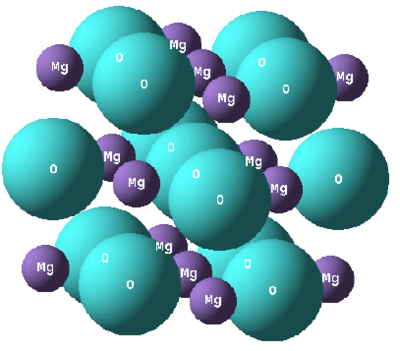
The fcc MgO system is assumed to have perfect crystal structure. MgO can be represented by two kinds of cell: the primitive cell which is the smallest cell which contains only one lattice point. The whole crystal of MgO could be built up by the repetitive arrangement of the smallest primitive unit cell; The conventional unit cell which is a cube with edge length with lattice parameter a and it contains 4 lattice points with 8x lattice points at the corners and 6x lattice points at the faces.[2].
 |
 |
The aim of this exercise is to investigate the thermal expansion property of MgO. DLVisualize which is a graphical interface used to visualize materials' structures and properties, can use GULP on the linux system to do the classical simulation which is the Quasi-harmonic approximation, as well as the molecular dynamics. The thermal expansion simulation was carried out over the temperature range 0K to 1000K. The optimal grid size was found by simulating the density of states at different grid sizes and was found out to be 32x32x32. A smaller grid size will be inaccurate while a larger grid size will be time-consuming. The thermal expansion coefficient could be found by plotting the cell volume against temperature. The primitive cell was simulated by the quasi-harmonic approximation. The conventional cell which has 32 MgO units was simulated by Molecular Dynamics as it has larger system.
Results and Discussion
Phonon dispersion and Density of States
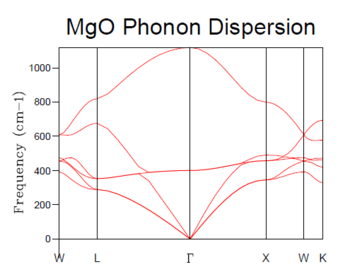
The phonon dispersion graph show 6 branches as there are 2 atoms per MgO molecule in 3 dimensions.
| Fig.4: MgO phonon Density of States with different grid sizes | |||||||
|---|---|---|---|---|---|---|---|
| 1x1x1 | 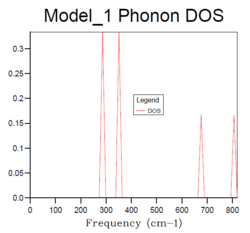 |
2x2x2 | 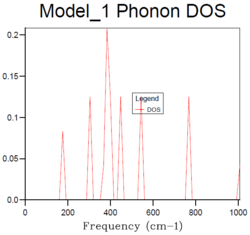 |
4x4x4 | 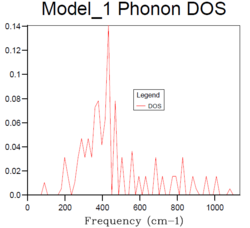 |
8x8x8 | 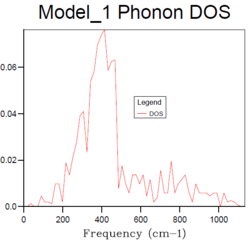 |
| 16x16x16 |  |
32x32x32 | 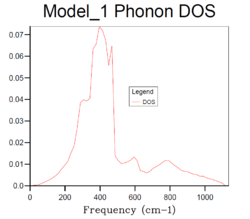 |
64x64x64 | 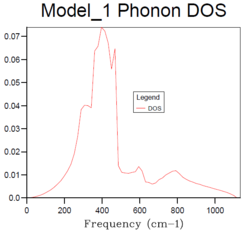 | ||
For the density of states of 1x1x1 grid, the k-point is the symmetry point L which is (,,). In the density of states graph of 1x1x1 grid, the intensity of the two lower frequency peaks (290 cm-1 and 350 cm-1) are twice as large as the intensity of the two higher frequency peaks (680 cm-1 and 810 cm-1). From the dispersion curve, it can be seen that the symmetry point L contains exactly the same frequencies and the two lower frequency numbers (290 cm-1 and 350 cm-1) are doubly degenerate, which matches the intensity of the peaks in the DOS graph. This gives the same information as the DOS graph.
The density of states increases with grid size as more k points are used to calculate the DOS. From Fig.4, it can be seen that there are only a few sharp peaks on the DOS graphs of 1x1x1, 2x2x2 and 4x4x4 grid sizes. This means only few frequencies are covered. As the grid size increases, more k-points in the reciprocal space are used to calculate the DOS, thus more frequencies are covered and overlap. This leads to a smoother DOS curve. The denser the grid, the smoother the DOS curve as more atoms are used in the calculation so more details are given. Therefore larger grid size can include more frequencies and thus give more accurate representation. From Fig.4, it can be seen that grid size 32x32x32 and 64x64x64 generate similar DOS curves. However, A grid size of 64x64x64 is very time consuming. Therefore the grid size 32x32x32 should be the minimum for a reasonable approximation to the density of states.
The optimal grid size 32x32x32 can be used for CaO as CaO has similar structure with MgO. Faujasite has covalent bonding in its structure, therefore it has a larger cell than MgO. According to Equation 2, a smaller grid size should be used in the reciprocal space. As for a metal such as lithium, it has metallic bonding in its structure, therefore it has a smaller cell than MgO, thus a larger grid size should be used.
Equation 2
| Grid size | Helmholtz Free Energy/ eV | ΔA/ meV (compared with free energy of 64x64x64) |
|---|---|---|
| 1x1x1 | -40.930301 | -3.818 |
| 2x2x2 | -40.926609 | -0.126 |
| 4x4x4 | -40.92645 | 0.033 |
| 8x8x8 | -40.926478 | 0.005 |
| 16x16x16 | -40.926482 | 0.001 |
| 32x32x32 | -40.926483 | 0.000 |
| 64x64x64 | -40.926483 | 0.000 |
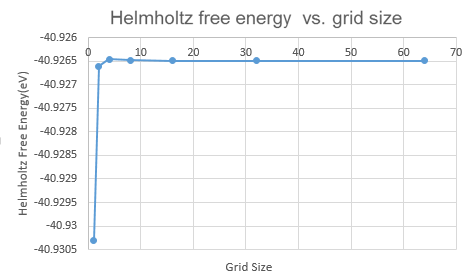
Fig.5 shows that the Helmholtz Free Energy increases with grid size. This is because larger grid size means more k-points are taken to calculate the free energy and more accuracy is obtained. The Helmholtz Free Energy becomes stable from grid size 32x32x32. This further proves that 32x32x32 is the optimal grid size. From table 1, it is shown that grid size 2x2x2 is appropriate for a calculation accurate to 1 and 0.5 meV. Grid size 4x4x4 is appropriate for a calculation accurate to 0.1 meV.
The Thermal Expansion of MgO
| Temperature/ K | Helmholtz free energy/ eV | Lattice constant/ Š| Cell Volume/ ų |
|---|---|---|---|
| 0 | -40.90190629 | 2.986563 | 18.836496 |
| 100 | -40.90241969 | 2.986563 | 18.838266 |
| 200 | -40.90937745 | 2.987604 | 18.856201 |
| 300 | -40.92812483 | 2.98939 | 18.890025 |
| 400 | -40.95859432 | 2.991629 | 18.932506 |
| 500 | -40.99943614 | 2.994134 | 18.98011 |
| 600 | -41.04931565 | 2.99682 | 19.031221 |
| 700 | -41.1071195 | 2.999643 | 19.085056 |
| 800 | -41.17189216 | 3.002587 | 19.141316 |
| 900 | -41.24301846 | 3.005634 | 19.199638 |
| 1000 | -41.31984872 | 3.008783 | 19.260042 |
 |
 |
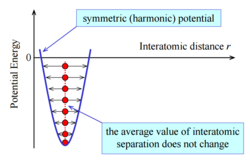
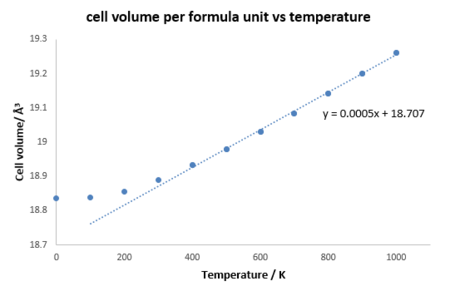
Quasi-harmonic approximation is a phonon-based model that describes volume-dependent thermal expansion.[4] At T=0K, the interatomic potential is harmonic and the average value of interatomic distance does not change. As temperature increases, the average amplitude of atomic vibrations also increases. This results in the increase of the average value of interatomic distance. In order to investigate the thermal expansion of MgO, the Helmholtz free energy, cell volume and lattice parameters were recorded from 0K to 1000K in steps of 100K (Table 2).
 |
 |
 |
Equation 3
Where U is the internal lattice energy,
T is the absolute temperature,
V is the volume,
S is the entropy due to the vibrational degrees of freedom.[5]
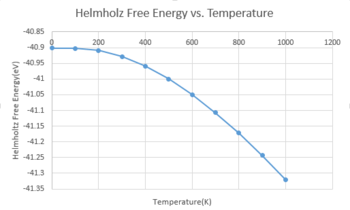
From fig.8, it can be seen that the free energy decreases with increasing temperature. This can be explained by equation3. As temperature increases, the entropy which represents the degree of disorder also increases. This makes the TS term more positive, therefore makes the free energy more negative. From fig.9 and fig.10 , the lattice constant and the cell volume increase with increasing temperature. As temperature increases, the kinetic energy of the phonons also increases, thus the crystal lattice vibrate at larger amplitude, which causes an increase in the potential energy. The equilibrium distance shifts to larger value as the repulsion force at short distance is greater than the attraction force at longer distance, which leads to the increase lattice vibrations. Therefore, thermal expansion happens. Therefore, the cell volume and the lattice parameter increase. However, in a diatomic molecule with exactly harmonic potential, the interatomic distance does not change with temperature, thus there is no thermal expansion.[6]
Equation 4
Where V is the initial volume of the cell,
is the gradient of the cell volume vs. temperature graph.
All three curves seem to be parabolic. From 300K to 1000K in the graph of the cell volume against temperature, the linear relationship follows the Quasi-harmonic approximation. The first three points were not included as they did not show the linear relationship. From fig , the gradient of the straight line, , is 0.0004. From equation 4, by dividing the gradient by the initial volume which is 18.8365 ų, the thermal expansion coefficient is 2.124x10⁻⁵ K-1. This is smaller than the literature value 4x10⁻⁵K-1 at 300K[7].
As the temperature approaches the melting point of MgO, the phonon modes do not represent the actual motions of the ions. This is because the bonds will break at the melting point and the crystal structure will no longer be perfect. Thus this does not follow the Quasi-harmonic approximation. Therefore, the quasi-harmonic approximation cannot be used at high temperature.
Molecular Dynamics
 |
 |
The molecular dynamics method is used for a supercell having 32 MgO units. This method simulates how atoms move in real life and uses Newton's second law to determine how forces affect the motions of the atoms. The size of the cell needs to be large enough to insure that the atoms vibrate freely.[8] The same grid size 32x32x32 was used. By dividing the last averaged volume at each temperature range by 32 which is the number of MgO units in the supercell, the cell volume can be found. From fig , was 0.0005.The trendline also did not include the first two points. By dividing the gradient by the initial volume which was 18.73463 ų, the thermal expansion coefficient was found to be 2.6689x10⁻⁵ K-1.
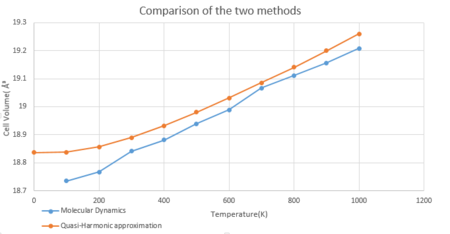
Fig.12 shows the comparison of MD and the quasi-harmonic approximation. The two curves have similar shapes. The cell volume predicted by MD lies below the one predicted by the quasi-harmonic approximation at each temperature from 0K to 1000K. The quasi-harmonic approximation works better at low tempwerature while becomes inaccurate at high temperature. This is because at high temperature, bond dissociation starts to happen and the crystal structure is no longer perfect. Therefore the quasi-harmonic approximation does not apply any more. The Molecular Dynamics methods works well at high temperature, however does not work at low temperature. This is because this method treats the system classically and depends on the velocity on each atom. At 0K, there is no result as atoms do not move at 0K.
By comparing the thermal expansion coefficient calculated by the two methods, 2.124x10⁻⁵ K-1 by the quasi-harmonic approximation, 2.6689x10⁻⁵ K-1 by MD. The thermal expansion coefficient calculated by the quasi-harmonic approximation is closer to the literature value 4x10⁻⁵K-1. Therefore, the Molecular Dynamics method is more accurate than the quasi-harmonic approximation.
Conclusion
Two methods were used to find the thermal expansion coefficients in this experiment: the quasi-harmonic approximation and the molecular dynamics. The grid size 32x32x32 was found to be optimal and was used in the quasi-harmonic approximation to find the relationship between the Helmholtz free energy, the lattice constant and the cell volume with temperature. The thermal expansion coefficient can be found by calculating the gradient of the cell volume against temperature graph. The molecular dynamics methods however relies on the equations of classical mechanics. The quasi-harmonic approximation works better at low temperature and the molecular dynamics method works better at high temperature. By comparison, the molecular dynamics method shows better agreement with the literature value.
Reference
- ↑ http://www.azom.com/article.aspx?ArticleID=54
- ↑ http://www.physics-in-a-nutshell.com/article/11
- ↑ MSE 2090: Introduction to Materials Science Chapter 19, Thermal Properties
- ↑ Vibrational Thermodynamics of Materials, Brent Fultz California Institute of Technology, W. M. Keck Laboratory, Pasadena CA 91125 USA, July 6, 2009
- ↑ http://uspex.stonybrook.edu/qzhu-thesis/sect0027.html
- ↑ http://web.mit.edu/mbuehler/www/SIMS/Thermal%20Expansion.html
- ↑ https://www.hindawi.com/journals/jther/2014/123478/
- ↑ https://web.stanford.edu/class/cs279/lectures/lecture4.pdf
