Rep:Mod:xkcdaok
Module 2, Week 1
Section 1
BH3 optimization
Part 1: 3-21G
Log file: File:XkcdaokBH3logfile1.log
File type: .log
Calculation Type: FOPT
Calculation Method: RB3LYP
Basis Set: 3-21G
Energy: -26.38296911 a.u.
Gradient: 0.00020672 a.u.
Dipole: 0.000 Debye
Point Group: D3h
Job Time: 26s
The calculation performed shows an equilibrium bond distance of 1.19Å, and a bond angle of 120°. As the molecule is trigonal planar, this is exactly what we expect. What a relief!
The 'item' section of the log file is below:
         Item               Value     Threshold  Converged?
 Maximum Force            0.000413     0.000450     YES
 RMS     Force            0.000271     0.000300     YES
 Maximum Displacement     0.001533     0.001800     YES
 RMS     Displacement     0.001054     0.001200     YES
 Predicted change in Energy=-1.071765D-06
 Optimization completed.
    -- Stationary point found.
                           ----------------------------
                           !   Optimized Parameters   !
                           ! (Angstroms and Degrees)  !
 --------------------------                            --------------------------
 ! Name  Definition              Value          Derivative Info.                !
 --------------------------------------------------------------------------------
 ! R1    R(1,2)                  1.1935         -DE/DX =    0.0004              !
 ! R2    R(1,3)                  1.1935         -DE/DX =    0.0004              !
 ! R3    R(1,4)                  1.1935         -DE/DX =    0.0004              !
 ! A1    A(2,1,3)              120.0            -DE/DX =    0.0                 !
 ! A2    A(2,1,4)              120.0            -DE/DX =    0.0                 !
 ! A3    A(3,1,4)              120.0            -DE/DX =    0.0                 !
 ! D1    D(2,1,4,3)            180.0            -DE/DX =    0.0                 !
 --------------------------------------------------------------------------------
 GradGradGradGradGradGradGradGradGradGradGradGradGradGradGradGradGradGrad
Part 2: 6-31G (d,p)
Log file: File:XkcdaokBH3logfile2.log
File type: .log
Calculation Type: FOPT
Calculation Method: RB3LYP
Basis Set: 6-21G(d,p)
Energy: -26.61532363 a.u.
Gradient: 0.00000235 a.u.
Dipole: 0.000 Debye
Point Group: D3h
Job Time: 18s
The bond lengths and angles after this calculation are still as described above: 1.19Å and 120° respectively.
The 'item' section of the log file is reproduced below:
Item               Value     Threshold  Converged?
 Maximum Force            0.000005     0.000450     YES
 RMS     Force            0.000003     0.000300     YES
 Maximum Displacement     0.000019     0.001800     YES
 RMS     Displacement     0.000012     0.001200     YES
 Predicted change in Energy=-1.304899D-10
 Optimization completed.
    -- Stationary point found.
                           ----------------------------
                           !   Optimized Parameters   !
                           ! (Angstroms and Degrees)  !
 --------------------------                            --------------------------
 ! Name  Definition              Value          Derivative Info.                !
 --------------------------------------------------------------------------------
 ! R1    R(1,2)                  1.1923         -DE/DX =    0.0                 !
 ! R2    R(1,3)                  1.1923         -DE/DX =    0.0                 !
 ! R3    R(1,4)                  1.1923         -DE/DX =    0.0                 !
 ! A1    A(2,1,3)              120.0            -DE/DX =    0.0                 !
 ! A2    A(2,1,4)              120.0            -DE/DX =    0.0                 !
 ! A3    A(3,1,4)              120.0            -DE/DX =    0.0                 !
 ! D1    D(2,1,4,3)            180.0            -DE/DX =    0.0                 !
 --------------------------------------------------------------------------------
 GradGradGradGradGradGradGradGradGradGradGradGradGradGradGradGradGradGrad
TlBr3 Optimization
Part 1
Log file:File:Xkcdaok TlBr3 opt pt1.log
File type: .log
Calculation Type: FOPT
Calculation Method: RB3LYP
Basis Set: LANL2DZ
Energy: -91.21812851 a.u.
Gradient: 0.00000090 a.u.
Dipole: 0.000 Debye
Point Group: D3h
Job Time: 19.1s
This calculation shows a bond length of 2.65Å and a bond angle of 120°. The literature value found for the bond length was 2.52Å[1]. The values are very similar.
The item section of the log file:
Item               Value     Threshold  Converged?
 Maximum Force            0.000002     0.000450     YES
 RMS     Force            0.000001     0.000300     YES
 Maximum Displacement     0.000022     0.001800     YES
 RMS     Displacement     0.000014     0.001200     YES
 Predicted change in Energy=-6.084017D-11
 Optimization completed.
    -- Stationary point found.
                           ----------------------------
                           !   Optimized Parameters   !
                           ! (Angstroms and Degrees)  !
 --------------------------                            --------------------------
 ! Name  Definition              Value          Derivative Info.                !
 --------------------------------------------------------------------------------
 ! R1    R(1,2)                  2.651          -DE/DX =    0.0                 !
 ! R2    R(1,3)                  2.651          -DE/DX =    0.0                 !
 ! R3    R(1,4)                  2.651          -DE/DX =    0.0                 !
 ! A1    A(2,1,3)              120.0            -DE/DX =    0.0                 !
 ! A2    A(2,1,4)              120.0            -DE/DX =    0.0                 !
 ! A3    A(3,1,4)              120.0            -DE/DX =    0.0                 !
 ! D1    D(2,1,4,3)            180.0            -DE/DX =    0.0                 !
 --------------------------------------------------------------------------------
 GradGradGradGradGradGradGradGradGradGradGradGradGradGradGradGradGradGrad
The file was also published to D-space, here: [1]
BBr3 Optimization
Part 1
Log file:File:XkcdaokBBr3Gen.log
File type: .log
Calculation Type: FOPT
Calculation Method: RB3LYP
Basis Set: Gen (6-31G for B, LANL2DZ for Br)
Energy: -64.43645296 a.u.
Gradient: 0.00000382 a.u.
Dipole: 0.000 Debye
Point Group: D3h
Job Time: 18.2s
This calculation gives a bond length of 1.93Å and a bond angle of 120°
The item section of the log file:
Item               Value     Threshold  Converged?
 Maximum Force            0.000008     0.000450     YES
 RMS     Force            0.000005     0.000300     YES
 Maximum Displacement     0.000036     0.001800     YES
 RMS     Displacement     0.000023     0.001200     YES
 Predicted change in Energy=-4.027253D-10
 Optimization completed.
    -- Stationary point found.
                           ----------------------------
                           !   Optimized Parameters   !
                           ! (Angstroms and Degrees)  !
 --------------------------                            --------------------------
 ! Name  Definition              Value          Derivative Info.                !
 --------------------------------------------------------------------------------
 ! R1    R(1,2)                  1.934          -DE/DX =    0.0                 !
 ! R2    R(1,3)                  1.934          -DE/DX =    0.0                 !
 ! R3    R(1,4)                  1.934          -DE/DX =    0.0                 !
 ! A1    A(2,1,3)              120.0            -DE/DX =    0.0                 !
 ! A2    A(2,1,4)              120.0            -DE/DX =    0.0                 !
 ! A3    A(3,1,4)              120.0            -DE/DX =    0.0                 !
 ! D1    D(2,1,4,3)            180.0            -DE/DX =    0.0                 !
 --------------------------------------------------------------------------------
 GradGradGradGradGradGradGradGradGradGradGradGradGradGradGradGradGradGrad
The file was also published here: [2]
Summary
| Molecule | Bond Length in Å |
|---|---|
| BH3 | 1.19 |
| BBr3 | 1.93 |
| TlBr3 | 2.65 |
We can see from this tabulation that using a larger ligand (Br vs. H) results in a longer bond length, as we might expect. H and Br are different in that Br is a lot larger, with more electron density. It has s, p and d orbitals, whereas H has only an s orbital. However, both atoms require only one electron to fill their outermost atomic orbital, and also have relatively small outer orbitals.
Changing the central element from B to Tl increases the equilibrium bond length, as expected. This is because Tl is a much larger atom than B. It also has more diffuse orbitals, meaning its bonds are weaker, and so would tend to be longer. B has no d orbitals, whereas Tl does. Both atoms are in group three, meaning that they have the same number of valence electrons, and tend to form three bonds. However, Tl, as it is so far down the periodic table, displays the inert pair effect, where an otherwise multivalent atom tends to bond monovalently. This is because the outermost s electrons are too low in energy to readily participate in bonding.
The lack of a drawn-in bond in Gaussview does not mean that a bond is not present, as the drawing in of the bonds is based on the distance between the atoms rather than the presence of shared electron density. A bond is electron density shared between two or more atoms that is placed in 'bonding' molecular orbitals: that is, orbitals where the atomic orbitals are predominantly in-phase, interfering constructively with one another.
Section 2
BH3 Frequency Analysis
Log file:File:Xkcdaok BH3 freq.log
File type: .log
Calculation Type: FREQ
Calculation Method: RB3LYP
Basis Set: 6-21G(d,p)
Energy: -26.61532363 a.u.
Gradient: 0.00000237 a.u.
Dipole: 0.000 Debye
Point Group: D3h
Job Time: 12s
The 'low frequencies' section of the above file:
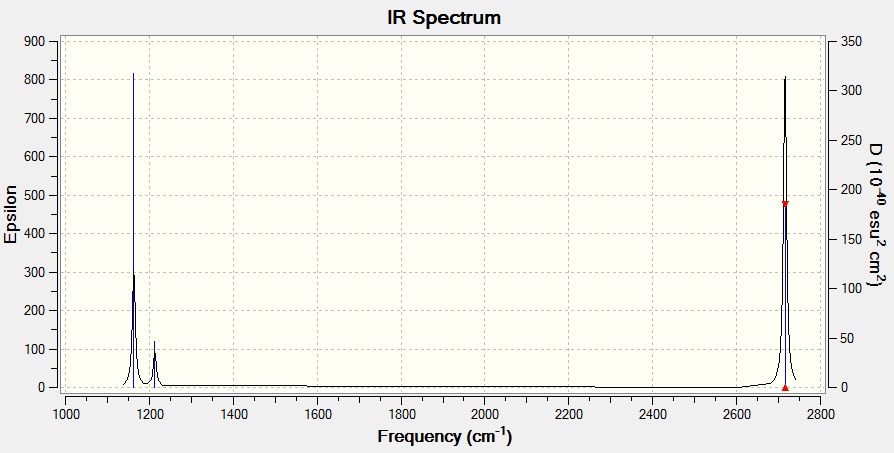
Low frequencies ---   -0.9033   -0.7343   -0.0054    6.7375   12.2491   12.2824
Low frequencies --- 1163.0003 1213.1853 1213.1880
The associated IR spectrum:
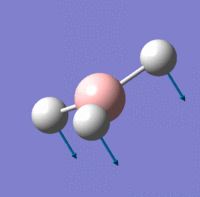
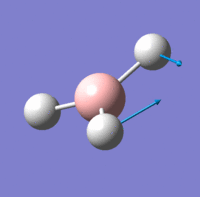
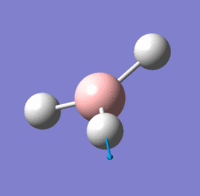
There are fewer than 6 peaks in the spectrum, despite the presence of six vibrations. This is because There are two sets of vibrations that have the same associated frequency, and one vibration that has an intensity of 0. This means that only three peaks are visible in the IR spectrum.
TlBr3 Vibrational Analysis
File type: .log
Calculation Type: FREQ
Calculation Method: RB3LYP
Basis Set: LANL2DZ
Energy: -91.21812851 a.u.
Gradient: 0.00000088 a.u.
Dipole: 0.000 Debye
Point Group: D3h
Job Time: 21.7s
The log file was published to D-space here: [[3]]
The low frequencies from the log file are reproduced here.
Low frequencies ---   -3.4213   -0.0026   -0.0004    0.0015    3.9367    3.9367
Low frequencies ---   46.4289   46.4292   52.1449
The lowest 'real' normal mode is 46.43cm^-1, with a symmetry of E'.
The IR spectrum of TlBr3:
| Number | BH3 Frequency (cm^-1) | BH3 symmetry | TlBr3 Frequency (cm^-1) | TlBr3 symmetry |
|---|---|---|---|---|
| 1 | 1163.00 | A2" | 46.43 | E' |
| 2 | 1213.19 | E' | 46.43 | E' |
| 3 | 1213.19 | E' | 52.14 | A2" |
| 4 | 2582.26 | A1' | 165.27 | A1' |
| 5 | 2715.43 | E' | 210.69 | E' |
| 6 | 2715.43 | E' | 210.69 | E' |
The large difference in frequencies between BH3 and TlBr3 indicates that the bonds in TlBr3 are much weaker than those in BH3. Lower energy, and so weaker, bonds, require lower frequencies and so less energy to bend or stretch. There has been a re-ordering of modes, the A2" being higher in energy than the E' in TlBr3 and vice versa in BH3. The A2" is (relatively) higher in energy in TlBr3 because of the size of the Br atoms. These are much larger than H atoms, and so when moving in the A2" mode, they are more likely to sterically clash, meaning the system needs to overcome a higher energy barrier for the vibration to occur. The spectra have a similar overall shape, with the same number of peaks, though these are closer together in the TlBr3 spectrum.
It is necessary to use the same basis set for both optimization and frequency calculations, because the purpose of the frequency calculations is to determine that the optimization is a minimum. If a different basis set is used, the frequency analysis will determine that another optimization is a minimum. The low frequencies represent the movements of the centre of mass of the molecule.
BH3 Molecular Orbitals Comparison
| MO diagram | Calculated orbitals |
|---|---|
 |
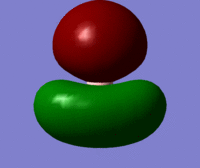
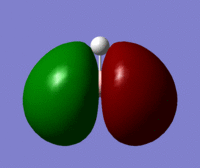
The calculated orbitals clearly resemble the ones given by the LCAO theory. This suggests that LCAO MO theory is very accurate in its qualitative predictions, and thus very useful
Section 3
NH3 Optimization
NH3 was optimized.
Log file: File:Xkcdaok NH3631gdp opt.log
File type: .log
Calculation Type: FOPT
Calculation Method: RB3LYP
Basis Set: 6-31G(d,p)
Energy: -56.55776856 a.u.
Gradient: 0.00000885 a.u.
Dipole: 1.8464 Debye
Point Group: C1
Job Time: 21.7s
The item section of the above log file:
 Item               Value     Threshold  Converged?
 Maximum Force            0.000024     0.000450     YES
 RMS     Force            0.000012     0.000300     YES
 Maximum Displacement     0.000079     0.001800     YES
 RMS     Displacement     0.000053     0.001200     YES
 Predicted change in Energy=-1.629727D-09
 Optimization completed.
    -- Stationary point found.
                           ----------------------------
                           !   Optimized Parameters   !
                           ! (Angstroms and Degrees)  !
 --------------------------                            --------------------------
 ! Name  Definition              Value          Derivative Info.                !
 --------------------------------------------------------------------------------
 ! R1    R(1,2)                  1.018          -DE/DX =    0.0                 !
 ! R2    R(1,3)                  1.018          -DE/DX =    0.0                 !
 ! R3    R(1,4)                  1.018          -DE/DX =    0.0                 !
 ! A1    A(2,1,3)              105.7413         -DE/DX =    0.0                 !
 ! A2    A(2,1,4)              105.7486         -DE/DX =    0.0                 !
 ! A3    A(3,1,4)              105.7479         -DE/DX =    0.0                 !
 ! D1    D(2,1,4,3)           -111.8631         -DE/DX =    0.0                 !
 --------------------------------------------------------------------------------
A frequency analysis was then performed to show that this optimized structure was a minimum.
Log file: File:Xkcdaok NH3 freq.log
File type: .log
Calculation Type: FREQ
Calculation Method: RB3LYP
Basis Set: 6-31G(d,p)
Energy: -56.55776856 a.u.
Gradient: 0.00000892 a.u.
Dipole: 1.8464 Debye
Point Group: C1
Job Time: 16s
The low frequencies section of the file is below.
Low frequencies ---  -30.6871   -0.0010   -0.0004    0.0016   20.2743   28.3113
Low frequencies --- 1089.5554 1694.1243 1694.1865
The vibrational frequencies are tabulated below.
| Vibration | Frequency | Intensity |
|---|---|---|
| 1 | 1089.56 | 145.4401 |
| 2 | 1694.12 | 13.5558 |
| 3 | 1694.19 | 13.5560 |
| 4 | 3460.98 | 1.0593 |
| 5 | 3589.40 | 0.2700 |
| 6 | 3589.52 | 0.2709 |
There are no negative frequencies, so the structure has been correctly optimized.
NH3 Population Analysis
Log file: File:Xkcdaok NH3 MO.log
File type: .log
Calculation Type: SP
Calculation Method: RB3LYP
Basis Set: 6-31G(d,p)
Energy: -56.5577685 a.u.
Gradient: 0.00000892 a.u.
Dipole: 1.8464 Debye
Point Group: C1
Job Time: 16s
The calculation was published to D-space here: [[4]]
NH3 NBO Analysis
The charge distribution, from -1.125 (red) - 1.125 (green)
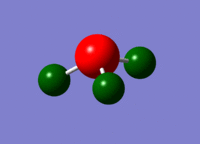
The N atom has a charge of -1.125, and the H atoms a charge of 0.375.
Section 4
NH3BH3 Optimization
Log file: File:Xkcdaok NH3BH3 opt.log
File type: .log
Calculation Type: FOPT
Calculation Method: RB3LYP
Basis Set: 6-31G(d,p)
Energy: -83.22468910 a.u.
Gradient: 0.00006798 a.u.
Dipole: 5.5654 Debye
Point Group: C1
Job Time: 18.4s
The item table from the above file:
Item               Value     Threshold  Converged?
 Maximum Force            0.000137     0.000450     YES
 RMS     Force            0.000063     0.000300     YES
 Maximum Displacement     0.000727     0.001800     YES
 RMS     Displacement     0.000451     0.001200     YES
 Predicted change in Energy=-2.030808D-07
 Optimization completed.
    -- Stationary point found.
A frequency analysis was conducted to ensure that the optimized structure is a minimum.
Log file: File:Xkcdaok NH3BH3 freq.log
File type: .log
Calculation Type: FREQ
Calculation Method: RB3LYP
Basis Set: 6-31G(d,p)
Energy: -83.22468907 a.u.
Gradient: 0.00006793 a.u.
Dipole: 5.5654 Debye
Point Group: C1
Job Time: 1m, 8s
The low frequencies of the file:
Low frequencies ---   -0.0010   -0.0008    0.0014   16.9338   22.4136   37.8851
Low frequencies ---  265.7263  632.3740  639.0599
None of the vibration frequencies in the file are negative, so the optimized structure is a minimum
The Association Energy of NH3BH3
The association energy of NH3BH3 was calculated from the previous calculations:
E(BH3) = -26.6153236 a.u.
E(NH3) = -56.55776856 a.u.
E(NH3BH3) = -83.22468910 a.u.
ΔE=E(NH3BH3)-[E(NH3)+E(BH3)]
ΔE=166.39778126 a.u. = 135.468 kJ/mol
This seems like a sensible figure.
Module 2, Week 2
Section 1
Benzene Optimization
Log file: File:Xkcdaok benzene opt.log
File type: .log
Calculation Type: FOPT
Calculation Method: RB3LYP
Basis Set: 6-31G(d,p)
Energy: -232.25820551 a.u.
Gradient: 0.00009549 a.u.
Dipole: 0.0001 Debye
Point Group: C1
Job Time: 1m, 2s
The item table from the log file:
Item               Value     Threshold  Converged?
 Maximum Force            0.000212     0.000450     YES
 RMS     Force            0.000085     0.000300     YES
 Maximum Displacement     0.001099     0.001800     YES
 RMS     Displacement     0.000330     0.001200     YES
 Predicted change in Energy=-5.196758D-07
 Optimization completed.
    -- Stationary point found.
A frequency analysis was performed to ensure that the above optimization is a minimum.
Log file: File:Xkcdaok benzene freq.log
File type: .log
Calculation Type: FREQ
Calculation Method: RB3LYP
Basis Set: 6-31G(d,p)
Energy: -232.25820473 a.u.
Gradient: 0.00009549 a.u.
Dipole: 0.0001 Debye
Point Group: C1
Job Time: 5m, 47s
The low frequencies section is below:
Low frequencies ---  -17.7620  -15.0717  -10.1684   -0.0001    0.0008    0.0008
Low frequencies ---  413.7935  414.4537  620.8381
There are no calculated frequencies below 0, so the optimization does represent a minimum.
Benzene Population Analysis
A population analysis of Benzene was carried out.
Log file: File:Xkcdaok benzene pop.log
File type: .log
Calculation Type: SP
Calculation Method: RB3LYP
Basis Set: 6-31G(d,p)
Energy: -232.25820551 a.u.
Gradient: 0.00009549 a.u.
Dipole: 0.0001 Debye
Point Group: C1
Job Time: 47s
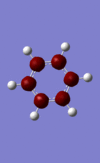
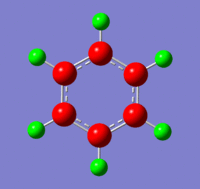
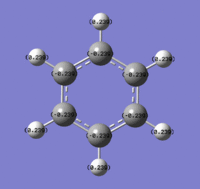
The charges visualised on a molecule of benzene, by colour (from -0.239 (red) to 0.239(green)) and by number:
Benzene Molecular Orbitals
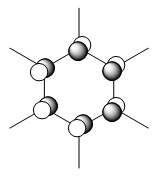
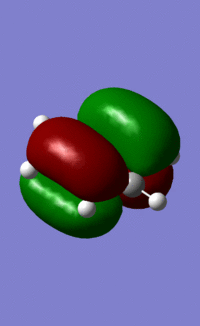
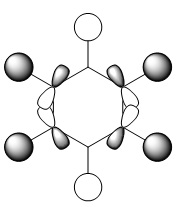
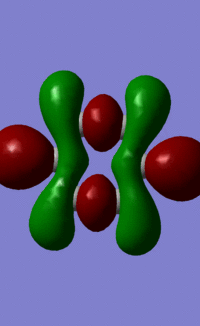
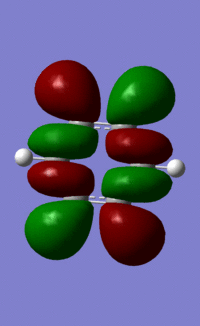
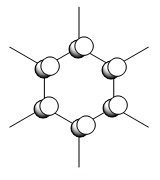
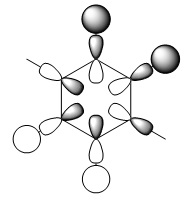
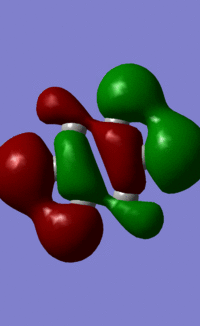
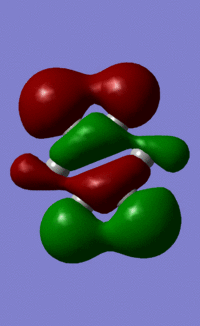
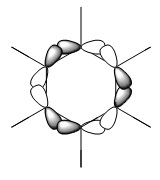
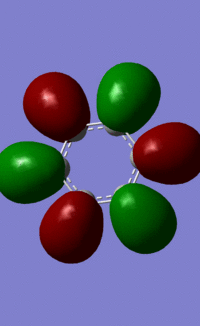
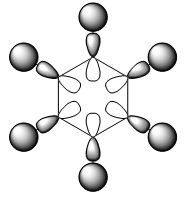
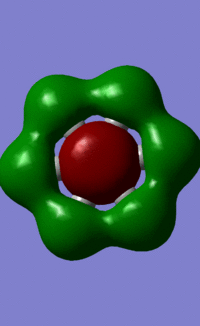
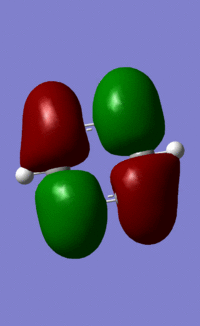
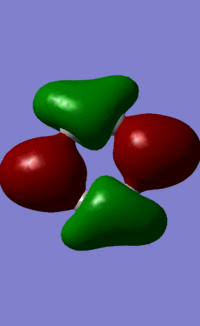
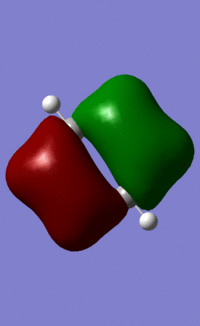
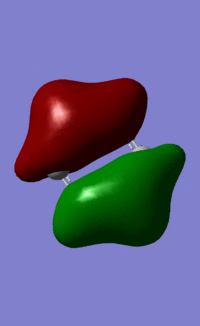
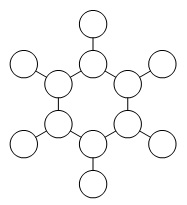
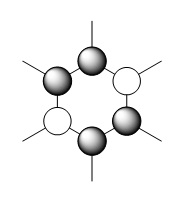
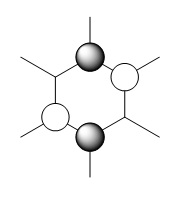
An MO diagram of benzene compared with calculated orbitals.
| LCAO | Calculated Orbital |
|---|---|
  |
|
  |
|
 |

|
  |
|
 |

|
 |
|
 |
|
  |
|
File:Xkcdaok MO9.jpg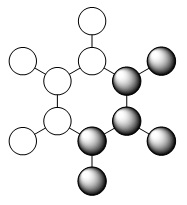 |
|
 |

|
   |
|
  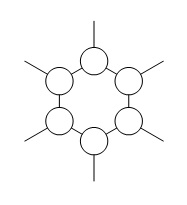 |
All 21 orbitals that are calculated as occupied are displayed above. As benzene is a 42 electron compound, this means that every orbital must be fully occupied by 2 electrons.
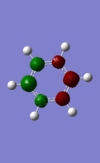
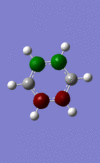
The concept of aromaticity relates to delocalised pi electron density, meaning that it is concerned only with orbitals that display pi bonding. Of all the orbitals displayed above, only 3 exhibit pi bonding: orbitals 17, 20 and 21. As every orbital must be filled with two electrons, this means that the compound contains 6 electrons that are relevant for aromaticity. As 6 obeys the 4n+2 rules (where n=0,1,2,3...) this means that benzene in this model is aromatic. This tallies well with reality, where benzene is considered both aromatic and to have 6 pi electrons.
Section 2
Optimization of Boratabenzene
Log file: File:Xkcdaok boratabenzene opt.log
File type: .log
Calculation Type: FOPT
Calculation Method: RB3LYP
Basis Set: 6-31G(d,p)
Energy: -219.02053056 a.u.
Gradient: 0.00000813 a.u.
Dipole: 2.8452 Debye
Point Group: CS
Job Time: 55s
The item section of the file:
Item               Value     Threshold  Converged?
 Maximum Force            0.000010     0.000450     YES
 RMS     Force            0.000004     0.000300     YES
 Maximum Displacement     0.000192     0.001800     YES
 RMS     Displacement     0.000063     0.001200     YES
 Predicted change in Energy=-3.770005D-09
 Optimization completed.
    -- Stationary point found.
A frequency analysis was performed to show that the above optimization is a minimum.
Log file: File:Xkcdaok boratabenzene freq.log
File type: .log
Calculation Type: FREQ
Calculation Method: RB3LYP
Basis Set: 6-31G(d,p)
Energy: -219.02053056 a.u.
Gradient: 0.00000822 a.u.
Dipole: 2.8452 Debye
Point Group: CS
Job Time: 4m, 5s
The low frequencies of the log file:
Low frequencies ---  -13.0236   -0.0002    0.0003    0.0006   14.4488   18.0061
 Low frequencies ---  371.3835  404.1291  565.1604
No negative frequencies are observed, therefore this optimization is a minimum.
Population Analysis of Boratabenzene
Log file: File:Xkcdaok boratabenzene pop.log
File type: .log
Calculation Type: SP
Calculation Method: RB3LYP
Basis Set: 6-31G(d,p)
Energy: -219.02053056 a.u.
Gradient: 0.00000822 a.u.
Dipole: 2.8452 Debye
Point Group: CS
Job Time: 46.1s
The file was published to D-space here [[5]].
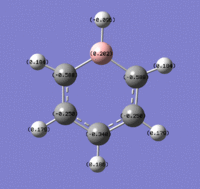
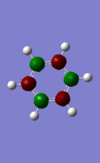
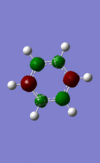
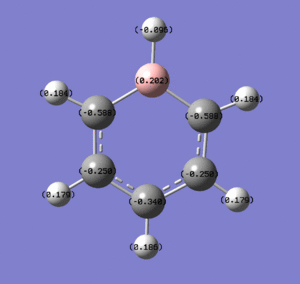
These images show the charge distribution by colour (from -0.588 (red) to 0.588 (green) and by number, with the B at the top in each case.
Section 3
Optimization of Pyridinium
Log file: File:Xkcdaok pyridinium opt.log
File type: .log
Calculation Type: FOPT
Calculation Method: RB3LYP
Basis Set: 6-31G(d,p)
Energy: -248.66807396 a.u.
Gradient: 0.00003919 a.u.
Dipole: 1.8727 Debye
Point Group: C1
Job Time: 59s
The item table from the above file:
Item               Value     Threshold  Converged?
 Maximum Force            0.000064     0.000450     YES
 RMS     Force            0.000023     0.000300     YES
 Maximum Displacement     0.000625     0.001800     YES
 RMS     Displacement     0.000158     0.001200     YES
 Predicted change in Energy=-6.444008D-08
 Optimization completed.
    -- Stationary point found.
A frequency analysis was carried out to ensure that the above optimization is a minimum.
Log file: File:Xkcdaok pyridinium freq.log
File type: .log
Calculation Type: FREQ
Calculation Method: RB3LYP
Basis Set: 6-31G(d,p)
Energy: -248.66807396 a.u.
Gradient: 0.00003926 a.u.
Dipole: 1.8727 Debye
Point Group: C1
Job Time: 5m 49s
The low frequencies section of the log file:
Low frequencies ---   -7.2135   -0.0007    0.0005    0.0005   17.3349   18.5325
Low frequencies ---  392.4555  404.0613  620.4713
There are no negative calculated frequencies, so the calculated optimization must be a minimum
Population Analysis of Pyridinium
Log file: File:Xkcdaok pyridinium pop.log
File type: .log
Calculation Type: SP
Calculation Method: RB3LYP
Basis Set: 6-31G(d,p)
Energy: -248.66807396 a.u.
Gradient: 0.00003926 a.u.
Dipole: 1.8727 Debye
Point Group: C1
Job Time: 1m
This file was published to D-space here [[6]].
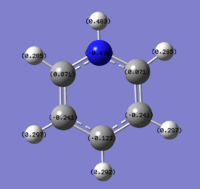
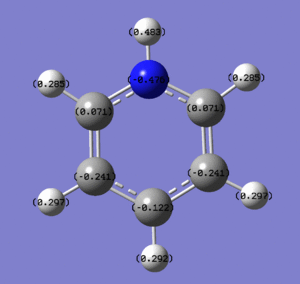
These images show the charge distribution in the molecule, by colour, from -0.483 (red) to 0.483 (green)and by number. In both images, the N is at the top of the molecule.
Section 4
Optimization of Borazine
Log file: File:Xkcdaok borazine opt.log
File type: .log
Calculation Type: FOPT
Calculation Method: RB3LYP
Basis Set: 6-31G(d,p)
Energy: -242.68459784 a.u.
Gradient: 0.00007135 a.u.
Dipole: 0.0003 Debye
Point Group: C1
Job Time: 1m 9s
The item section of the log file:
Item               Value     Threshold  Converged?
 Maximum Force            0.000116     0.000450     YES
 RMS     Force            0.000036     0.000300     YES
 Maximum Displacement     0.000376     0.001800     YES
 RMS     Displacement     0.000103     0.001200     YES
 Predicted change in Energy=-1.238784D-07
 Optimization completed.
    -- Stationary point found.
A frequency analysis was carried out to ensure that the optimized structure above is a minimum.
Log file: File:Xkcdaok borazine freq.log
File type: .log
Calculation Type: FREQ
Calculation Method: RB3LYP
Basis Set: 6-31G(d,p)
Energy: -242.68459780 a.u.
Gradient: 0.00007135 a.u.
Dipole: 0.0003 Debye
Point Group: C1
Job Time: 5m 20s
The low frequencies of the log file are reproduced below:
Low frequencies ---  -11.4295   -0.0009   -0.0006   -0.0006    9.1752   10.7940
Low frequencies ---  288.5045  290.3946  404.0141
There are no negative frequencies calculated, suggesting that this optimization does represent a minimum.
Population Analysis of Borazine
Log file: File:Xkcdaok borazine pop.log
File type: .log
Calculation Type: SP
Calculation Method: RB3LYP
Basis Set: 6-31G(d,p)
Energy: -242.68459780 a.u.
Gradient: 0.00007135 a.u.
Dipole: 0.0003 Debye
Point Group: C1
Job Time: 45s
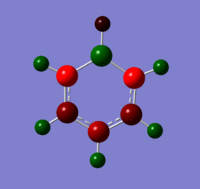
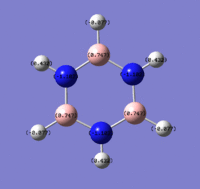
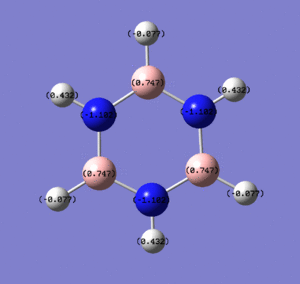
Below are images showing the charge density of borazine, by colour (from -1.102 (red) to 1.102 (green)) and by number. In both images, B is at the top of molecule.
Section 6
Comparison of Calculated Charges
| Molecule | By colour | By number |
|---|---|---|
| Benzene | 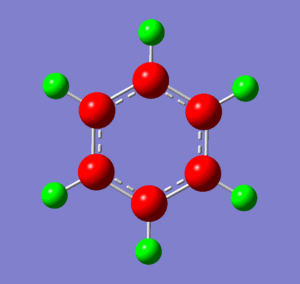 |

|
| Boratabenzene | 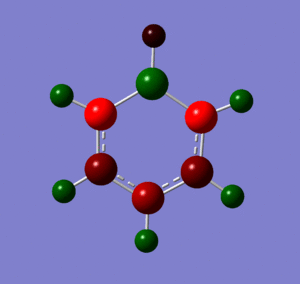 |
|
| Pyridinium | 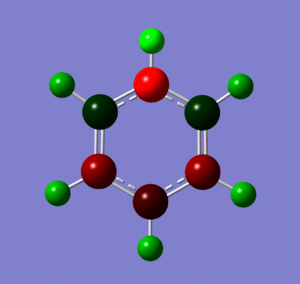 |
|
| Borazine |  |
|
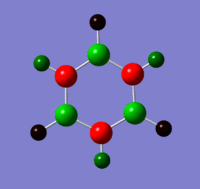
Benzene has the most even charge density, as we would expect given that all atoms in the ring have identical electronegativity. This has the result that all the carbons carry some negative charge, and all the hydrogens some positive charge. The symmetry of this electron density means that benzene has a very small dipole moment of 0.0001D
Where heteroatoms appear in the ring, we observe distortion of electron density in their direction. In boratabenzene, boron, more electropositive than carbon, pushes electron density away from itself and onto the carbons. This results in boron carrying a positive charge, and the carbons carrying more negative charge. The closer the carbons are to the boron, the more negative charge they carry. The carbons that sit either side of the boron each carry twice the negative charge of any single carbon atom in benzene. The carbon that lies directly opposite the boron also carries more negative charge, due to resonance effects. The hydrogen that bonds to the boron also carries a slight negative charge, as boron is so electron positive. The other hydrogens carry positive charge as expected, though somewhat less than their equivalents in benzene. This is because the electron density that is pushed away from the boron dissipates, to an extent, throughout the molecule, resulting in the H atoms each having more electron density. Because of all these effects, boratabenzene has a strong dipole moment of 2.8452D.
The pyridinium ion displays much the same overall behaviour as the boratabenzene, but with charges reversed. Because nitrogen is more electronegative than carbon, it pulls the electron density of the ring towards itself, resulting in it carrying quite a strong negative charge. As in the above example, this has a strong effect on the carbons either side of it, drawing electron density away from them and leaving them with a weak positive charge. Again, the carbon directly opposite the heteroatom is also quite strongly affected, for the same reason as given above. The electron density drawn in by nitrogen also gives some negative charge character to the hydrogen atom bonded to nitrogen. The same effect renders the other hydrogens in the atom slightly more positively charged than they are in benzene. Pyridinium, therefore, has a strong dipole moment of 1.8727D. This is not as large as boratobenzene because, as the ion is positively charged, the ratio of protons to electrons is lower, meaning there is less net negative charge. This is despite the fact that the two compounds are isoelectronic.
Borazine shows the effects of both N and B being present, as we would expect. This means that the electronegative nitrogen is strongly negative, whereas the electropositive boron is strongly positive. The hydrogens on each kind of atom react as they did in boratabenzene and pyridinium: the hydrogens bonded to the nitrogen carry a small negative charge, whereas the hydrogens bonded to the boron atoms carry a small positive charge. These effects result in a strong undulation of electron density across the molecule. Despite this, though, borazine has a very small dipole of 0.0003D. This is because the electron distribution is highly symmetrical.
To summarize, we observe two major trends across these four isoelectronic compounds. Firstly, we move from the uniform electron density of benzene to the one-sided distorted electron density of boratabenzene and pyridinium, to the strongly undulating electron density of borazine. Secondly, we see two uncharged compounds with highly symmetrical electron density and very small dipoles in benzene and borazine, and two charged species with highly asymmetic electron density and strong dipole moments in boratabenzene and pyridinium.
Comparison of Calculated Equivalent MOs
| Number | LCAO orbital | Benzene | Boratabenzene | Pyridinium | Borazine |
|---|---|---|---|---|---|
| 21/20/21/21 |  |
 |
 |
 |
|
| 17 |  |
 |
 |
 |
|
| 17, view b | 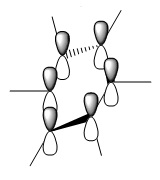 |
 |
 |
 |

|
| 14/15/13/15 |  |
 |
 |
 |

|
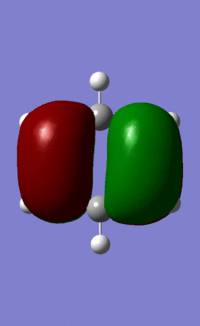
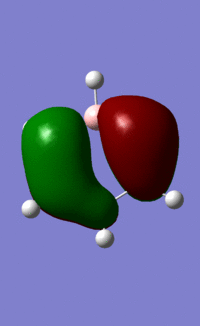
Orbital "21"
The similarities between the first three orbitals are quite clear: they all obviously display the characteristics of the chemdraw representation, and are all very similar in shape. This is because in all three cases, the orbitals making up the MOs are carbon p-orbitals. This means that the orbitals all have the same electronegativity, so make equal contributions to the MOs. In addition, every orbital contributing across the three sets of MOs is the same size, meaning that the shapes are almost identical. The only obvious difference between these three is that the boratabenzene orbital is MO 20, whereas this MO is number 21 in benzene, pyridinium and borazine. This is because boron is relatively electropositive, meaning that the MO where it has a large contribution to the orbital (the equivalent of benzene's MO 20) is higher in energy than this one, where it does not contribute. Whereas in benzene, 20 and 21 are degenerate, in boratabenzene, the equivalent of 21 (the orbital displayed) sits lower than the equivalent of orbital 20.
The borazine orbital, rather than the four p-orbitals that the others display, has five p-orbitals contributing to its MO, one on each atom other than the boron at the top. This is caused by the mixing of the 20 and 21 orbitals, which are degenerate, and have six and four pi orbitals each. The orbitals are larger around the nitrogen atoms that sit either side of the unoccupied (position 1) boron. Because of the lack of electron density on the boron, the highly electronegative nitrogens distort the electron density towards themselves to compensate.
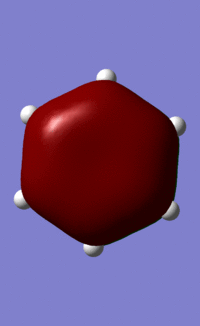
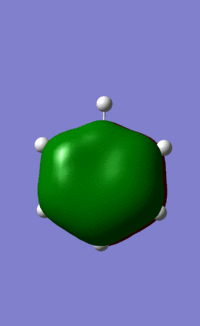
Orbital "17"
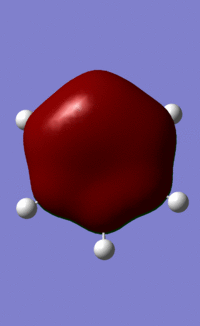
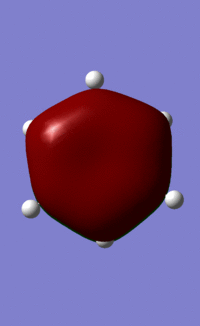
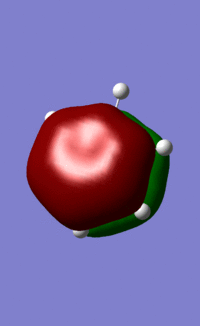
These orbitals and their relationships are more straightforward than those above. They are all made up of six pi orbitals, and the distortions in the electron densities are as we would expect from the charge calculations above. Benzene, with all atoms in the ring having the same electronegativity, has uniform electron density. Boratabenzene, with the electropositive boron in the first position, has less electron density there, and more electron density around the other side of the molecule. this is explained by LCAO theory, as the more electroegative atoms make the largest contribution to the shape of bonding orbitals. Pyridinium shows the opposite distortion: the electronegative nitrogen draws electron density towards itself, making the orbital larger around the N, and smaller around the rest of the ring. Again, this is predicted by LCAO, as the N is more electronegative, so contributes more to the bonding orbitals than the carbons in the ring. We see the same pattern again in borazine. The more electronegative Ns make a larger contribution to the bonding orbitals than the electropositive boron. This results in the undulating pattern we see, where the orbitals are thicker around the N atoms and thinner around the B atoms.
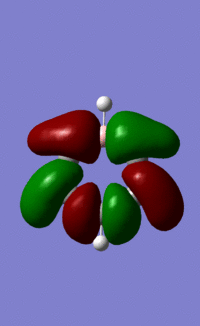
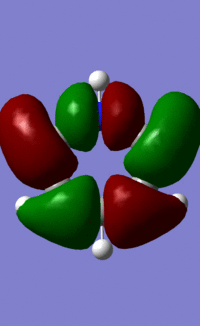
Orbital "14"
This orbital is made up of p orbitals that σ-bond around the ring. The same form, with alternating phases, and nodes on the atoms, can be seen quite clearly in each of the atoms. As above, benzene's exclusively carbon-based ring results in lobes of equal size all around the ring. We see the same thing, with all lobes of equal size, in the borazine orbital. Whilst at first this may seem counterintuitive, it is exactly as we can predict. N contributes more to this largely bonding orbital than B, as it is more electronegative, but each lobe along each bond is made up of one lobe of an N p-orbital and one lobe of a B p-orbital, resulting in all lobes being the same size.
The pyridinium and boratabenzene orbitals are more complicated. They are each distorted by the relative electronegativity or electropositivity of the heteroatom. The pyridinium orbital lobes point towards the nitrogen atom, as the electronegative nitrogen draws the electron density towards itself, as above. The boratabenzene orbital lobes point away from the boron atom, as the electropositive boron atom pushes electron density away from itself and onto the carbons in the rest of the ring. As the effect of the heteroatom in each molecule is essentially the opposite of the other (the electronegative nitrogen vs. the electropositive carbon) the orbitals are almost mirror images of each other.
We might expect that the lobes on either side of the N atom in pyridinium would be large, and those on either side of the B in boratabenzene would be small. This is because LCAO theory says that the more electronegative an atom, the greater the contribution its orbitals have to the bonding MO. These orbitals seem to contradict that principle. However, the electronegative N has contracted orbitals, as it draws electron density towards itself. Conversely, the electropositive B has more diffuse orbitals, as it 'holds on' to electron density less tightly. This results in the orbitals we see above.
Relative Energies of Above Orbitals
| Orbital eq. | Benzene | Boratabenzene | Pyridinium | Borazine |
|---|---|---|---|---|
| 21 | -0.24691 | -0.03492 | -0.47885 | -0.27590 |
| 17 | -0.35998 | -0.13210 | -0.64064 | -0.36130 |
| 14 | -0.43854 | -0.18995 | -0.70595 | -0.43198 |
Figures given are in a.u.
The energies of the benzene and borazine orbitals are very close indeed. This explains, to an extent, the comparative similarity in reactivity that causes the nickname 'inorganic benzene' for borazine. The similarity is explained by the presence of nitrogen atomic orbitals, which lower MOs in energy, and boron AOs, which raise MOs in energy. The effects are similar in magnitude, resulting in them almost cancelling each other out, though the nitrogen lowering effect is slightly stronger.
We can see boron's energy raising effect in the energies of the boratabenzene orbitals. These are all higher in energy than the equivalent benzene orbitals. We can see nitrogen's corresponding energy lowering effect in the orbital energies for pyridinium, which are all lower than the equivalent benzene orbitals. We can see, as predicted by the borazine orbital energies, that the effects are roughly equivalent. The boratabenzene orbitals are higher in energy than the benzene orbitals by approximately the same amount that the pyridinium orbitals are lower than the benzene orbitals.
Degeneracy of the Above Orbitals
| Orbital eq. | Benzene | Boratabenzene | Pyridinium | Borazine |
|---|---|---|---|---|
| 21 | 2 | 1 | 1 | 2 |
| 17 | 1 | 1 | 1 | 1 |
| 14 | 1 | 1 | 1 | 1 |
As before, benzene and borazine share the same degeneracy of each orbital. Boratabenzene and pyridinium both break the degeneracy of this equivalent orbital for reasons discussed above. The orbitals equivalent to benzene MO 20 consist of six pi orbitals, as seen on the MO diagram above. In boratabenzene, the electropositive boron pushes this orbital up in energy. In pyridinium, the electronegative nitrogen pushes the orbital down in energy.
Notes
<references>
- ↑ Blixt, Johan, Glaser, Julius (1995). "Structure of Thallium(III) Chloride, Bromide, and Cyanide Complexes in Aqueous Solution". J. Am. Chem. Soc 117(18): 5089-5104. doi: 10.1021/ja00123a011.

