Rep:Mod:xienzato12345
Computational Lab: MODULE 3 - The Transition State
From: Gabriele Uliana
Tutorial 1 - The Cope Rearrangement
In this tutorial, various conformations of 1,5-hexadiene were explored and analysed. The point of this section was to calculate the lowest energy conformer and confirm it was a minimum using vibrational analysis. In addition, two different levels of theory have been used to compare the structural properties of the minimum energy conformer.
<font="4">Optimizing the anti and gauche structures of 1,5-hexadiene
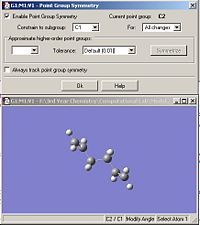
Both the ‘gauche’ and ‘anti’ forms of 1,5-hexadiene were optimized using the HF/3-21G set. The summary windows are shown in fig.1 and fig.2. The optimized molecules were then symmetrised and the resulting point group for both molecules were obtained as shown in fig.3 and fig.4.
 |
 |
 |
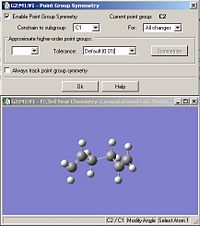 |
It can be seen that the point group obtained for both isomers is C2. Table 1 compares the final energies of both conformers. Since the energies reported from Gaussian are accurate to approximately 1kj/mol and 0.0004 a.u. = 1 kj/mol, then the energy values in a.u. should be accurate to about 4 decimal places. However, in this report, they will be reported to 5 decimal places so they can be directly compared with energy values from the script.
| Energy of anti conformer /a.u. | Energy of gauche conformer / a.u. |
| -231.69260 | -231.69167 |
Table 1 shows that the energy of the anti conformer is lower by about 0.0009 a.u. This was expected because the gauche conformer should suffer from a higher amount of torsional strain which raises the energy.
Anti conformer LOG file, Gauche conformer LOG file
<font="4">Searching for the lowest energy conformer...
1,5-hexadiene contains three rotating C-C bonds. Each of these bonds has three rotational minima. This means that there are a total of 27 different conformations! However, because of symmetry and enantiomeric relationships, only ten are energetically unique1. Based on the results obtained in table 1, the lowest energy of 1,5-hexadiene is expected to have an anti conformation. Therefore, different anti conformers have been explored, and their energy (and point group) noted in table 2. The way different anti conformers were obtained was by keeping the C6-C1-C2-C3 dihedral angle constant at 180o as depicted in fig.5, and varying the relative angle between the C=C bonds. In order to confirm that each conformer is a minimum, the vibrational frequencies were also calculated and checked to see that there were no negative values.

| Anti conformer | Image | Energy /a.u. | Point group |
| A |  |
-231.69260 | C2 |
| B |  |
-231.69254 | Ci |
| C |  |
-231.69097 | C1 |
| D | 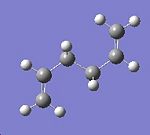 |
-231.68907 | C2h |
Table 2 reveals that 4 different anti conformers were found, each with a different point group. Reassuringly, they match with the ones given in Appendix 1 from the module 3 script. The energies of the anti conformers obtained match exactly with their corresponding ones in appendix 1 (found in the module 3 script). The lowest energy anti conformer obtained is the one with C2 symmetry. This is in agreement with the anti1 form in appendix 1. Unexpectedly, the conformer which has the lowest energy is the gauche3 conformer as shown in appendix 1. This means that my original hypothesis was incorrect, as I mentioned that an anti conformer would be the most stable! If sterics are considered, then an anti conformer should be the most stable, not a gauche conformer, since the C=C bonds are furthers away from each other. This means that there must be some electronic effect which overrides sterics to make the gauche3 form the more stable conformer. Further research revealed that the reason why the gauche conformer is more stable is due to a favourable interaction between the p electrons of the C=C double bond and the nearby vinyl proton 1. This interaction is referred to as a CH-π interaction.
Anti A LOG file,Anti B LOG file,Anti C LOG file,Anti D LOG file
<font="4">Comparison of the Ci anti conformers
Fig. 6 compares the energy of the anti2 conformer from appendix 1 and the computed anti B conformer from table 2. The Ci conformer was chosen most likely because it is the ONLY conformer with Ci symmetry, making it unique and easy to identify. In addition, it is a conformer which almost has the lowest energy. The energy of the Ci conformer is 0.08 kcal/mol higher in energy than the lowest energy gauche conformer. However, it should be emphasised that the energy difference of 0.08kcal/mol is insignificant to make any noticeable difference.

Fig. 6 shows that the energies obtained are the same. This implies that both optimized geometries match exactly and confirms that the minimum was obtained for the Ci conformer.
<font="4">Optimization of the Ci anti conformer using the higher level B3LYP/6-31G* set
The HF/3-21G optimized anti B conformer was further optimized using the more accurate B3LYP/6-31G* set. Table 3 shows the jmols and summary windows comparing the energies of the anti B conformers using different levels of theory. For both the 6-321G* and 3-21G optimizations, It was chosen to use the opt + freq option instead of doing optimization and then frequency in two separate steps as it would save time. This option was used thoughout the module when an optimization needed to be made.
| Method and basis set | Summary table | Jmol | Labelled atoms image | |||
| HF/3-21G | 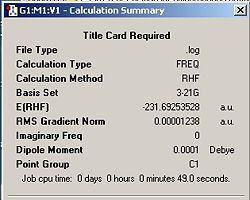 |
|

| |||
| B3LYP/6-31G* | 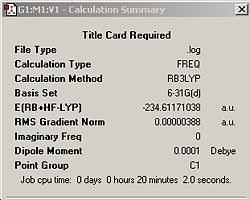 |
|

|
From the summary tables it can be seen that the energy of the anti Ci conformer is approximately 3 a.u. lower when using the 6-31G* basis set. However, since a different method and basis set was used, a direct comparison between the energies is inappropriate. The final energy for the B3LYP/6-31G* optimized conformer also compares very well with the literature value of -234.32879 2. The RMS gradient of the 6-321G* optimized conformer is smaller which implies that a more accurate and hence, stable minimum was discovered. This was expected since a higher level of theory was used which is evidenced by the calculation time which took significantly longer; 20 minutes compared to 50 seconds! By inspection of the jmols above, it can be seen that there is no noticeable change in structure between the two methods of optimization. However, a closer look reveals that the C4-C3-C2 and the C1-C6-C5 angles in the 3-21G conformer is smaller by about 0.5o compared with the same angles in the 6-31G* conformer. The angles have been depicted in the jmols. H10 and H11 are eclipsed (as well as H15 and H8). How close the vinyl and allyl protons get is dependant on the angle shown in the jmol. The larger the angle, the further away and hence, less repulsion. There was no change in the C6-C1-C2-C3 dihedral angle between both conformers. However there seems to be a small, but noticeable variation in the bond lengths between the different methods used which are also depicted on the jmols.
Anti B B3LYP/6-31G* optimized (and IR analysis)
<font="4">Vibrational analysis of Ci anti conformer
Below in fig.7 is the computed IR spectrum for the B3LYP/6-31G* optimized Ci anti conformer.

By inspecting the vibrational frequencies, it can be noticed that there were no negative frequencies, which implied that the structure is a minimum and NOT transition state. The frequencies were animated in Gaussview, and significant peaks (with high intesities) were analysed in fig.8. (note that the frequencies reported by Gaussian are only accurate to approximately 10 cm-1)

By examining the output file for the B3LYP/6-321G* optimized Ci conformer, fig.9 reveals important data such as the sum of zero point and electronic energies and sum of electronic and thermal energies amongst others. Fig.10 shows that the data was obtained from the thermochemistry section in the output file.
 |
 |
Tutorial 2 - Optimizing the chair and boat transition structures
In this tutorial, the transition state geometries for the boat and chair conformations were obtained. The chair transition state was obtained using two different methods, while the boat transition state was obtained using the QST2 method. Furthermore, the IRC was explored with the chair structure to see which conformer the end product adopted. Three different methods were used to achieve this and compared. Lastly, the HF/3-21G optimized boat and chair TS structures were further optimized using a higher level of theory: the B3LYP/6-321G* set. The activation barrier for the cope rearrangement was then determined and compared to experimental values.
Obtaining the chair TS
Two different methods were used to obtain the chair TS. Before each method can be employed, a ‘guess’ structure for the TS had to be drawn up in Gaussview. The first method used involved computing the force constant matrix of the guess structure (a.k.a. Hessian). The second method is the ‘frozen coordinate method’. The principle behind this is that the reaction coordinate is first frozen, then the geometry of the guessed TS structure is minimized. After this is complete, the reaction coordinate is unfrozen and the TS optimization is started.
<font="4">Obtaining the chair TS by calculating the force constant matrix
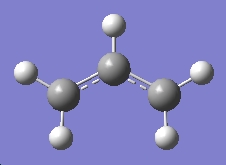
The first thing that had to be carried out was the geometry of the ‘guess’ structure. An allyl fragment was optimized at the HF/3-21G level as shown in fig. 11. 2 allyl fragments were then manually orientated, and certain bond distances optimized in such a way so as to mimic the true TS geometry as much as possible; as depicted in fig.12.
 |
 |
The appropriate input file, for the optimization of the TS geometry by calculating the Hessian, was created and the job submitted to Gaussian. Table 4 shows the summary and jmol for the Hessian optimized TS of the chair structure. The jmol highlights important geometric parameters such as the new C-C bonds. These parameters will be compared later on with the chair TS optimized using the frozen coordinate method.
 |
|
| |||
| Summary of Hessian optimized chair TS | Jmol of Hessian optimized chair TS | Vector displacements of imaginary frequency |
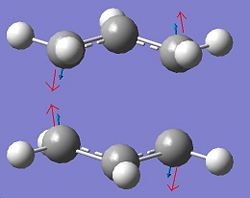
The job completed successfully and this is evidenced in table 4 which shows that only one imaginary frequency was obtained, indicative of a TS. Furthermore, the imaginary frequency was animated and it corresponded to the Cope rearrangement. The displacement vectors for this vibration are also shown in table 4. The fact that the correct chair TS was obtained denotes that the inital ‘guess’ structure was good enough.
Chair TS LOG file, Hessian optimized
<font="4">Obtaining the chair TS by employing the frozen coordinate method
The original ‘guess’ structure (from fig.12) was used, and the two terminal carbons of the allyl fragments, which form/break a bond, were frozen. The structure was then minimized to give the structure shown in fig.13.

The structure in fig.13 looks very similar to the chair TS using the Hessian method, which was expected. However, the bonds which were ‘frozen’ needed to be optimized as well. This was performed by ‘unfreezing’ the bonds and setting them as a derivative. The summary and jmol for the HF/3-21G optimized chair TS using the frozen coordinate method is shown in table 5. Again, the imaginary frequency obtained and its animation confirms that it is the correct TS, as illustrated earlier in table 4.
 |
| |||
| Summary of frozen coordinate optimized chair TS | Jmol of frozen coordinate optimized chair TS |
Comparison of the Hessian chair TS jmol with the frozen coordinate chair TS jmol shows that there is no visible change in structure using different methods. The energy difference and imaginary frequency between both TS structures is neglible, and the RMS gradient differs very slightly between the different methods used. In addition, the geometric parameters (illustrated in the jmols) are almost identical between the two methods.
Therefore, in this particular case, it can be seen that the method makes no noticeable difference to the structures obtained. This could be because the ‘guess’ structure was already a very accurate representation of the true TS geometry, so the method employed made no difference.
Chair TS LOG file, frozen coordinate optimized
<font="4">Obtaining the boat transition structure
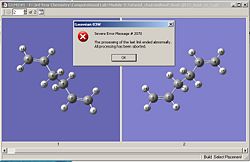
The boat transition state was optimized using the QST2 method. The QST2 method works by using the initial and final structures, and interpolating between them until a transition state is found. The reactant and product molecules were the Ci optimized 1,5-hexadiene structures obtained in the previous tutorial. Both molecules were oriented and labelled accordingly and the QST2 input file submitted. However, the job failed as shown in fig.14. The resulting structure obtained from the failed job is shown in the jmol below.
 |
| |||
| Fig.14 Failed job error message | Jmol of structure obtained from the failed job |
The jmol of the failed structure shows that one of the allyl fragments has been translated and the optimization procedure didn’t consider any rotation about the central bonds. In other words, the initial structures of the product and reactant molecules were too far away from the true TS for the program to successfully locate it.
Therefore, the structures of the reactant and product had to be further optimized to resemble the TS geometry more closely as shown in fig.15.

The structures in fig. 15 were then submitted for the QTS2 optimization to reveal the boat TS. The data, including the jmol, for the HF/3-21G optimized boat TS is shown in table 6. The jmol highlights important geometric parameters.
 |
| |||
| Fig.16 Boat TS summary | Jmol of boat TS |
The summary in fig.16 shows that only one imaginary frequency was obtained and corresponds to the Cope rearrangement (refer to table 4). Comparison of the geometric paramters between the chair and boat transition states reveals noticeable differences. The allyl fragment angle is approximately 1o larger in the boat TS as well as the distance between the allyl fragments being shorter by about 0.1Å.
Fig.17 compares the final energy and other parameters of the boat TS with the chair TS (frozen coordinate method). The frozen coordinate method chair TS was chosen since the RMS gradient was slightly lower, but the Hessian optimized chair TS could have just as well been chosen since the difference in energy is so small.

From fig.17 it can be seen that the boat is higher in energy by 43 Kjmol-1. this was expected because the boat TS suffers from higher torsional strain. The RMS gradient for both TS are very close to 0 which imply that both TS have been optimized efficiently. Comparison of the imaginary frequency for both TS reveal that the boat one is higher by 20 cm-1. The higher wavenumber usually implies a stronger bond when referring to bond stretching/bending. It is unsure how to compare the imaginary frequencies in this case since the negative frequency corresponds to the cope rearrangement process. However, it could be that the higher wavenumber for the boat TS implies more energy is needed to cause the rearrangement via the boat TS. This is logical given the higher energy of the boat TS.
It is impossible to determine what conformer the reaction will lead to just by inspection of the boat and chair TS. Nevertheless, there is a way of finding this out, and this is by following the minimum energy path along the potential energy surface until a minimum is reached. This is also known as the IRC which will be calculated next.
<font="4">Following the minimum energy path: the IRC
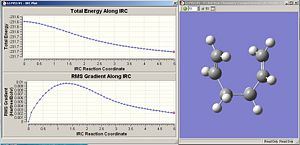
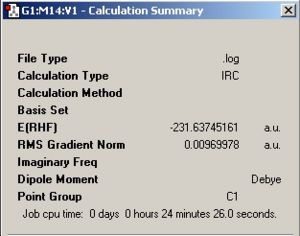
The IRC has been calculated starting from the chair TS. The chair TS was optimized using the frozen coordinate method. This was arbitrarily chosen since the RMS value was lower than the Hessian optimized one, but it wouldn’t make any noticeable difference either way. The IRC for the chair TS was calculated, where the number of points along the IRC was set to 50. Fig. 18 reveals the graphs which illustrate the IRC and the final product obtained as a result. Fig. 19 shows the summary of the final product. Interestingly, the conformation of the final product given adopts a gauche conformation, which is what was expected. However, the product is not a minimum which is evidenced by the relatively large RMS.
 |
|
| Fig.18 IRC graphs along 50 points | Fig.19summary of final product |
Three different methods were carried out to try and determine true minimum. The results from each method were then compared.
• Method 1 involved taking the last structure from the IRC and performing a simple optimization
• Method 2 consisted of recalculating the IRC, but setting more points along the path. The number of points were doubled to 100.
• Method 3 involved calculating the IRC, with 50 points, but making sure to calculate the force constant at every point.
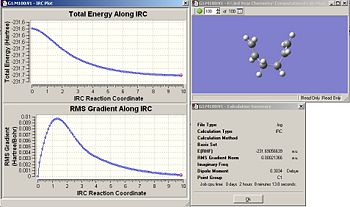
Each method has its own advantages and disadvantages, with method 3 being the most reliable, but taking the most time to calculate; whilst method 1 is the quickest but can be unreliable if the last structure obtained isn’t close enough to the true minimum. Fig. 20 to Fig 22 reveals the summary tables from each method, and fig. 23 reveals a table which sums up important data from each method.
 |
 |
 |
Analysis of fig.23 revealed some interesting results. The lowest energy product was obtained via method 1, whilst the highest energy product was obtained using method 3. The same trend is observed with the RMS values (method 3 being the highest and method 1 the lowest). This means that method 1 was the best method to use in this case. This was unexpected given that method 3 is supposed to be the most reliable method. However, it should be emphasised that the difference in each method, albeit noticeable, is very small. Interestingly, each method yielded a gauche C2 conformer as the product, and the energy of the conformer obtained in method 1 matches EXACTLY with the gauche2 conformer in appendix 1. Although no method managed to successfully give the lowest energy gauche3 conformer with C1 symmetry, the energy difference between the gauche2 conformer and gauche3 conformer is very small at 0.62 kcal/mol. Therefore, it is safe to state that each method was effective, as they gave one of the lowest energy conformers available.

<font="4">Optimizing the chair and boat TS using the B3LYP/6-31G* set
The chair and boat TS optimized using the HF/3-21G set were further optimized using the more accurate B3LYP/6-31G* set. The calculation summaries are shown in table 7 along with the vibrational frequencies to ensure that a TS has been obtained. The jmols are also shown with relevant geometric parameters highlighted. Reassuringly, the chair TS had a lower energy than the boat TS which was expected. In terms of structure, both the B3LYP and HF optimized transition states look identical. Closer inspection reveals that there is a slight variation in bond length and bond angles using different levels of theory (compare the jmols below with the previous ones optimized at the HF/3-21G level). The energy difference between the boat and chair transition states at the B3LYP/6-31G* theory is 36Kj/mol compared with 43 Kj/mol for the HF/3-21G level of theory. It can be seen that there is a noticeable variation in the energy difference using a different method and basis set, but this is accepted since the B3LYP/6-31G* set is more accurate.
LOG file for chair TS B3LYP/6-31G* optimized,LOG file for boat TS B3LYP/6-31G* optimized
| Summary | Jmol | ||||
| Chair TS |  |
| |||
| Boat TS |  |
|
The table shown in fig. 24 summarizes the optimized energy of the transition states and reactant at different temperatures and using different levels of theory. Note that the energies at 298.15K were calculated using the correction in the thermochemistry section found in the log files.

From fig.24, it can be seen that the energy of the reactant is always lower compared with its corresponding chair or boat TS which is logical. In addition, the energies of the transition states and reactant at 298.15K are significantly higher compared with the energies at 0K. Again, this was expected since at any temperatures above 0K, molecules have kinetic energy which needs to be taken into account.
<font="4">Calculating the activation energy
After acquisition of the total energies of the transitions states and most stable conformer of the reactant, the activation energy for the cope rearrangement could be calculated. The activation energy is simply the difference in energy between the TS and reactant. The activation energy gives a quantitative understanding of just how much energy the process requires in order to occur. The table in fig.25 compares the activation energy with the experimental values.

From fig.25 it can be seen that , for both levels of theory, the activation energy for the boat TS is higher than for the chair TS. This is expected given the higher energy of the boat TS. Also, it can be seen that the activation energies at 298K are almost equal to the ones obtained at 0K. This is logical since at room temperature, reactant molecules have higher energy, but so do the transition states. Since the activation energy depends on the energy difference, then if the energy of the transition state and reactant are raised by almost the same amounts, the activation barrier should remain fairly constant, irrespective of temperature.
If time allowed, it would have been interesting to calculate the energies of the transition states for a higher temperature, instead of just using the correction to see if this was the case.
The computed activation energies at 0K, using the HF/3-21G level of theory, do not compare very well with the experimental data. In contrast, the computed activation energies, using the B3LYP/6-31G* level of theory, match very well with the experimental data. The activation energy for the boat TS matches particularly well, as it is within the error range of the experimental value! This goes to emphasise just how much more accurate the B3LYP/6-31G* level of theory is compared with the HF/3-21G set. It also goes to show just how useful a tool computational chemistry is in determining parameters which match so closely to experimental data.
Exercise - Diels-Alder cycloaddition
In this exercise, what was learned in the previous tutorials has been applied. The transition state geometries for two different diels alder reactions have been found by calculating the force constant matrix. In addition, the molecular orbitals were analysed by assigning their symmetry (symmetric or antisymmetric) in order to explain which reaction path is allowed. The molecular orbitals have also been used to explain why the TS for the exo isomer is higher in energy for the second reaction. In this exercise, every TS structure was optimized using the B3LYP/6-31G* set since it gives more accurate results than Hartree-Fock.
<font="4">Ethene + cis-butadiene cycloaddtion
Cis butadiene and ethene were optimized using the B3LYP/6-31G* set. The resulting summary windows are shown in fig.26
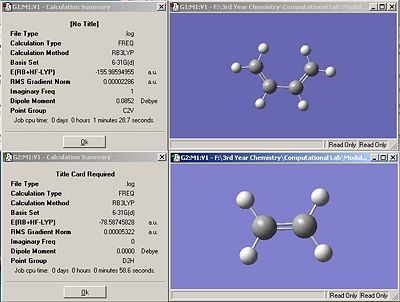
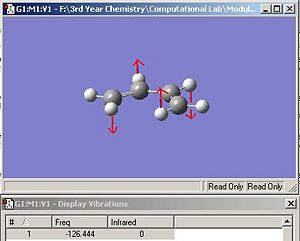
Interestingly, the optimization for cis-butadiene reveals a transition state, evidenced by the single imaginary frequency obtained. This frequency was animated, and it was noticed that it corresponded to the bending on the carbon skeleteon to make the molecule non planar, as shown in fig. 27. Therefore, the results implied that the planar cis-butadiene is a transition state and not a ground state. Further research was carried out to explain this, and UV studies concluded that the true ground state of cis-butadiene has a dihedral angle of +/- 15o 3. However, since the energy difference between the planar and bent structure is so minute, it has been regarded as insignificant and will make no difference to the molecular orbitals obtained.
FCHK file for ethene optimization and MO, B3LYP/6-31G*
FCHK file for cis-butadiene optimization and MO, B3LYP/6-31G*
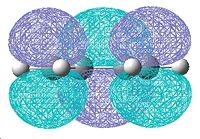
The molecular orbitals for cis-butadiene and ethene are shown below in table 8.
| HOMO | LUMO | |
| Ethene |  |
 |
| Cis-butadiene | 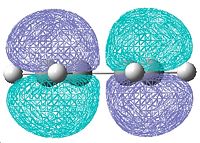 |
 |
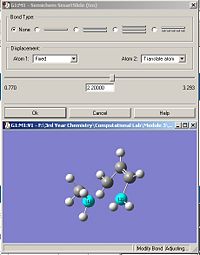
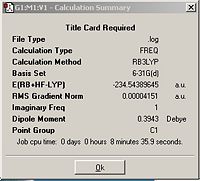
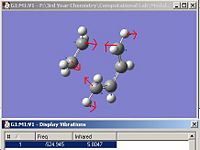
The transition structure was determined by calculating the force constant matrix, (Hessian) using the B3LYP/6-31G* set.Table 9 shows the 'guess' structure, jmol of the resulting TS as well as the calculation summary and the motion of the imaginary frequency. The imaginary frequency shows that it corresponds to the Diels-Alder addition and hence, the correct transition state has been obtained.
 |
 |
 |
| |||
| Optimizing the 'guess' structure | Optimized TS summary | Imaginary frequency of TS | Jmol of TS with C-C bond lengths highlighted. |
FCHK for the B3LYP/6-31G* optimized TS (IR and MO data included within the file)
The jmol of the TS highlights the partly formed C-C σ bond lengths as both being 2.27Å. It was expected that both partly formed C-C bond lengths are the same due to the concerted nature of the reaction. A typical sp3 C-C is 1.54Å, while an sp2 C=C is about 1.35Å and the VDW radius of a carbon atom is approximately 1.7Å. It can be seen that the partly formed C-C σ bond is significantly longer than a typical sp3 or sp2 C-C bond, implying that the 6 membered transition state begins to form when the ethene molecule is significantly further away than expected. In addition, it can be seen that the C=C bond from the ethene fragment is slightly longer than a typical sp2 C=C bond, implying that it is beginning to go from sp2 to sp3 at the TS. Similarly, the central C-C bond of the cis-butadiene is significantly shorter than a typical sp3 bond. This is logical since this bond is to become an alkene bond in the product, so it is expected that its bond length begins to decrease at the TS. By the animating the imaginary frequency (as illustrated in table 9) , it can be seen that the bond forming is synchronous. Again, this was expected due to the concerted nature of the reaction. Comparison with the lowest positive frequency of 140 cm-1 shows that the motions are unrelated. The lowest positive frequency consists of the rotation of the ethene fragment as shown in fig.28
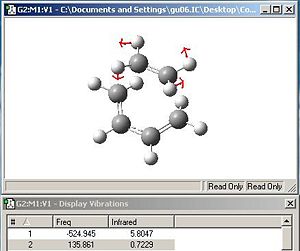
Fig. 29 and fig.30 reveal the HOMO and LUMO of the transition state structure.
 |
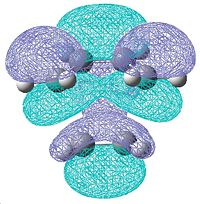 |
Interestingly, it was noticed that the HOMO orbital of the TS is symmetric, when it is supposed to be antisymmetric. Further inspection shows that the HOMO-1 is antisymmetric as shown in fig.31

The energies of the HOMO and HOMO-1 are almost degenerate, so it’s possible that the computational method listed them in the wrong order. It should be specified that the method employed only tends to minimize the energy of the whole molecule, and doesn’t optimize each orbital individually which could explain this anomaly. The TS was optimized again using the lower level of theory: semi empirical AM1 method to see if the order of the HOMO and HOMO-1 switched. Indeed, this is the case and the HOMO orbital with the AM1 optimized structure (see fig.32) matches with the HOMO-1 of the B3LYP/6-31G* optimized structure. CHK file for the AM1 optimized TS (MO and IR data included in file)
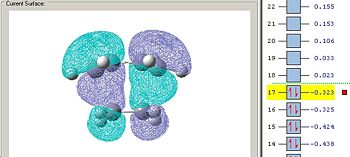
Again, the energies of the HOMO and HOMO-1 orbitals are very similar to each other for the AM1 optimized structure, which reinforces the point made about the computational method listing the orbitals in the wrong order. Inspection of the TS HOMO-1 orbital (from the B3LYP/6-31G* optimized TS), and the MOs in table 8, it can be seen that the LUMO of ethene and the HOMO of cis butadiene are responsible for the antisymmetric HOMO-1 orbital (which should be the HOMO orbital as stated earlier). As a result, the reaction is allowed given that there is significant orbital overlap between the ethene LUMO and cis-buadiene HOMO orbitals.
<font="4">Cyclohexa-1,3-diene and maleic anhydride Diels-Alder cycloaddition
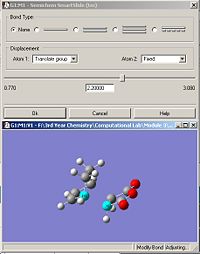
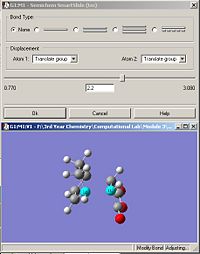
Both TS structures for the endo and exo have been optimized by calculating the Hessian using the B3LYP/6-31G* set. The 'guess' structures for the exo and endo TS are listed in fig. 33 and fig. 34 respectively.
 |
 |
The jmols of the optimized endo and exo TS structures are shown below in table 10, along with important parameters highlighted. The summary windows are also showed in table 10.
| Summary | Jmol | ||||
| Exo TS | 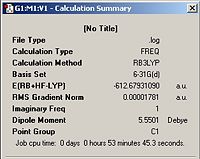 |
| |||
| Endo TS | 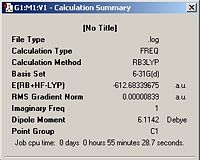 |
|
FCHK file for B3LYP/6-31G* optimized endo TS (includes MO and IR data)
FCHK file for B3LYP/6-31G* optimized exo TS (includes MO and IR data)
From the summary windows in table 10, it can be seen that the energy of the exo TS is higher in energy by approximately 11Kj/mol. By inspection of the jmol structures, it can be seen why the exo TS is higher in energy. It is due to steric clash between the maleic anhydride fragment and the –CH2CH2- bridge . In the exo TS, the –CH2CH2- bridge lies directly above the maleic anhydride fragment, whereas it points away from it in the endo structure. The HOMO orbitals for the endo and exo structures are shown below in table 11.
| HOMO orbital | |
| Exo TS | 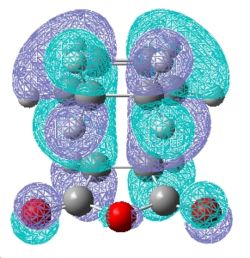
|
| Endo TS | 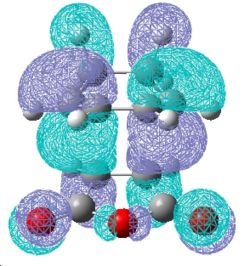
|
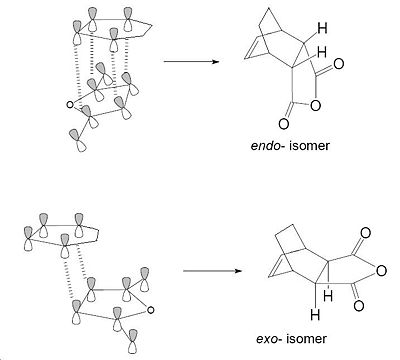
Examination of the nodal properties in table 11 reveals that there is one major node through the middle of the TS complex for both the endo and exo transition states. Further inspection reveals that the nodal properties of both transition states are equal. The through space distance between the -C=O-CO-C=O- fragment and the opposite CH2CH2 of the exo is 3.33Å (depicted in jmol as well). In contrast, the through space distance between the -C=O-CO-C=O- fragment and the opposite C=C bond for the endo is 3.27Å. This implies that the secondary orbital effect is significant for the endo structure due to the closer proximity of the maleic anhydride to the alkene bond which allows for a larger amount of unfavourable orbital overlap. The secondary orbital effect is depicted in Fig.354 and reveals why the secondary orbital effect is significant for the endo TS. To conclude, steric factors for the exo TS dominate over increase of unfavourable orbital interactions for the endo TS, and therefore this explains why the exo TS is higher in energy.
Conclusion for module 3
In this module, two different tutorials were completed. The first one revolved around finding the most stable conformer of a molecule, and directly linked with the second tutorial which involved finding the transition states of the boat and chair conformations using different methods. The IRC was then explored using three different methods and compared with each other. This yielded unexpected results, but it was possible to rationalise them. The data gained from both tutorials were then combined in order to calculate the activation energies for both the boat and chair TS. This was done successfully as the computed activation barriers, using the B3LYP/6-31G* set, were in very good agreement with the experimental values. Consequently, two different Diels-Alder reactions were explored. The first one involved finding the transition state for the cycloaddition reaction involving ethene and cis-butadiene. The TS was computed successfully, evidenced by vibrational analysis, and the molecular orbitals analysed to notice that the HOMO orbital wasn’t antisymmetric as it should be. This was explained in the relevant section earlier on, and it was due to the HOMO and HOMO-1 orbitals being so close in energy which resulted in them being ‘swapped’ when the B3LYP/6-31G* set was used. The last Diels-Alder reaction involved finding the TS for an exo and endo isomer. This was carried out successfully, again, evidenced by vibrational analysis. It was discovered that the exo isomer was higher in energy, and this was rationalised by taking into account steric repulsion, which dominated over secondary orbital effects for the endo isomer. Overall, this module was successful and proves how powerful computational chemistry is in determining transition state geometries.
References
1. Brandon G. Rocque, Jason M. Gonzales, Henry F. Schaefer, 'An analysis of the conformers of 1,5-hexadiene', Molecular Physics, 2002, Vol. 100, NO. 4, 441-446
2. Olaf Wiest, Kersey A. Black, and K. N. Houk, J. Am. Chem. Soc., 1994, 116 (22), 10336-10337,DOI:10.1021/ja00101a078
3. M. E. Squillacote, R. S. Sheridan, O. L. Chapman, and F. A. L. Anet,J. Am. Chem. Soc., 1979, 101 (13), 3657-3659, DOI:10.1021/ja00507a042
4. Image adapted from the following source: http://www.umd.umich.edu/casl/natsci/chem/decamp/c226/Secondary%20Orbital%20Overlap.pdf
