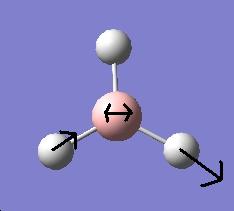
Rep:Mod:xienzato1234
Computational Lab: MODULE 2
From: Gabriele Uliana
Section 1 - Introduction
In this introduction section, the molecules BH3 and BCl3 have been explored using Gaussview. Both molecules have been optimized and compared using computational techniques which considers the quantum chemistry of the molecules.
<font="6">Optimization of BH3
Gaussian was used to optimize the geometry of BH3 using the B3LYP method and 3-21G basis set.
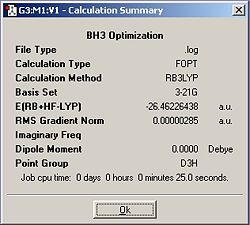
By displaying the summary window in Gaussview for the optimized borane molecule, various data about the molecule can be obtained such as the calculation type, file type, dipole moment etc. Refer to fig.1 which displays the information. The summary lists the final energy to 8 decimal places, but the calculation method and basis set used is not good enough to report a value with such accuracy. Given that the energy computed is accurate to approximately 1 Kj/mol and 1 a.u.= 2625 Kj/mol , then it follows that the energy reported is only accurate to about 0.0004 a.u. (or 4 decimal places). Other relative errors include the dipole moment which is only accurate to about 0.01 D; bond distances accurate to approximately 0.01 Å; frequencies accurate to about 10cm-1 and bond angles accurate to about 0.1o.
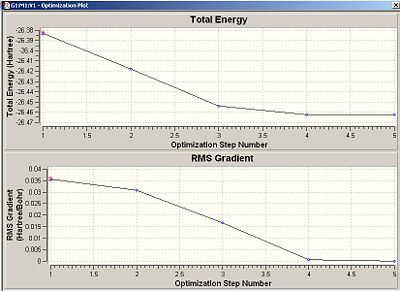
Fig.2 shows how Gaussian went through the optimization procedure via the ab-initio method. Ab-initio works by solving the Schrödinger equation with varying R, which is a function of all the bond distances in the molecule. R is then changed and the equation solved again to find the new energy. If the new energy is lower, then the system ‘heads in that direction’ until the minimum energy is found. If the program reaches a gradient of 0 in the total energy graph, then the equilibrium structure has been resolved as there is no net force acting on the molecule! The program works by aiming to minimise the gradient of the PES graph in order to get as close to the equilibrium structure as possible. Ab-inito takes into account quantum mechanics, stereoelectronics and takes longer; but gives a more accurate description. Molecular mechanics (MM2), which is what Chem3D uses, only uses a classical model. It uses a ‘ball and stick’ like model and treats the bonds as springs. It optimizes the structure purely based on minimising the force between the bonds and spatial arrangement, but disregards electronic factors.
|
 |
 | |||
| Jmol of optimized BH3 | Fig.1 Calculation summary of optimized BH3 | Fig.2 Graphs showing optimization procedure |
'
<font="4">The optimized B-H bond length= 1.19Å =0.119nm
The optimized H-B-H bond angle = 120o
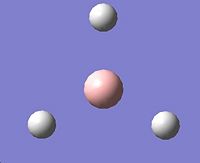
Fig.3 shows that the first structure in the optimization procedure has no bonds! This is because Gaussview represents bonds based on a pre-defined value. If the atoms are further apart than that set distance, then Gaussview will not draw a bond between the atoms, even if a bond is truly present. In reality, a chemical bond (covalent/polar covalent bond to be more precise) exists if there is electron density between the atoms concerned. In other words, the electron density never falls to 0 anywhere in between the nuclei of the atoms.
<font="6">Optimization of BCl3
Next, the BCl3 molecule was optimized using the LanL2MB options which contains the medium level D95V basis set for the first row atoms, and pseudo potential Los Alamos ECP basis set for heavier elements. The pseudo potential basis set is a special function which models the core electrons and assumes that they don’t participate in bonding, which is a a very accurate approximation. The basis sets used for BCl3 are more accurate than the one for borane, since it takes into account the extra electrons the Cl atoms contributes.
The optimized BCl3 is shown in jmol below along with the calculation summary in fig.4 (symmetry set to D3H and tollerance to 'very tight' before the molecule was optimized). Note that the relative error approximations, which were described earlier on for the borane molecule, must also be taken into account when analysing the values in the calculation summary for BCl3.
|
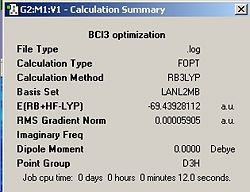 | |||
| Jmol of optimized BCl3 | Fig.4 Calculation summary of optimized BCl3 |
<font="4">The optimized B-Cl bond length= 1.87Å =0.187nm
The optimized Cl-B-Cl bond angle = 120o
It can be seen that the B-Cl bond length is larger than the B-H bond length by approximately 0.7Å. This is expected since the Cl atom is larger and hence, has a much larger atomic radius than H, which will result in a greater bond distance. Although the computed final energies cannot be used to compare the two molecules, since a different basis sets were used, it is estimated that the energy of BCl3 will be much lower. This is because the the B-Cl bond has larger ionic character as a result of the higher electronegativity of the Cl atom, which means a stronger bond and hence lower total energy of the molecule.
Both molecules are planar and have the same bond angle of 120o, noting that the point group was already predetermined for BCl3 before the optimization. This is expected given that both molecules are simple enough to comply with the VSEPR model which predicts a planar geometry and optimal angle of 120o for minimal electrostatic repulsion.
The overall dipole moment obtained for both molecules is 0 and is expected because the individual dipole moment vectors from the B-Cl and B-H bonds cancel each other out.
<font="6">Conclusion for section 1
The ab-initio method was used to successfully optimize the geometry of BH3 and BCl3. The concept of pseudo-potentials had to be applied for BCl3 by introducting the more accurate D95V and Los Alamos ECP basis sets. It also simplifies the calculation by assuming the core electrons are not involved in bonding. The data obtained from the resulting optimized geometries were what was expected, and were justified using various chemical arguments. Furthermore, various relative errors were discussed briefly which will be taken into account when reporting figures throughout this module.
Section 2- Vibrational analysis and molecular orbitals
Note that the “ find information about BCl3 “ part was analysed in the introduction section since it was more appropriate.
<font="4">Geometry optimization of H2O
The small molecule that was chosen to be optimized is water because it is arguably one of, if not the most, important compound known to man. A water molecule was drawn on Gaussview and the initial bond length and angle stated as 0.96Å and 109.5o respectively (refer to fig 5 and fig 6). The displacement of the oxygen atom was fixed before optimization.
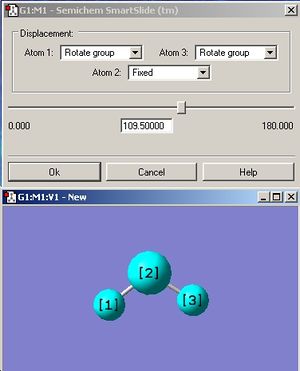
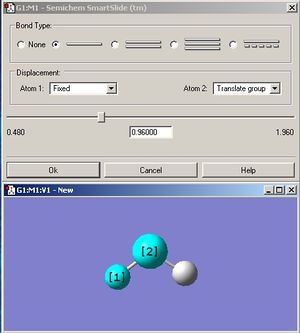

Since water contains an oxygen atom which is on the first row, then a pseudo potential basis set is not necessary. The optimization for the water molecule was first calculated using the least accurate 3.21G basis set. Then, the resulting output was further optimized using the more accurate 6-31G(d.p) basis set, which takes into account the polarization of the oxygen and hydrogens. Finally, the even more accurate 6-311+G(d,p) basis set was used to optimize the water molecule.
The results from the optimization procedure are summarized in the table shown in fig.7 , and the jmol of water optimized using the 6-311G(d,p) basis set.
Output file for water 321G optimized
Output file for water 631G(d,p) optimized
Output file for water 6311G(d,p) optimized
From the third optimization in fig.6 , it can be seen that the bond length of 0.96 Å matches exactly with the predefined starting value (refer to fig 5). However, this isn’t the case when considering the bond angles. The preset value of 109.5o implies a perfect, sp3 tetrahedral geometry between the O-H bond and lone pairs, which in reality, is not the case. The bond angles from all the optimizations reveal that they are approximately 6o less than the non optimized value. This is because optimization takes into account the fact that the oxygen lone pairs exert a greater repulsion than the O-H bonding pairs and hence, decrease the H-O-H bond angle. Also, all the data obtained from the three optimization methods shows that they are all relatively close to each other. This is expected because water is a simple molecule which doesn’t require very advanced computational techniques in order to obtain reliable results. The xyz coordinates for the 6-311G(d,p) optimized water molecule are shown in fig. 8.

optimizedwater |
<font="4">Vibrational Analysis of borane
The previously optimized molecule of borane in the introduction section was used to calculate the vibrational modes. The final energy value obtained after the frequency calculation matched exactly with the final energy value obtained after the initial optimization (refer to fig.1) which suggests that the structures are the same. In addition, no negative frequencies were obtained which indicates that the structure is a minimum (see fig. 9).

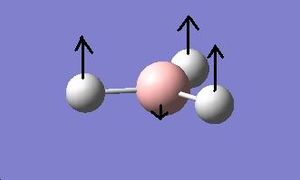
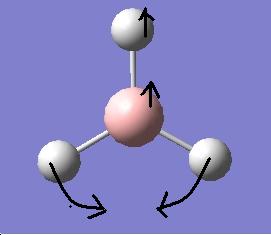
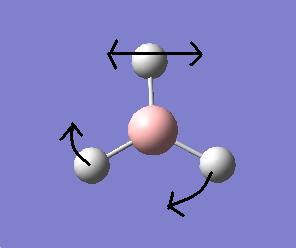
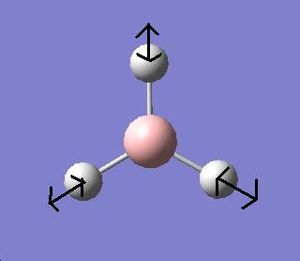
Table 1 highlights all the form of vibrations of borane and their corresponding symmetry label. Note that the frequencies have been rounded to the nearest ten given that Gaussian reports them with accuracy of approximately 10 cm-1.The symmetry labels for each vibration were obtained from the frequency optimized output LOG file as shown in fig.10.
LOG file for borane frequency calculation

The computed IR spectrum of borane is revealed in fig.11
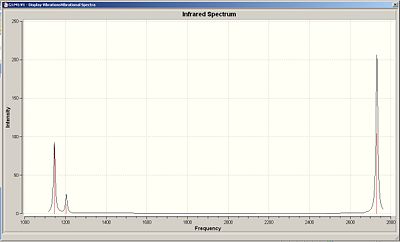
The spectrum clearly shows 3 peaks when 6 peaks are expected according to the vibrational modes obtained. Vibrations 2 and 3 are degenerate and hence, overlap in the spectrum to give one peak. The same is true for vibrations 5 and 6. Vibration 4 does not give a peak because the vibration does not cause a change in dipole moment. Therefore, vibration 1 gives one peak, vibrations 2 and 3 give one peak and vibrations 5 and 6 give one peak to produce a total of 3 distinguishable peaks in the computed IR spectrum.
<font="4"> Molecular orbitals of borane
The qualitative MO diagram for borane is shown in the following pdf file: Qualitative MO diagram for diagram The MO diagram was not drawn on chemdraw since it was a lot more practical to draw it out neatly on paper and scanning it. Table 2 below shows the computed molecular orbitals for borane.
| MO Number | Computed MOs | Energy/eV | Symmetry Label | |
| 1 |  |
-6.730 | 1a' (core orbital) | |
| 2 |  |
-0.517 | 2a1' | |
| 3 |  |
-0.356 | 1e' | |
| 4 | 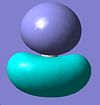 |
-0.356 | 1e' | |
| 5 |  |
-0.074 | 1a2" | |
| 6 |  |
0.188 | 2e' | |
| 7 |  |
0.188 | 2e' | |
| 8 |  |
0.191 | 3a1' |
Checkpoint file for the MOs of borane
Overall, the computed MOs match very well with the qualitative ones. MO 1 represents the non-bonding boron 1s orbital which is very low in energy compared to MO 2-8. MO1 is not represented in the qualitative MO because only the valence electrons are of interest. MO 2-5 are in very good agreement with their corresponding MOs in the qualitative diagram (2a1’, 1e1’(a), 1e1’ (b), and 1a2’’ respectively). The relative energies (ordering) also corresponds accordingly. MO6 doesn’t match as well with its corresponding 2e’ (b) orbital in the qualitative diagram. In contrast, MO7 matches very well with its corresponding 2e’ (a) MO in the qualitative diagram. MO 8 is in decent agreement with the 3a1’ MO in the qualitative diagram, however, the qualitative MO implies that there should be much more electron density around the boron atom compared with the hydrogens, which is not seen in MO8. The relative energies (ordering) of MO 6-8 do not match with the qualitative 3a1’ and 2e’ orbitals. The qualitative MO diagram assumes the 3a1’ orbital being lower in energy than the 2e’ orbitals, while the order of MO6-8 is the opposite. Due to the similar energies of MO6-MO8 (0.188 eV and 0.191 eV), it is difficult to determine what the correct ordering is for a qualitative MO diagram. However, based on the assumption that s-s interactions are stronger than s-p interactions, it would make sense to assume that the 3a1’ orbital lies above the degenerate 2e1’ orbitals. Comparison of the computed MOs with the qualitative diagram shows that qualitative MO theory is a very accurate and useful tool.
<font="4">Conclusion for section 2
In this section, useful computational techniques were employed to calculate the stretching frequencies of borane. This was useful as it provided the IR spectrum and in addition, confirmed that the geometry was optimized properly. The molecular orbitals of borane were then computed and compared to a qualitative MO diagram. There was a very good resemblance between the MOs calculated and the ones depicted using the principles of MO theory, which proves how useful MO theory is in predicting not only the molecular orbitals, but the chemical properties which derive from them.
Section 3 - Cis/Trans Isomerism of Mo(CO)4L2 where L=P(CH3)3
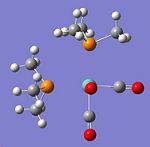
The cis and trans isomers of Mo(CO)4P((CH3)3)2 were first drawn on Chem3D and MM2 minimised to get a quick, basic geometry optimization. The resulting MM2 optimized geometries were then opened using Gaussview, and the input files created using the B3LYP method and pseudo potential LANL2MB to obtain a rough approximation of the geometries. A loose convergence criteria was set instead of normal convergence, where convergence relates to the first derivative of the energy. This is because the higher accuracy of the normal convergence means that the calculation will not converge as the limit will never be reached. The input files for the cis and trans isomers were sent to SCAN overnight. Interestingly, when the output files were opened in Gaussview ready for the second optimization step, it was noticed that the P-Mo bonds were missing in both isomers, as depicted in fig. 12 and fig. 13. This is because the bond length calculated is larger than the predefined value Gaussian has and hence, the program thinks there is no bond when in fact there is!
 |

|
| Fig.12 Cis isomer | Fig.13 Trans isomer |
The resulting LANL2MB optimized geometries were then further optimized using the LANL2DZ pseudo-potential and basis set, which is more accurate. However, this time, the normal convergence criteria was employed because a much more accurate basis set and pseudo-potential was used. Both input files were sent to SCAN again, where the LANL2DZ optimized cis and trans geometries were obtained. Again, the P-Mo bonds are not shown as described earlier, so they were added manually for clarity. The jmols of the LANL2DZ optimized cis and trans isomers are shown below.
|
| ||||||
| Fig.12 B3LYP/LANL2DZ optimized Cis isomer | Fig.13 B3LYP/LANL2DZ optimized Trans isomer |
D-space link for Trans isomer B3LYP/LANL2MB optimized
D-space link for Trans isomer B3LYP/LANL2DZ optimized
D-space link for Cis isomer B3LYP/LANL2MB optimized
D-space link for Cis isomer B3LYP/LANL2DZ optimized
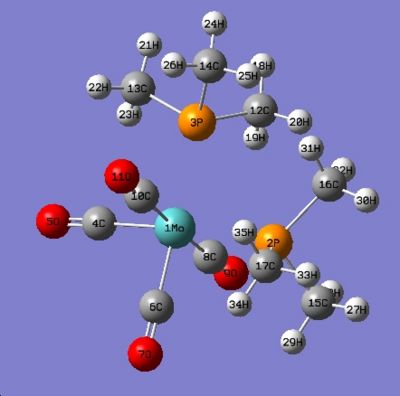
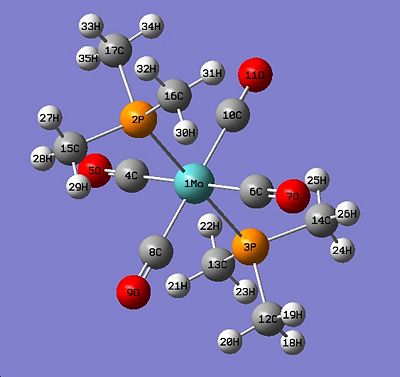
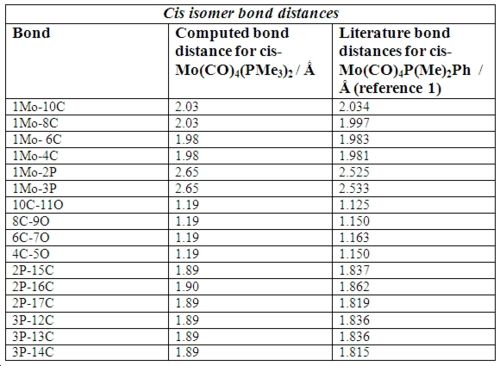
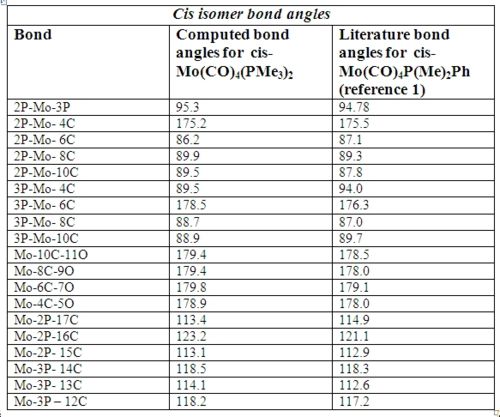
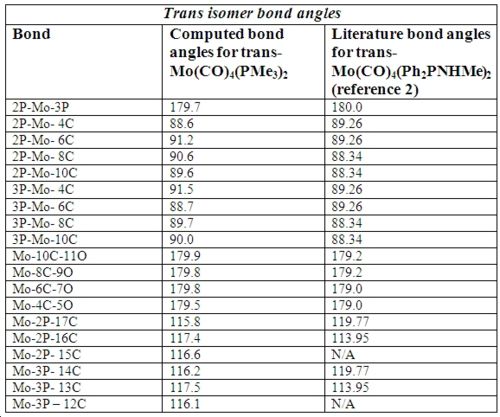
Below in fig 14,15,16,17 are the tables which compare the optimized bond lengths and angles for the cis and trans isomers with the literature values. The data for the cis isomer was compared with the compound cis-Mo(CO)4P(Me)2Ph while the trans isomer was compared with trans-Mo(CO)4(Ph2PNHMe)2. Unfortunately, the literature data for trans-Mo(CO)4P(Me)2Ph could not be found due to time restrictions. The literature complexes do not match exactly with the one being investigated, but they are very similar and good enough to check if the computational method employed produced an optimized geometry.
 |
 |
| Labelled Cis isomer | Labelled trans isomer |
 |
 |
 |
 |
Analysis of cis isomer bond angle and bond length:
Upon first inspection, it can be seen that the computed values match very well with the literature values. This implies that the optimal geometry has been computed successfully. There is a small difference between the average Mo-C bond lengths in the literature which this is most likely due to statistical reasons1. In addition, the Mo-C bond lengths of the carbonyl ligands trans to another carbonyl ligand are longer (2.03Å) than those trans to the P(CH3)3 ligands (1.98Å). The reason for this is that CO ligands are better π-acceptors than P(CH3)3 ligands . When the CO ligands are trans to each other, they compete for electron density in the same 4d orbital of Mo 2. Therefore, the amount of backbonding is reduced which results in a slightly longer bond.
The bond angles are what were expected with no major anomalies. However, one interesting case is the 2P-Mo-3P bond angle which comes at 95.3o. The corresponding literature bond angle also agrees with this, at 94.78o which means that it cannot be a computational error. The reason why the bond angle is significantly greater than the expected 90o is due to interligand steric interactions between the PMe3 ligands 1. This interaction is the major contributor to the distortion experienced by the complex. Hence, cis-Mo(CO)4(PMe3)3 adopts a slightly distorted octahedral geometry.
Analysis of trans isomer bond angle and bond length:
Again, a very good correlation can be seen between the computed values and the literature values. Note that the ‘N/A’ values listed in the tables are due to the literature compound having a P-N bond instead of a third P-C bond, so a direct comparison is not appropriate. If time allowed, it would have been interesting to replace a Me group for a nitrogen containing group, which would have allowed for a full comparison. The bond length values are what were expected, with all the Mo-C and CO bond lengths being equal since every carbonyl is trans to another carbonyl. The Mo-P bond lengths in trans-Mo(CO)4(PMe3)3 are shorter compared to cis Mo(CO)4(PMe3)3 which is most likely due to the PMe3 ligands being trans to each other 2. All bond angles match well with the literature, and there are no anomalies or unexpected values which needed to be mentioned.
Table 3 compares the energies of the two isomers.
| Energy of Trans isomer/ Kjmol-1 | Energy of Cis isomer/ Kjmol-1 |
| -2030449 | -2030457 |
Table 3 shows that the cis isomer is thermodynamically more stable by 8 Kjmol-1. This is unexpected because the cis isomer should be less stable given that the bulky P(Me3) ligands are closer to each other. However, when phosphine ligands are involved, it seems that the factors which influence the trans conformation are entropy or environmental factors and NOT “steric vs electronic” effects 3.
<font="4"> How can the relative ordering of cis and trans isomers be altered?
This could be achieved in a few ways:
• The equilibrium towards the trans isomer can be induced by using very bulky ligands, with large cone angles. The complex will then be forced to adopt a trans conformation in order to minimise steric clash.
• The equilibrium can be shifted to the cis isomer by using ligands that can interact favourably with each other when in close proximity. An example of this would be if intramolecular hydrogen bonding is present between the two ligands. For instance, one of the Me groups on one PMe3 ligand could be replaced by NH2, and a Me group on the other PMe3 ligand can be changed to CF3 to see if H bonding is strong enough for the complex to adopt a cis conformation and override sterics.
• The cis isomer can also be favoured by using ligands that have phenyl rings which can result in favourable π-stacking interactions 4.
<font="4">Vibrational analysis
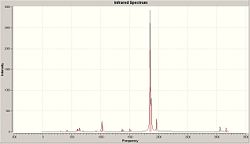
The computed IR spectra for cis and trans Mo(CO)4(PMe3)2 are shown in fig. 18 and fig. 19 respectively. No negative frequencies were obtained for either compound which means that both geometries are at a minimum and have been optimized efficiently.
 |
 |
| Fig. 18 Computed IR spectrum of the cis isomer | Fig.19 Computed IR spectrum of the trans isomer |
IR Analysis for cis-Mo(CO)4(PMe3)2
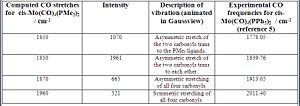
Analysis of the computed IR spectrum for the cis compound shows that there are 4 different CO vibrational modes. Fig 20 summarizes these vibrational modes.
From fig.20, it can be seen that the same number of CO vibrational modes were obtained as the experimental. In addition, the computed vibrational frequencies correspond closely to the experimental which suggests that the cis-Mo(CO)4(PMe3)3 structure has been optimized properly. Note that the two computed frequencies at 1850 cm-1 are NOT degenerate vibrations due to the difference in intensity. Also, each vibration gives rise to a net change in dipole moment, which explains why each one has a significant intensity and can be identified in the computed IR spectrum (fig. 18)
IR Analysis for trans-Mo(CO)4(PMe3)3
Analysis of the computed IR spectrum for the trans compound shows that there are 3 distinct CO vibrational modes (two modes are degenerate!). Fig.21 summarizes these vibrational modes. The two CO stretches at 1840 cm-1 are degenerate since they have the same intensity and frequency. In contrast, the stretches at 1850 cm-1 in the cis isomer are NOT degenerate due to the lower symmetry of the cis isomer which results in two different chemical environments for the carbonyls. However, in the trans isomer, all carbonyls are equivalent and hence, only one peak is seen in the computed IR spectrum. The frequencies at 1880cm-1 and 1950cm-1 are ignored due to their very low intensity, given that the stretches result in no net change in dipole moment.
Comparing the results obtained to the experimental values shows that there is an inconsistency. The IR spectrum obtained only shows one peak which is responsible for the degenerate stretches at 1840 cm-1, however, the experimental values imply that two peaks are seen. The only conclusions that can be drawn from this are: either the computational program has failed to identify an important CO stretching frequency, or the experimental IR contains some cis-Mo(CO)4(PPh3)2 impurities which is more likely.

D-space link for Cis isomer IR frequency calculation
D-space link for trans isomer IR frequency calculation
<font="4"> Conclusion for section 3
In this section, the geometries of cis and trans Mo(CO)4(PMe3)2 have been optimized to a high degree and is evidenced by the computed geometric parameters agreeing very well with experimental literature values of similar compounds. This was taken further, and the vibrational frequencies calculated for the cis isomer matched very closely with the experimental. However, the same could not be said for the trans isomer, but that is most likely due to experimental error as described earlier, rather than a computational error or limitation. Overall, this section was carried out successfully and proves how useful the comparison between computational and experimental chemistry can be.
References
1. F. Albert. Cotton, Donald J. Darensbourg, Simonetta. Klein, and Brian W. S. Kolthammer, Inorg. Chem., 1982, 21 (1), 294-299,DOI:10.1021/ic00131a055
2. Gary M. Gray and Yalin Zhang, Journal of Crystallographic and Spectroscopic Research, Vol. 23, No. 9, 1993, 711-717
3. Dennis W. Bennett, Tasneem A. Siddiquee, Daniel T. Haworth, Shariff E. Kabir and Farzana K. Camellia, Journal of Chemical Crystallography, Vol. 34, No. 6, June 2004, 353-359
4.Leeni Hirsivaara , Matti Haukka , Jouni Pursiainen , Inorganic Chemistry Communications 3, 2000,508–510
5. Gabriele Uliana, Experiment S5 report, Identification of geometrical isomers of [Mo(CO)4(L)2] by IR spectroscopy, March 2008
Section 4 - The quantum nature of ammonia
In this section, the symmetry of ammonia is explored as well as its inversion mechanism. In addition, the vibrational spectrum has been computed and compared with the literature.
All structures have been optimized using the B3LYP method and 6-31G basis set. Below are the screenshots of the summary windows for optimized ammonia with C3V, D3h and C1 symmetry.
LOG file for C1 optimized ammonia B3LYP/6-31G
LOG file for D3h optimized ammonia B3LYP/6-31G
LOG file for C3v optimized ammonia B3LYP/6-31G
 |
 |
 |
| Ammonia C1 summary | Ammoina D3h summary | Ammonia C3v summary |
From the three summary windows, it can be seen that the symmetry did make a difference to the final structures obtained. The C1 and C3v symmetries both adopt a trigonal pyramidal structure, but the D3h symmetry adopts a perfectly planar conformation. In terms of calculation time, it seems that the symmetry does affect it, albeit by a small amount. The C3v structure was the quickest, taking 1 min 4 seconds, while the longest was the C1 structure taking 1 min 39 seconds. It seems that the larger the deviation of the starting symmetry is from the ground state structure of C3v, the longer the calculation time. Having a starting geometry of C3v means that the computer has less work to do given that the most optimized structure of ammonia has C3V symmetry. It seems that a molecule cannot break symmetry during an optimization. This conclusion was reached by animating the optimization procedure in Gaussview for each symmetry structure and it was noticed that each optimization step conserved the symmetry of the molecule. This means that if a structure with a high symmetry is entered to be optimized, it will take less time to calculate (relative to a similar molecule with lower symmetry) since the program has less ‘flexibility’ in terms of what parameters it can vary. In addition, since the program cannot break symmetry, it means that the correct minimum might not be identified. So, the calculation takes less time, but the true ground state geometry might not be obtained.
The lowest energy geometry is the D3h structure. The energy difference between the D3h and C3v structures is 0.90 Kj/mol, while the energy difference between the D3h and C1 structures is 0.91Kj/mol. The numbers obtained correspond to the activation energy required to invert the ammonia molecule. The energy difference of the isomers is not significant given that thermal energy at room temperature is kTNa/1000=(1.3807x10^-23 x 298 x Na)/1000= 2.5Kj/mol. Therefore, at room temperature, the isomers have more than enough thermal energy to interconvert between one another.
<font="4">Optimization of ammonia using a better method and basis set
Both the D3h and C3v structures were optimized using the more accurate MP2 method and 6-311+G(d,p) basis set. The summary windows are shown below in fig. 22 and fig. 23.
 |
 |
| Fig. 22 Ammonia C3v summary MP2/6-311+G(d,p) | Fig. 23 Ammoina D3h summary MP2/6-311+G(d,p) |
Comparison of the calculation times shows that for C3v, the calculation time is 8 seconds longer with the MP2 method and 6311-G(d,p) basis set. For D3h, the calculation time is 25 seconds longer using the more accurate MP2 method and 6311-G(d,p) basis set. The results are logical since using more accurate methods and basis sets should result in a longer calculation time. The barrier height to inversion is defined as: E(D3h)-E(C3V)= 20kj/mol (reminder that energies reported by Gaussian are only accurate to 1kj/mol). The energy difference between the D3h and C3v is approximately 19kj/mol greater when using the MP2/6-311+G(d,p) set compared with the B3LYP/6-31G set. The energy difference between the methods and basis sets goes to show just how much more accurate the MP2/6-311+G(d,p) set is. The result of 20kj/mol compares very well with the experimentally determined barrier of 24.3Kj/mol 6.
LOG file for MP2/6-311+G(d,p) C3v ammonia
LOG file for MP2/6-311+G(d,p) D3h ammonia
<font="4">Monitoring the inversion mechanism
The downloaded nh3_scan_log file from the website reveals the "reaction path" for the inversion of ammonia. The graphs shown in fig.24 below reveal how the energy changes with varying ‘scan’ steps, which is related to the angle between the N-H bonds and the C3-N-H axis.
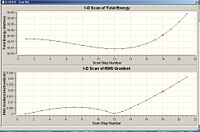

The most stable geometry is at scan step 12 with an energy of -56.5760 a.u (refer to fig. 25). Starting from the first scan (corresponding to the D3h transition state), it can be seen that the energy gradually decreases in a non linear sense, as the angle decreases, until a minimum is reached at scan 12. Scan 12 corresponds to the most stable C3v state and hence, the ground state of ammonia. As the angle keeps decreasing, the energy then rises in a steep fashion. This is expected because the N-H bonds get too close to each other which leads to a dramatic increase in electronic repulsion.
<font="4">Vibrational analysis
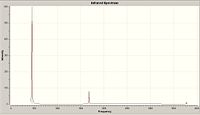
Below are the IR spectra and computed frequencies for the B3LYP/6-321G optimized C3v and D3h structures.
 |
 |
 |
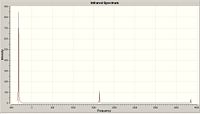 |
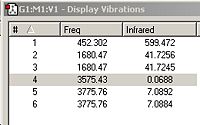
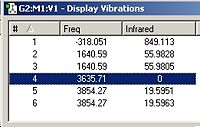
From fig. 26, it can be seen that the C3v structure has 6 positive vibrational frequencies. This confirms that the C3v structure is a minimum. In comparison, the D3h structure has 1 negative vibrational mode (and 5 positive). The 1 negative vibrational mode, at -320 cm-1, confirms that the D3h structure obtained is a transition state. By animating each vibration in Gaussview, the following vibrations have the same character of motion:
Referring to fig 26 and fig 27; vibration 1 in C3v matches with 1 in D3h. Vibration 2 in C3v matches with 2 in D3h. Vibration 3 in C3v matches with 3 in D3h. Vibration 4 in C3v matches with 4 in D3h. Vibration 5 in C3v matches with 6 in D3h and vibration 6 in C3v matches with 5 in D3h.
LOG file for the computed IR frequencies for C3v ammonia
LOG file for the computed IR frequencies for D3h ammonia
Fig. 30 compares the computed vibrational frequencies for C3v with the experimentally obtained frequencies for ammonia.
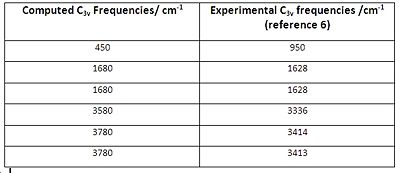
It can be seen from fig. 30 that the first computed frequency of 450 cm-1 does not compare well with the experimentally determined value of 950 cm1. However, all other frequencies match reasonably well, especially the degenerate 1680cm-1 vibrations. The vibrations which follow the inversion reaction path are the 450 cm-1 in the C3v and -320 cm-1 in the D3h structure. This was determined by animating the vibrations in Gaussview, and it can be seen that both of them are the same, and consist of the ammonia molecule inverting from C3v to D3h and back to C3v.
<font="4">Conclusion for section 4
In this section, the quantum nature of ammonia has been explored by following the reaction path. Different symmetries of ammonia were optimized using a low level basis set and method, and noticed how Gaussian never breaks the symmetry during an optimization procedure. The C3v and D3h structures were then optimized using a more accurate method and basis set, and this made a large difference to the energy of inversion obtained, which matched very well with the experimental value. Furthermore, the reaction path was monitored and graphical data was obtained which related the energy to each ‘scan’ step. Lastly, the vibrational frequencies were calculated and saw that they were in reasonably good agreement with the experimentally determined values.
References
6. P. Schwerdtfeger, L.J. Laakkonen and P. Pyykko.,"Trends in Inversion Barriers of Group 15 Compounds. I. Group 15 Hydrides.", J. Chem. Phys. , 1992, 6, 6807.
Section 5 - My own mini project – Synthesis of an aryl chromium tricarbonyl complex, based on the 3rd year organic synthesis lab course!
<font="4"> Why was this mini project chosen?
This particular mini project was chosen because it is directly related to the 3rd year organic synthesis lab. It also revolves around a very fascinating and expanding area which is arene activation. Aromatic rings are usually unreactive towards nucleophiles and research has shown that complexation to group 7 carbonyl complexes decreases the electron density of the aromatic ring and therefore, increases reactivity towards nucleophiles 9 . In this project, three different chromium tricarbonyl arene complexes have been characterised with different substituents on the aromatic ring. Strong resonance donors on the ring such as OMe show that nucleophilic substitution on the meta position is strongly favoured 8. Referring to the reaction schemes in fig. 31, only reaction 1 was carried out experimentally in the lab, using anisole. Therefore, it was interesting to computationally carry out reaction 2 and 3, using different π-donor substituents on the ring, and comparing the results obtained with reaction 1. It should be noted that OMe is a better resonance donor than F and Cl due to an increase in orbital overlap between the oxygen lone pair and the arene p orbitals, in addition to the lower electronegativity of oxygen compared with F and Cl.

<font="4"> Energy opimization
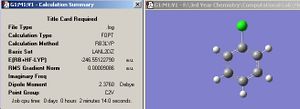
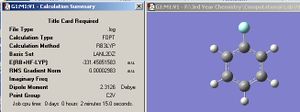
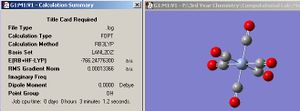
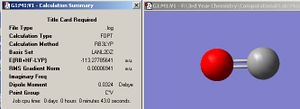
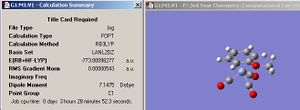
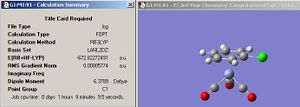
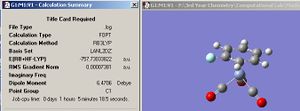
Each component involved in this project had to be fully optimized before computing the IR spectrum and analysing the geometric parameters. The reactants were also optimized so the enthalpy of reaction can be calculated later on. Fluorobenzene and anisole were first optimized using the B3LYP/321-G then B3LYP/6-31G(d,p) and lastly using B3LYP/LANL2DZ. Since chlorobenzene contains chlorine, it was first optimized using B3LYP/LANL2MB followed by B3LYP/LANL2DZ. Chromium hexacarbonyl, complex A,B and C (refer to reaction scheme) were first optimized using the B3LYP/LANL2MB set followed by the more accurate B3LYP/LANL2DZ. Lastly, CO was optimized using the B3LYP/LANL2DZ method. Fig 31 to fig 38 reveals screenshots of the summary tables for the fully optimized reactants and products.
From the data obtained, it can be seen that the RMS gradient for each compound is very close to 0 which implies that a minimum geometry has been obtained. In addition, all the vibration frequencies for complexes A, B and C are positive (refer to vibrational analysis section) which reinforces this. The dipole moment values for complex A, B and C are 7.15D, 6.38D, 6.47D respectively. If we’re considering the electronegativites of the substituents (F>Cl>OMe), then the trend obtained with the dipole moments doesn’t seem to match. However, when dipole moments are concerned, it is very difficult to rationalise the trends when a relatively complicated molecule is concerned since a complete electron density map is needed to make an accurate analysis. Since all the products and the reactants were all optimized using the same method and basis set (B3LYP/LANL2DZ), then it is possible to calculate the enthalpy of reaction. The enthalpy of reaction is calculated by: [Energy of complex + (3 x energy of CO)] – total energy of reactants. Table 3 summarises the total enthalpy change for each reaction.
| REACTION NUMBER | ENTHALPY OF REACTION / Kj/mol |
| 1 (Anisole complex) | 352 |
| 2 (Chlorobenzene complex) | 366 |
| 3( Fluorobenzene complex) | 374 |
The enthalpy values obtained are all positive and large, which is what was expected, since the reaction is highly endothermic given that the reaction mixture needed to be refluxed at a high temperature for 24 hours. The reaction is endothermic because of the very strong Cr-C bonds which need to break to release carbon monoxide, before the arene complexes to the metal. It should be noted that there is a strong entropic contribution to the reaction seeing as 3 carbon monoxide molecules are released per metal complex. Interestingly, the trend shows that the more electron rich the arene is (anisole is more electron rich than chlorobenzene, which is more electron rich than fluorobenzene), then the lower the enthalpy of reaction and the more thermodynamically stable the resulting complex is. If chromium was in a high oxidation state, then this trend can be easily explained as the increase in electron density would stabilise the metal centre. However, Cr is in the d0 state, and so that rationale cannot be employed. More research is needed to justify this trend.
Another interesting find, regarding the comparison between the optimized geometries, is with the orientation of the substituent on the arene ring relative to carbonyl below it. It is best to illustrate this by examining the dihedral angles in the jmols below of the B3LYP/LANL2DZ optimized geometries.
|
|
| |||||||||
| B3LYP/LANL2DZ optimized complex A | B3LYP/LANL2DZ optimized complex B | B3LYP/LANL2DZ optimized complex C |
By orienting the Jmol molecules so that you are viewing down through the chromium-arene ring internuclear axis, an anomaly can be noticed. While complex A and C have the substituent almost eclipsing the carbonyl below it, complex B has the chlorine atom slightly ‘skewed’ away from it. The dihedral angle of approximately 8o shows that this is significant enough to point out. A possible explanation could be that since the Cl atom is the largest in size compared with oxygen and fluorine, its electron pairs are diffused enough to clash with the electron density in the vicinity of the carbonyls and hence, forcing the aromatic ring to adopt a slightly staggered conformation. This effect is briefly recognised in reference 10, but the paper doesn’t go into any detail as to why this phenomenon is seen. If time allowed, it would have been interesting to do more research to find out what the answer is.
There was an error when trying to publish the optimization results on D-space. After clicking on 'publish', the following error message shows up in fig 39. Therefore, instead of producing the D-space link, I have provided the output files instead.

output file for complex A B3LYP/LANL2MB optimization, output file for complex A B3LYP/LANL2DZ optimization
output file for complex B B3LYP/LANL2MB optimization, output file for complex B B3LYP/LANL2DZ optimization
output file for complex C B3LYP/LANL2MB optimization, output file for complex C B3LYP/LANL2DZ optimization
<font="4">Analysing the vibrational frequencies
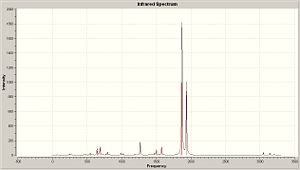
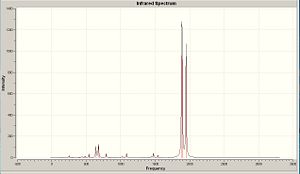
Fig 40 to fig 42show the computed IR spectra for complex A, B and C. Upon first inspection, the IR spectra look very similar to each other, which isn’t surprising due to the similarities between the compounds. Furthermore, no negative frequencies were obtained which imply the optimized structures are at a minimum.
 |
 |
 |
'
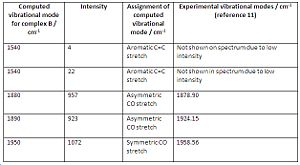
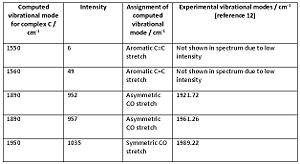
The total number of vibrational modes computed for complex B and C are 51, yet for complex A its 63. This can be easily explained by taking into account the extra methyl group in complex A which will contribute extra vibrational modes. By animating each vibration of complex A in gaussview, the following vibrational modes, in cm-1, were found to be exclusive to complex A, involving mostly the participation of the methyl group: 60,170,210,240,990,1020,1150,1510,1520,3050,3140,3210. The vibrational modes 60cm-1 to 1520cm-1 correspond to bending modes, whilst 3050cm-1 to 3210cm-1 correspond to stretching modes. If those frequencies are ignored, then complex A will have a total of 51 vibrational modes like complex B and C which is logical. Fig. 43 to fig. 45 shows a table that compares the significant vibrational modes to experimental data. The following are the experimental IR spectra for all the complexes: Complex A IR10, Complex B IR11, Complex C IR12
Comparison between the computed CO vibrational frequencies with the experimental ones shows that they are in very good agreement with each other. The spectrum for complex A shows that there is a significant amount of anisole impurity (confirmed by proton NMR analysis: Complex A proton NMR) because of the aromatic C=C stretches being clearly distinguishable. The C=C stretches should NOT be visible in complex A, due to their negligible intensity, which is a direct consequence of the arene ring being bound to the metal. The C=C stretching frequencies were mentioned in the first place, despite their very low intensities, to prove that the aromatic ring loses a significant amount of electron density when complexed to the chromium. Hence, computational vibrational analysis has managed to provide direct evidence for the increased tendancy of the arene ring to undergo nucleophilic substitution.
Can any trends be spotted from the IR spectra of the complexes?
It is interesting to see that the computed CO stretching frequencies are slightly lower in complex A compared with complex B and C. The same trend is confirmed with the experimental values. Given that the benzene ring in complex A is more electron rich than the arene in B and C (due to OMe being a better resonance donor), it is possible that this is reflected by having a slight increase in the electron density at the metal centre. The small increase of the electron density at the metal centre could result in an increase in backbonding to the carbonyls which would weaken the CO bond (decrease the bond order) and hence result in a lower wavenumber.
D-space link for Complex A IR and molecular orbital analysis
D-space link for Complex B IR and molecular orbital analysis
D-space link for Complex C IR and molecular orbital analysis
<font="4">Geometric Parameters
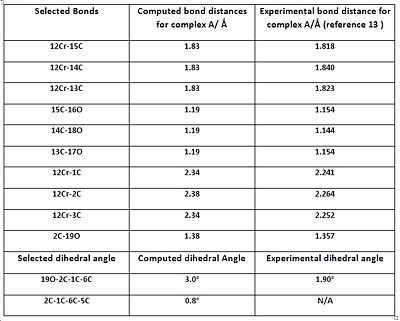
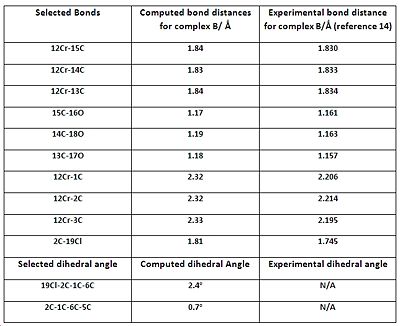
In this part, selected bond lengths and dihedral angles are listed for complexes A, B and C and compared to the literature.
|
|
| |||||||||
| B3LYP/LANL2DZ optimized complex A | B3LYP/LANL2DZ optimized complex B | B3LYP/LANL2DZ optimized complex C |
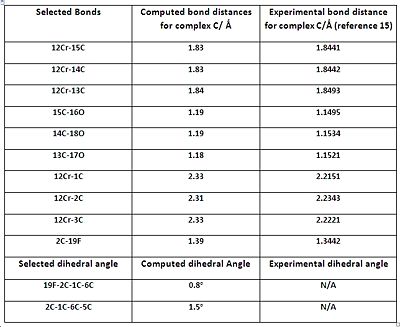
The geometric parameters comparison tables show that the majority of the computed bond lengths match the experimental values to 1 decimal place, with the exception of the Cr-C(arene) bond lengths. Therefore, there is a satisfactory agreement to the literature, implying that the geometries of all the complexes have been optimized correctly. The computed data shows that the Cr-CO and C=C bond lengths (C=C data not listed on tables to save space) are relatively unchanged throughout the complexes. This implies that altering the substituent on the arene ring has no significant effect on those bonds. The computed C-O (carbonyl) bond lengths also appear to be constant throughout the complexes, with small perturbations which are most likely due to statistical reasons and accuracy limitations of the computational method. The experimental C-O (carbonyl) lengths do vary between the complexes, but the difference is too small (in the order of 0.01 of Å) to decide whether it’s due to variation in the amount of backbonding or statistical factors.
However, the listed Cr-C (arene) bonds for all complexes, illustrated in the corresponding jmols above, reveal something unusual. The bond lengths are NOT the same, which implies that the arene ring is NOT planar. This observation is also amplified with the experimental data which reveals an even larger difference between the bond lengths, compared with the computed values. The 19X-2C-1C-6C dihedral angles, also shown in the jmols above, reveal something intriguing. It was noticed that the C-X bond (where X=OMe, F or Cl) is NOT planar with respect to the aromatic ring, and is bent AWAY from the metal centre; most likely a direct consequence of the arene ring not being perfectly planar. The dihedral angles show that it is a very small deviation from planarity, but the phenomenon was seen for all the complexes which prompted further investigation...
Research showed that the unexpected phenomena mentioned (non planarity of arene and bending of the C-X bond) are known to arene chromium tricarbonyl complexes. A beautiful paper published by A.D. Hunter and co-workers 13 explains that the amount (and relative direction) of bending depends on whether a π-acceptor or π-donor substituent is present on the ring.
The paper concludes that presence of a π-donor substituent will result in the C-X bond to bend AWAY from the Cr centre, while a π-acceptor substituent will result in the C-X bond to be more planar, or in the more extreme case, bend TOWARDS the Cr centre. These observations have been rationalised in terms of electronic effects, with heavy focus on particular resonance forms, and not in terms of sterics. All the computed dihedral angles show that the C-X bonds are pointing AWAY from the ring, and this is in agreement with the literature, since all the substituents are π-donors. The paper states that the better the π-donor, the bigger the 19X-2C-1C-6C dihedral angle. Indeed, computational chemistry seems to triumph again as the 19O-2C-1C-6C dihedral angle is almost quadruple that of the 19F-2C-1C-6C angle; remembering that OMe is a much better π-donor than F.
Looking back at the end of the 'energy optimization' part, which talked about the ‘skewed’ chlorobenzene ring , it is possible that the C-X and arene bending phenomena could be related to it. However, further research needs to be done in order to clarify this.
<font="4">Analysis of the molecular orbitals
The aim of analysing the molecular orbitals was to find evidence to suggest why the meta positions of the arene rings are more susceptible to nucleophilic substitution when π-donor substituents are used, as experimental data concluded 8. In addition, relevant MO for all three complexes have been examined to see if there are any significant differences between them.
The frontier orbitals (and other relevant orbitals) for complex A were animated using Gausview and analysed. They are depicted in table 4 below. After animating the corresponding oribtals for complexes B and C, it was noticed that they look almost identical to complex A, and so they haven’t been included. It was expected that the molecular orbitals looked so alike given the structural similarity between the complexes.
| MOLECULAR ORBITAL FOR COMPLEX A | IMAGE OF MO | ENERGY/eV |
| HOMO-1 |  |
-0.218 |
| HOMO |  |
-0.216 |
| LUMO |  |
-0.056 |
| LUMO +1 |  |
-0.046 |
Unfortunately, analysis of the frontier MO diagrams doesn’t answer the question of why nucleophiles prefer meta attack. It was hoped that either the LUMO or LUMO+1 would reveal a noticeable lack of electron density at the meta position compared to the ortho and para. However, the molecular orbitals do show that there is a significant amount of antibonding character around the arene ring, which implies the higher reactivity of the ring.
More interestingly, is the lack of electron density in the arene ring at the HOMO and HOMO-1 orbitals. This confirms the literature findings which states that arene rings complexed to group 7 carbonyl complexes are more susceptible to nucleophilic attack9.
Table 5 compares the energies of the HOMO and LUMO orbitals for all the complexes.
| COMPLEX | ENERGY OF HOMO/eV | ENERGY OF LUMO/eV |
| A | -0.216 | -0.056 |
| B | -0.228 | -0.068 |
| C | -0.229 | -0.070 |
Table 5 shows that the energy of the frontier orbitals is highest for complex A and lowest for complex C. These results could be explained by taking into consideration the electronegativities of the arene substituent. Given that fluorine is the more electronegative substituent, it is expected that the energies of the orbitals in complex C are relatively stabilised compared to B and A.
<font="4">So... why is nucleophilic attack favoured at the meta position?
In order to answer this question, a quantitative measure of the electron density on each carbon atom in the arene is needed. This information was obtained in the ‘Population analysis’ section from the LOG files of the B3LYP/LANL2DZ optimized geometries. Fig. 49 to fig. 51 reveals the information for each complex.
The highlighted values in fig. 49 to fig. 51 correspond to the relative electron density on carbon atoms in the arene ring. Carbon atom 4 and 6 correspond to the meta positions. Ignoring the ipso carbon (carbon 2), it can be seen that the electron density is lowest in carbon 4 and 6 in complexes B and C. For complex A, the relative electron density is lowest on carbons 3,4 and 6 (again, ignoring the ipso carbon as it’s not relevant in this analysis). It is unusual to see that carbon 3 is the most electron deficient in complex A It’s possible that it could be due to the accuracy of the method employed which results in an anomaly.
Overall, however, this data confirms that the electron density is lowest on the meta positions which corresponds to the literature findings that conclude nucleophilic attack is more prone to occur in the meta position.
This conclusion could be explained by considering the aromatic resonance forms. Given that all the arene substituents used are π-donors, then it follows that the ortho and para positions have a formal negative charge, whereas the meta positions remain neutral. Hence, the meta positions are relatively electron deficient compared to ortho and para, and this effect is amplified when the arene ring is complexed to the metal.
<font="4">Conclusion for the mini project
Firstly, the energies for all the complexes had to be optimized before carrying out any further calculations. Given that everything was ultimately optimized using the B3LYP/LANL2DZ method, it was possible to calculate the enthalpy of reaction. The vibrational frequencies were then calculated and confirmed that the complexes were optimized to a minimum due to the absence of negative frequencies. In addition, vibrational analysis revealed an interesting trend regarding the carbonyl stretching frequencies; which showed how the electron density in the arene ring might have a direct effect on the amount of backbonding present in the carbonyl. The geometric parameters for all the complexes were then analysed and compared to experimental values. For all the complexes, it was noticed that the arene ring and the C-X bond was not planar as expected. Furthermore, the calculations showed that the better the π-donor the substituent is, the bigger the deviation from planarity. Research confirmed that this is a well known feature of arene tricarbonyl metal complexes and was briefly explained. Inspection of the frontier orbitals confirmed that the arene ring is relatively electron deficient and agrees with the experimental findings. The computed energies of the frontier orbitals reveal that the their energy decreases with increasing electronegativity of the substituent. Unfortunately, due to the structural similarities between the complexes, the MOs didnt reveal any interesting trends and so, the output files were examined to see if any quantitative information could be found regarding the electron density around each atom in the arene ring. Indeed, the ‘population analysis’ section revealed the relative electron density present at each atom, and it was noticed how the meta positions were the most electron deficient, which matched experimental predictions. Overall, the mini-project was successful and proves how useful and powerful computational chemistry is in predicting various trends between similar compounds.
References
8.M. F. Semmelhack, G.R. Clark,J.L. Garcia, J.J. Harrison, W. Wulff and A. Yamashita, Tetrahedron, Vol 37. No. 23.,1981, 3957-3965.
9. D.A Widdowson, Phil. Trans. R. Soc. Lond A, 326,1988, 595-610
10. Gabriele Uliana, Experiment 1, Organic Synthesis lab autumn term, 2008
11. Spectrum reproduced with permission from Natasha Keasberry
12. Spectrum reproduced with permission from Elaine Koh
13. Allen D. Hunter, Lonni Shilliday, W. Scott Furey, and Michael J. Zaworotko,Organometallics, 1992, 11 (4), 1550-1560,DOI:10.1021/om00040a027
14. Alan K. Brisdon, Ian R. Crossley, Robin G. Pritchard and John E. Warren, Acta Crystallographica Section C Crystal Structure Communications, 2003,DOI:10.1107/S0108270103013787
15.Matthias Zeller, Allen D. Hunter, Cynthia L. Perrine and John Payton, Acta Crystallographica Section E, 2004,DOI:10.1107/S1600536804009250
Conclusion for module 2
The start of module to focused on optimizing the geometries on relatively simple compounds, and how to extract significant data such as the total energy, point group and so on. Vibrational and molecular orbital analysis was then carried out on borane. Cis-trans isomerism in an octahedral complex was consequently explored, and compared various geometric parameters with experimental values of similar compounds to check if the calculated values were sensible. The quantum behaviour of ammonia was then explored and witnessed how computational chemistry managed to provide the ‘reaction path’ for the inversion mechanism. An interesting mini-project was chosen regarding chromium tricarbonyl arene complexes. Every technique learned in this module was applied to see the effects on the structure of the complex by varying the arene substituent. Various interesting trends were spotted throughout the mini project and every effort made to explain why they occurred, where possible. This module has highlighted just how useful computational chemistry is, ranging from predicting IR spectra to the prediction of very subtle trends between similar compounds.

