Rep:Mod:wyc08mod2
Module 2: Bonding (Ab initio and density functional molecular orbital
Objectives
Computational Chemistry gives insight into structure and bonding or chemical bondings and it is seen in Module 1 how well it works in organic systems. For inorganic compounds and complexes, it is not as straight forward. Some major computational techniques used in inorganic systems including optimisation, predicting IR spectra and generation of molecular orbitals (MOs) etc., are illustrated below with analysis.
Part 1 Learning new things
Optimisation and finding minimum structures
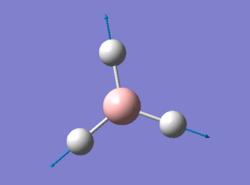
Borane BH3
In Gaussview 5.0, a BH3 molecule was created and optimised. Prior to optimisation, in the trigonal planar BH3 molecule, each BH bond length was set to 1.5Å. Optimisation was then carried out by setting corresponding commands on Gaussian Calculation setup. Under the DFT, B3LYP method and basis set 3-21G were chosen to optimise the ground state of this BH3 molecule. Upon opening the resultant log output file, results were obtained and the summary is shown below in table 1.
| BH3 |
| |||
| File Type | .log | |||
| Calculation Type | FOPT | |||
| Calculation Method | RB3LYP | |||
| Basis Set | 3-21G | |||
| Final Energy / a.u. | -26.46226438 | |||
| RMS Gradient Norm / a.u. | 0.00000285 | |||
| Dipole Moment / Debye | 0.000 | |||
| Point Group | D3h | |||
| Job Time / s | 8.0 | |||
| Final B-H Bond Length / Å | 1.194 | |||
| Final H-B-H Bond Angle / o | 120.0 |
The optimised bond length and H-B-H bond angle matches well with literature results[1]. To confirm that the optimisation has carried out successfully, it is important to check whether the forces are converged (See image below). And when the forces are converged, the gradient should be very close to zero, i.e less than 0.001.
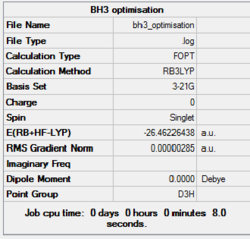

Gradient obtained is 0.00000285 a.u. in the case of BH3. To further investigate what optimisation has done to the molecule, we looked at the optimisation plots: (1) Plot of Total energy against Optimisation Step Number and (2) Plot of RMS Gradient against Optimisation Step Number. The plots show how energy and gradient change over the optimisation, together with an animation of the optimisation steps. The very first structure of the BH3 molecule does not have any bonds. This shows that the B-H bond lengths exceeds the the pre-defined value imposed by Gaussview. And as expected for a fully optimised molecule, the last structure has the most negative energy and the smallest gradient.
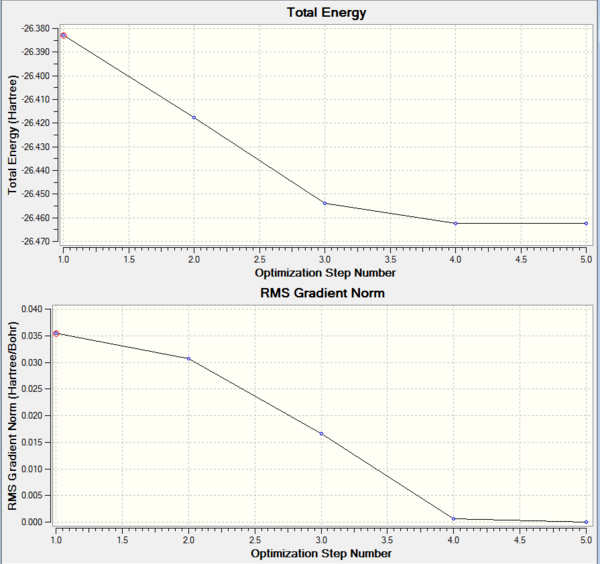
When carrying out an optimisation, we are trying to do is to solve the Schrödinger equation for the nuclear positions and electrons and find the position R which gives us the lowest energy E(R). In a potential energy curve, this will be the minimum, showing that the molecule is at a stable state with atoms arranged in equilibrium positions. At this stable point, the gradient will also be zero. Therefore, optimisation plots obtained from Gaussview show the program traversing the PES of BH3, searching for the minimum energy structure as depicted in the total energy plot and a zero gradient as depicted in the RMS (Root Mean Square) gradient plot. From the plots obtained, we can see that the BH3 molecule was optimised across five steps until the gradient becomes significantly small (very close to zero).
Pseudo-potentials and Basis sets
It is also noteworthy to understand the concept of pseudo-potentials and basis sets in the light of computational chemistry. When dealing with elements in the second row or above, we have to consider the relativistic effects exhibited by them due to an increasing number of electrons in their atoms. These effects cannot be recovered by the standard Schrödinger equation and is when the pseudo-potential comes into play. Pseudo-potential (PP) is a special function which allows accurate and easy modelling of core electrons in atoms by recovering some of these relativistic effects. The assumption that it is the valance electrons that dominate in bonding interactions is thus still valid even when dealing with elements in 2nd row or above. Basis sets, on the other hand, determines the number of functions used to describe the electronic structure. The more basis sets used, the better fit obtained and hence accuracy of calculations. Yet, in the expense of time.
The use of pseudo-potentials together with larger basis sets is illustrated with the following example:
TlBr3
A Thallium bromide molecule was created and its point groups was set to D3h, alongside an increase in tolerance from default to 'very tight (0.0001)'. Optimisation was then carried out using Gaussian. What is different from the case of BH3 is the use of basis set; the LanL2DZ basis set is used. It is a medium level basis set: D95V on first atoms and Los Alamos ECP (i.e pseudo potentials) on heavier elements. Results obtained from optimisation are summarised in table 2.
| TlBr3 |
| |||
| File Type | .log | |||
| Calculation Type | FOPT | |||
| Calculation Method | RB3LYP | |||
| Basis Set | LANL2DZ | |||
| Final Energy / a.u. | -91.21812851 | |||
| RMS Gradient Norm / a.u. | 0.00000090 | |||
| Dipole Moment / Debye | 0.000 | |||
| Point Group | D3h | |||
| Job Time / s | 10.0 | |||
| Final Tl-Br Bond Length / Å | 2.651 | |||
| Final Br-Tl-Br Bond Angle / o | 120.0 |
Again, a gradient of 0.00000090 a.u. indicates that the optimisation has run to completion. The calculated bond Tl-Br bond length and Br-Tl-Br bond angle are 2.651Å and 120.0o (trigonal planar structure). Comparison to experimental values[2], (Tl-Br bond length = 2.52Å, bond angle = 120o) shows that we can be reasonably confident with the computational data obtained. Similar to BH3, the real output file is checked to confirm that forces are converged.

Vibrational analysis and confirming mimima
Full output files of vibrational analysis: BH3:File:WYC08 BH3 FREQ.LOG TlBr3:File:WYC08 TLBR3 FREQ.LOG.LOG
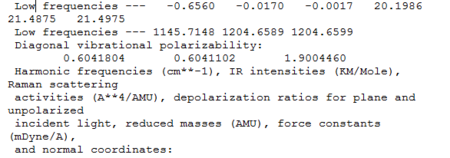
We know that optimisation helps us to find the most stable structure, corresponding to the minimum point of the potential energy curve. A frequency (vibrational) analysis helps to confirm that we actually have minimum structures. It is like the second derivative of the potential energy surface (a positive frequencies indicates a minimum). Frequency analysis was carried out on Gaussian for both BH3 and TlBr3. In the output file, the part starting with the line 'low frequencies' tells the calculated vibrational modes and frequencies (See figure). Table 3 and 4 summarises data obtained.
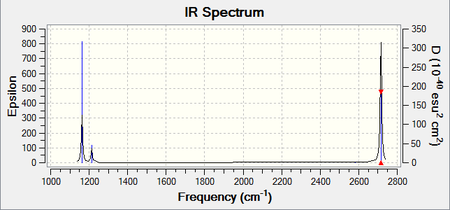

BH3
For BH3, although there are six distinct vibrations, resultant IR spectum only shows 3 peaks. This is because 2 sets of degenerate vibrations plus one 1 vibration frequency with zero intensity, due to no overall dipole change in A1' vibrational mode. The ground state structure of BH3 has a D3h symmetry.
TlBr3
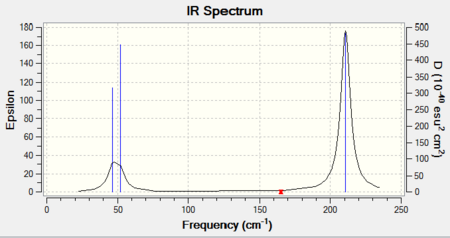
In the frequency analysis of TlBr3, it is important to use the same basis set as what was used to carry out optimisation (LANL2DZ). Otherwise, calculations would have been done to a different level of accuracy and no comparison could be made between data. The 'low frequencies' data could be found in the output log file (see below). The lowest 'real' normal mode is found to be at 46cm-1. (See Table 4 for full assignments of point groups.)
In the IR spectrum, again, less peaks are shown compared to the number of vibrations due to the presence of degenerate vibrations: 46cm-1 and 211cm-1. Also, one of the vibrations (A1') gives zero intensity, due to no overall dipole change in vibration. Generally speaking, TlBr3 has vibration frequencies lower than that of BH3 as atoms involved in TlBr3 are much heavier.
Bonding in Gaussian
When performing calculations in Gaussian, the bond may disappear. This is indeed a constraint imposed by the programme: when the bond length exceeds the data recorded in the Gaussian database, the programme will then not consider it as a bond. This is a common when dealing with inorganic compounds as database records mostly bond length data of organic molecules.
So what is a bond? Bonding is described as an attraction between two atoms or more which allows formation of various chemical substancs. Such attraction is coulombic, either between electrons and nuclei, or as a result of dipole attraction. Bond is categorised into various types: ionic, covalent and metallic bondings are examples of 'strong' bonds while intermoelcular forces like Van der Waals forces would be considered as weak force. Bonding is also considered from a molecular orbital perspective. We would also describe bonding between atoms as interactions between corresponding atomic orbtials. An atomic orbital essentially represents the electron distribution of that atom in a 3D space. When atomic orbitals of two atoms interact, a new molecular orbital (MO) will be formed. LCAO approach is used to generate MOs qualitatively (see Molecular Orbitals section) while real MOs are computed. However, it is important to understand orbitals as 'electron densities' in space. And subjected to the uncertainty principle, MOs only tell you a probability of finding electrons; momentum and position can not be determined at the same time. MO reflects electron rich and electron poor regions of the molecule and thus allows predictions of chemical reactivity.
Molecular Orbitals
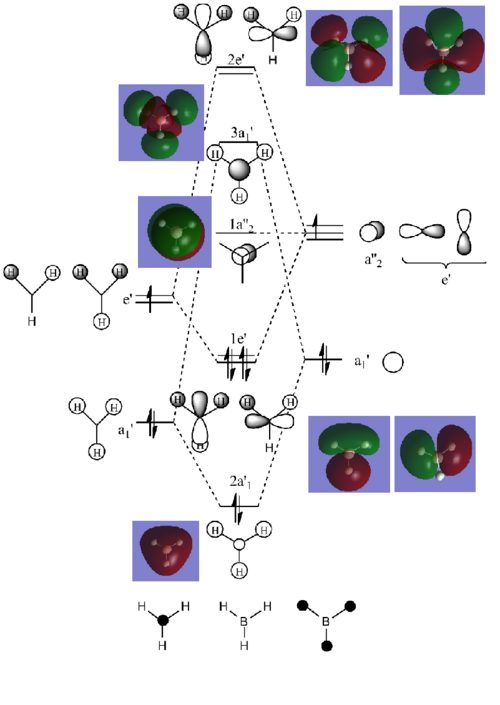
For most of the times, we are interested in electronic structures of the molecules. It is therefore very important to solve related calculations and obtain the MOs of the molecule. MOs generated by Gaussian are quantitative and allow us to compare to MO generated qualitatively via MO diagrams. Here, we investigate MOs of BH3 calculated by Gaussian.
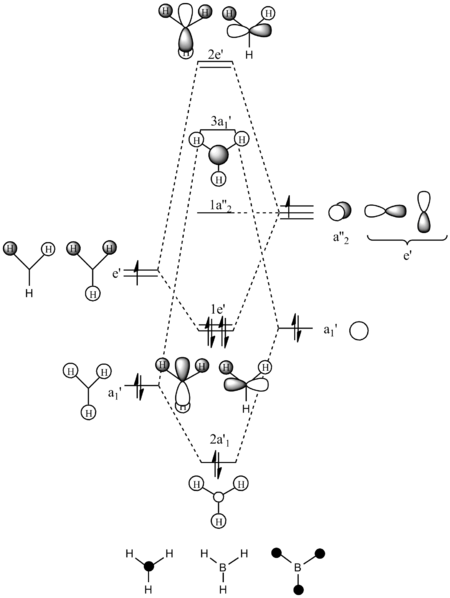
The MO diagram of BH3 above is produced using the Linear Combination of Atomic Orbitals (LCAO) approach. MOs generated by population analysis in Gaussian are then placed next to the corresponding MOs on the diagram. It can be seen the real and LCAO MOs are well matched with no significant deviation. Both methods give good prediction of MOs in terms of size and shape. The computed MOs generally reflect better mixing of obritals.
In terms of energies of MOs, we of course expect the computed MOs to give better predictions as they are generated by actually solving the Schrödinger equation. In general, the more terms being taken into account to solve the Schrödinger equation, the more accurate results could be obtained. Here, calculations are done by using hydrogen atom (1s orbital) as reference to simulate many electron systems. However, orbital mixing will lead to formation of more complex MOs which would look quite different to 1s orbital.
For BH3, the method used is accurate enough to give comparable results to that generated by LCAO approach.
NBO Analysis
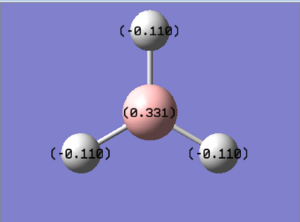
NBO refers to Natural Bond Orbital Analysis. NBO tells quite a number of different things but here we focus only on charge distribution. The figure shows that charge distribution on boron and hydrogen atoms are 0.331 and -0.110 respectively. This indicates that the boron atom is positively charged, which we would also expect for a Lewis deficient center.
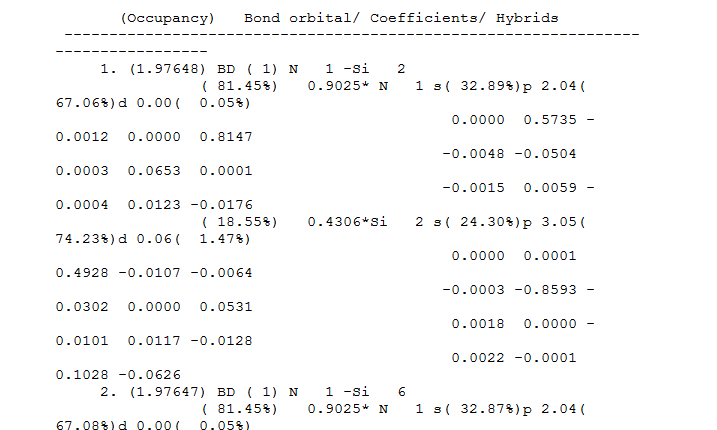
What Gaussian could tell is much more than just a graphical representation. To gain a further insight, we could look into details stated in the output file (File:BH3 OPTIMISATION.LOG), usually in the part with the heading 'Bond orbital/Coefficients/Hybrids'. For each boron hydrogen bond, the boron contributes 44.49% of electron density and the hydrogen contributes 55.1%. And for each boron contribution, 1/3 of it is contribution from a 2s orbital and 2/3 from a 2p orbital, indicating a sp3 hybridisation. Hydrogen, on the other hand, shows 100% contribution from a 1s type orbital. The boron lone pair is also listed.
Information on interactions between MOs, if any, could be found in the section 'Second Order Perturbation Theory Analysis of Fock Matrix in NBO Basis'. It does not contain much information for BH3 though.
Part 2 An Organometallic Complex
Isomers of Mo(CO)4L2
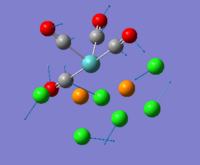
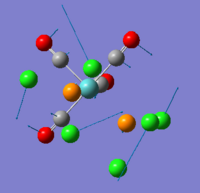
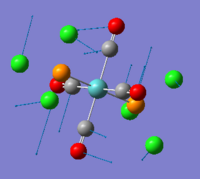
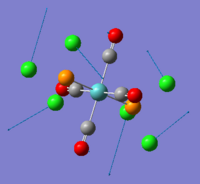
In inorganic chemistry, it is common that we have to identify isomers of complexes. Here, we look at cis/trans isomers of Mo(CO)4L2, L=PPh3, and will examine their vibrational spectra computed by Gaussian. Calculating the full molecule is too expensive and we thus replaced the phenyl rings by chlorine atoms, which shown to have similar electronic contribution to the bonding as phenyl groups. As usual, both structures were optimised (through SCAN) prior to vibrational analysis. First, the B3LYP method together with LANL2MB were used to get the rough geometry right (cis- isomer:DOI:10042/to-7710 ; trans-isomer:DOI:10042/to-7711 ). However, in order to get the right minima, more had to be done. The torsion angle of the PCl3 groups of the optimised LANL2MB structures were altered and a second optimisation was carried out for each of them. The torsion angles were altered such that:
- for the cis confomer, one Cl points up parallel to the axial bond, and that of the other group points down; rotation of other atoms in the group follows accordingly.
- for the trans conformer, both PCl3 groups are eclipsed and that one Cl of each group lies parallel to one Mo-C bond.
Second optimisations were carried out using the B3LYP method with the LANL2DZ pseudo-potential and basis sets. Table 5 summarises results obtained from the second optimisation.
| trans-[Mo(CO)4(PCl3)2] | cis-[Mo(CO)4(PCl3)2] | |||||||
|
| |||||||
| File Type | .log | .log | ||||||
| Calculation Type | FOPT | FOPT | ||||||
| Calculation Method | RB3LYP | RB3LYP | ||||||
| Basis Set | LANL2DZ | LANL2DZ | ||||||
| Final Energy / a.u. | -623.576 | -623.577 | ||||||
| RMS Gradient Norm / a.u. | 0.00003548 | 0.00001004 | ||||||
| Dipole Moment / Debye | 0.3051 | 1.3103 | ||||||
| Point Group | C1 | C1 | ||||||
| Job Time | 1hr 31 min 48.6 s | 2hrs 34 min 35.5 s | ||||||
| Log File | File:Trans 2nd optimisation.out | File:Cis 2nd optimisation.out |
It can be seen that the cis- isomer is slight more stable than the trans- isomer with a difference of ~2.73kJ/mol. However, we would expect the trans- isomer to be more stable as it reduces steric hidrance between bulky phosphine groups. To further investigate this, we ran another optimisation. Knowing that the phosphorus atom is likely to be hypervalent and might use its low lying dAOs, we introduced this dAO functions by editing the log out put file. Table 6 tabulates the results obtained.
Upon introduction of the dAOs, the trans- isomer is of lower energy than the cis- isomer, which is as expected. It is probably more accurate to include the dAO functions. Generally speaking, energies of the two isomers are very close and could be inferred that both of them are stable at room temperature. Experimental results[3] shows that the trans isomer is more stable.
| trans-[Mo(CO)4(PCl3)2] | cis-[Mo(CO)4(PCl3)2] | |||||||
|
| |||||||
| File Type | .log | .log | ||||||
| Calculation Type | FOPT | FOPT | ||||||
| Calculation Method | RB3LYP | RB3LYP | ||||||
| Basis Set | Gen | Gen | ||||||
| Final Energy / a.u. | -623.694 | -623.693 | ||||||
| RMS Gradient Norm / a.u. | 0.00000773 | 0.00005554 | ||||||
| Dipole Moment / Debye | 0.2293 | 0.0714 | ||||||
| Point Group | C1 | C1 | ||||||
| Job Time | 44 min 52.2 s | 33 min 3.1 s | ||||||
| Log File | File:Trans optimisation new job.out | File:Cis optimisation new job.out |
Full output files resulted from optimisation could be found:
By LANL2DZ: trans- isomer DOI:10042/to-7709 cis- isomer DOI:10042/to-7708
By introducing dAOs: trans- isomer DOI:10042/to-7707 cis- isomer DOI:10042/to-7706
Vibrational Analysis of Isomers of Mo(CO)4L2
As mentioned, looking at frequencies is always a good way to confirm completion of an optimisation. Frequencies were calculated for both isomers and we are going to investigate any differences in IR frequencies between the two isomers. From the output file, we see that there are no negative frequencies, indicating that all observed frequencies correspond to a minimum. Table 7 looks at, in particular, some low frequencies of the two isomers.
For full frequency output files:
- cis- isomer: DOI:10042/to-7703
- trans- isomer: DOI:10042/to-7704
The low frequency vibrations are mainly rotations of chlorine atoms around the phosphorus atoms. Thermal energy at room temperature is approximately equal to Boltzmann constant times room temperature (in K). It roughly equals to 2.5kJ mol-1 and 207cm-1 in wavenumbers. It can thus be inferred that these vibrations could easily occur at room temperatures, as reflected in their low intensities.
To differentiate the cis isomer from the trans isomer, we could look at the carbonyl frequencies. Table 8 and 9 tabulates CO stretching frequencies observed in both compounds, with corresponding symmetry point group assigned.
The number of carbonyl absorptions relates to symmetry of the complex, four carbonyl bands are expected from the cis isomer while only one band is expected from the trans isomer. The trans isomer exhibits stretches which results in no net change in dipole moment(B1g and A1g) and they are therefore IR inactive. The remaining two vibrational modes are degenerate and hence only one CO peak is expected in IR. On the other hand, the cis isomer exhibits stretches in which all of them result change in dipole moment. These four IR active modes will thus reflects in the IR spectrum. As seen in the two table (8 & 9), computed frequencies match closely with literature values and the number of absorption bands obtained is as predicted.
In terms of the actual 'wavenumber' values for the computed frequencies, there is some discrepancy when compared to literature values. This might be because Gaussian does not treat n-backbonding well and the effect of increased C=O bond strength is not fully computed.
| Calculated Frequency / cm-1 | Calculated Intensity | Experimental Frequency[4] / cm-1 | Point Group (D4h Symmetry)[4] |
|---|---|---|---|
| 1950 | 1476 | 1896 | Eu |
| 1896 | 1467 | 1896 | Eu |
| 1977 | 1 | - | B1g |
| 2031 | 4 | - | A1g |
| Calculated Frequency / cm-1 | Calculated Intensity | Experimental Frequency[4] / cm-1 | Point Group (C2v Symmetry)[4] |
|---|---|---|---|
| 1945 | 763 | 1986 | B2 |
| 1949 | 1498 | 1994 | B1 |
| 1958 | 632 | 2004 | A1 |
| 2023 | 598 | 2072 | A1 |
Part 3 Mini Project: Trimethylamine, Trimethylphosphine, Trisilylamine and Trisilylphosphine
Our discussion here starts by analysing structures of trimethylamine (N(CH3)3) and trimethylphosphine (P(CH3)3). Then, we are to investigate the effect on structures of these molecules upon the replacement of methyl groups by silyl groups. Last, we will look at MOs of N(SiH3)3 particularly.
Optimisation of molecules
N(CH3)3, P(CH3)3, N(SiH3)3 and P(SiH3)3 were all optimised using DFT, B3LYP method and 6-31G(d,p) basis sets so as to optimise the moelcules to a good level.
All optimised structures showed to have gradient values smaller than 0.0001. Corresponding output log files were also checked to have all forces and displacement converged, ensuring the completion of optimisation. Output files published could be found here:
N(CH3)3:DOI:10042/to-7778 P(CH3)3:DOI:10042/to-7779 N(SiH3)3:DOI:10042/to-7776 P(SiH3)3:DOI:10042/to-7777
| N(CH3)3 | P(CH3)3 | |||||||
|
| |||||||
| File Type | .log | .log | ||||||
| Calculation Type | FOPT | FOPT | ||||||
| Calculation Method | RB3LYP | RB3LYP | ||||||
| Basis Set | 6-31G(d,p) | 6-31G(d,p) | ||||||
| Final Energy / a.u. | -174.486 | -461.112 | ||||||
| RMS Gradient Norm / a.u. | 0.00006068 | 0.00004591 | ||||||
| Dipole Moment / Debye | 0.5793 | 1.3483 | ||||||
| Point Group | C1 | C1 | ||||||
| Job Time | 41.3 s | 17 min 53.4 s |
Upon optimisation, the structure of trimethylamine, N(CH3)3, and trimethylphosphine, N(CH3)3, are both found to be pyramidal with sp3 hybridised nitrogen and phosphorus respectively (shown in Table 10). Similar to ammonia and phosphine, they are expected to have a C3v symmetry. The suggestion of a C3v symmetry implies that we consider the hydrogen atoms on each methyl ligand are equivalent, i.e. they could rotate freely in space. However, this is something that Gaussian would not take into account when doing the calculations. Therefore, Gaussian suggested that there is a lack of mirror planes in the molecules and that they belong to the C1 point group.
Replacing the methyl ligands by silyl ligands in trimethylamine gives planar structure with a sp2 hybridised nitrogen. The planar geometry in N(SiH3)3 is presumably due to interaction between the d-p pi bonding between the unhybridised 2p orbital of nitrogen and the empty 3d orbitals on Si. This p-bonding then results in a decrease in the Lewis basicity of N(SiH3)3 compared to N(CH3)3 due to delocalisation of nitrogen lone pair. Calculations ran by Livant et. al. also results in a planarity N(SiH3)3[5]. Computed by Gussian, the structure of P(SiH3)3 is still pyramidal. Yet,suggested by E.A.V. Ebsworth et. al.[6], the molecule indeed has a planar structure in the P center, similar to N(SiH3)3. For further discussion, see vibration analysis below.
In terms of energy, amines are generally less stable than corresponding phosphine, while molecules with trisilyl groups are more stable than the one with trimethyl groups. We see that the trisilylamine are significantly more stable than the trimethylamine. This in fact supports the suggestion of the delocalisation of lone pair mentioned above.
| N(SiH3)3 | P(SiH3)3 | |||||||
|
| |||||||
| File Type | .log | .log | ||||||
| Calculation Type | FOPT | FOPT | ||||||
| Calculation Method | RB3LYP | RB3LYP | ||||||
| Basis Set | 6-31G(d,p) | 6-31G(d,p) | ||||||
| Final Energy / a.u. | -928.702 | -1215.267 | ||||||
| RMS Gradient Norm / a.u. | 0.00000850 | 0.00002462 | ||||||
| Dipole Moment / Debye | 0.0471 | 0.9076 | ||||||
| Point Group | C1 | C1 | ||||||
| Job Time | 44.6 s | 17 min 0.6 s |
Vibrational analysis
As usual, vibrational analysis was carried out for each of the molecule to confirm that optimisation has run to completion. Also, we would also see the possibility of identifying the structure at the nitrogen and phosphorus centres (planar or pyramidal) by looking at the IR frequencies. Literature values were also listed for comparison.
For trimethylamine, a total of number of 33 modes (with about 6 doubly degenerate sets) of vibrations are recorded by Gaussian. As mentioned, Gaussian recognised trimethylamine belonging to the C1 point group which it should C3v. We therefore expect a number of discrepancies from the computed vibrations when compared to literature values. The C3v symmetry would require twenty-two fundamental vibrations for trimethylphosphine, of which eleven are doubly degenerate (E). Of the remaining eleven vibrations, four are of A2 species and will not be observed in an IR spectrum; and seven are A1 species.
Table 12 shows the literature frequencies values. From the output data file, all the computed vibrations belongs to a A symmetry. This becomes difficult to compare between the two sets of data. Here, we would pick only a few more significant vibration modes and try to compare to that recorded in literature. For example, the symmetric and antisymmetric N-C bending motions are located at 366 and 423cm-1 in literature while that in the computed IR, they are located in 353 and 425cm-1. The absorption bends above 1100cm-1 are mostly methyl rocking motions. And obviously, absorption band located near 3000cm-1 corresponds to C-H stretches.Asymmetric N-C bend is too weak to be observed. Despite the fact of inconsistency in point group assignments, the computed IR still gives reliable vibrational frequencies a data for most of the significant vibraitonal modes. They match well with literature vales. For more details, see real output data file:DOI:10042/to-7784 .
| Frequency no. | Frequency cm-1 | Point Group Symmetry |
|---|---|---|
| 1,2,3,4,5,6,7 | 2950, 2872,1478,1453,1102,825,366 | A1 |
| 8,9,10,11 | (2970),(1460),(1320),(261) | A2 |
| 12,13,14,15,16,17,18,19,20,21,22 | 2978,2822,2774,1466,1459,1444,1273,1183,1043,423,269 | E |
| Frequency no. | Frequency cm-1 | Point Group Symmetry |
|---|---|---|
| 1,2,3,4,5,6,7 | 2970,2850,1417,1310,960,652 | A1 |
| 8,9,10,11 | not shown | A2 |
| 12,13,14,15,16,17,18,19,20,21,22 | 2970, 2920,1430,1298,1067,947,717,707,305 | E |
Similar to trimethylamine, trimethylphosphine was also computed to have 33 vibrational modes, with 6 degenerate sets. Literature values are shown in Table 13. And again, significant vibrational modes were chosen to compare to literature values. In literature, frequencies at 652 and 707cm-1 are symmetric and antisymmetric P-C stretch respectively. In computed results, corresponding frequencies are at 638 and (696,698)cm-1. In literature, symmetric and antisymmetric P-C bend are too weak to be observed, while that in Gaussian, they are computed to be at 283 and 245cm-1. Full frequency output file can be found here:DOI:10042/to-7790
We then go on to do frequency analysis for trisilylamine and trisilylphosphine. Obtaining all positive frequencies confirms us that the optimisations have run to completion. Literature frequency[8],[9] values were found for both compounds (see below). Same as the trimethylamine and trimethylphosphine, Gaussian has problem with the assignment of point groups for the molecules. Computed results show that they both has a C1 symmetry. Similar to above, we chose some significant vibrational modes for comparison.
For trisilylphosphine, literature shows that a total of 12 vibrational modes are IR active. While that in computed results, it is recorded to have a total of 33 IR active vibrational modes (with degeneracy). In literature, P-Si stretch is at 460cm-1 while it is computed to be 456cm-1. Vibrations at higher frequencies are mostly Si-H stretches.
Trisilylamine is the special one. As mentioned, different from trimethylamine, it has a planar structure at the nitrogen centre. In terms of actual symmetry, there are indeed many possibilities, depending on the 'rest' configuration of the hydrogen atoms. For free silyl rotation, it would effectively belong to the D3h point group while in different 'rest' configurations, it might be C3h, C3v, C3, Cs or C1. When carrying out a vibrational analysis, it is difficult to give a definite conclusion regarding point group symmetry. What we know about trisilylamine is that there are partial double bond formations due to d-p pi-bond fomrations; the silyl groups might therefore not be able to rotate freely. Under these circumstances, E.A.V. EBSWORTH et. al. [9] suggested that C3h appears to be the most plausible. Experimental N-Si stretch is at 996cm-1 while the computed frequency is at 994cm-1. For full output files: N(SiH3)3:DOI:10042/to-7812 ;P(SiH3)3:DOI:10042/to-7813
| Frequency no. | Frequency cm-1 | Point Group Symmetry |
|---|---|---|
| 1,2,3,4,5,6 | IR inactive | A' |
| 7,8,9,10,11 | 2154,885,569,-,- | A |
| 12,13,14,15,16,17,18 | 2165,2165,939,939,625,460,- | E' |
| 19,20,21,22 | IR inactive | E |
| Frequency no. | Frequency cm-1 | Point Group Symmetry |
|---|---|---|
| 1,2,3,4,5,6 | IR inactive | A' |
| 7,8,9,10,11 | 2165,~945,748,(<400),- | A |
| 12,13,14,15,16,17,18 | 2165,2165,947,941,996,695,- | E' |
| 19,20,21,22 | IR inactive | E |
NBO analysis
As mentioned, NBO analysis could be carried out to look at bonding distribution among atoms in a molecule. Here, we mainly focus our discussion on trisilylamine, hoping to gain insight of d orbital characteristics in bonding as well as delocalisation of nitrogen lone pair. Below images show 'colour atoms by charge' and atoms labelled by charge number. Generally speaking, the Si atoms are positively charged while the nitrogen atoms and hydrogen atoms are negatively charged. This is as expected, due to the electronegative and electropositive nature of nitrogen and silicon respectively. There is delocalised bonding between silicon and nitrogen (shown by dotted line). And from the output data file, we are able to find contribution of the d orbital of Si-N in bondings, although very litte. This supports our suggestion of the possibility of p-d pi-bonding. We will investigate further in the MO analysis. Full output logfile could be found here:DOI:10042/to-7842 .
Similar analysis could be done for other 3 molecules. Generally speaking, we would expect trimethylamine to be more basic than trisilylamine, due to lack of p-d bonding interaction in the former. The N atom in trimethylamine will thus has a more negative charge than that in trisilylamine in NBO analysis.


MO analysis
Finally, we are to investigate MOs of trisilylamine, N(SiH3)3. Corresponding fchk file could be found here: Below shows the calculated molecular orbitals. In the HOMO-2 and HOMO-1, electron densities mainly concentrate on the methyl groups in different symmetries. In HOMO, electron density are found on all atoms of molecule, localising at the three methyl groups and the nitrogen centre. High electron density on nitrogen atom depicts its basicity. For LUMO, LUMO+1 and LUMO+2, electron densities are less localised when compared to that of the HOMO. In both HOMO and LUMO, we see significant delocalisation of electron densities across N-Si bonds. Our results indeed show high consistency compared to MOs computed by James O. Jensen, though a different basis set is used[10].
MO fchk file:File:N(SiH3)3 opt 3rd trial 6-31g(d,p) MO.fchk
| HOMO-2 | HOMO-1 | HOMO | LUMO | LUMO+1 | LUMO+2 |
|---|---|---|---|---|---|
 |
 |
 |
 |
 |
|
References
- ↑ M.S. Schuurman, W.D. Allen, H.F. Schaefer III, J. Comput. Chem., 2005, 26, 1106: DOI:10.1002/jcc.20238
- ↑ J. Glaser, Acta Chem. Scand. A, 1979, 33, 789
- ↑ F.A. Cotton, D.J. Darensbourg, S. Klein, B.W.S. Kolthammer, Inorg. Chem., 1981, 21, 294: DOI:10.1021/ic00131a055
- ↑ 4.0 4.1 4.2 4.3 F.A. Cotton, Inorg. Chem., 1964, 3, 702: DOI:10.1021/ic50015a024
- ↑ P. Livant, M.L. McKee, S.D.Worley, Inorg. Chem., 1983, 22, 895-901: DOI:10.1021/ic00148a012
- ↑ E.A.V. Ebsworth, J.R. Hall, M.J. Mackillop, D.C. McKean, N. Sheppard and L.A. Woodward, Spectrochim. Acta., 1958, 13, 202: DOI:10.1016/0371-195(58)80078-8
- ↑ J.N. Gayles, Spectrochim. Acta. Part A: Molecular Spectroscopy, 1967, 23, 1521-1531: DOI:10.1016/0584-8539(67)80375-1
- ↑ 8.0 8.1 8.2 J.N. Gayles, Spectrochim. Acta. Part A: Molecular Spectroscopy, 1967, 23, 1521-1531: DOI:10.1016/0584-8539(67)80375-1 Cite error: Invalid
<ref>tag; name "trimethylphosphine" defined multiple times with different content - ↑ 9.0 9.1 E.A.V et. al., Spectrochim. Acta. , 1958, 13, 202-211: DOI:10.1016/0371-1951(58)80078-8
- ↑ James O Jensen, Journal of Molecular Structure (Theochem), 2002, 588, 175-186: DOI:10.1016/S0166-1280(02)00170-7


