Rep:Mod:wraithpinnedtothemistandothergames
Shahania Begum
Module 2: Inorganic computational lab
Optimizing a molecule of BH3
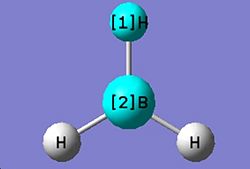
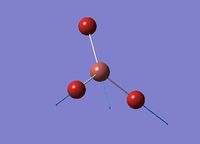
The optimised B-H bond distance is 1.19 Å. The optimised H-B-H bond angle is 120.0°. The type of file used was a .log file. The type of calculation used was an FOPT. The calculation method used was RB3LYP. The basis set used was 3-21G. The final energy was -26.4623 a.u *2625.5kJ/mol=-69477kJ/mol. The gradient was 0.0000285 a.u. The dipole moment was 0.0 Debye and the point group of BH3 is D3h. The calculation took 24 seconds to complete.
Optimizing a molecule of BCl3
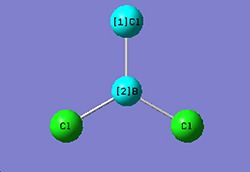
The optimised B-Cl bond distance is 1.87 Å. The optimised Cl-B-Cl bond angle is 120.0° The type of file used was a .log file. The type of calculation used was an FOPT. The calculation method used was RB3LYP. The basis set used was LANL2MB The final energy was -69.4393 a.u*2625.5=-182313KJ/mol. The dipole moment was 0.0 Debye and the point group of BCl3 is D3h. The calculation took 11 seconds to complete.
Optimizing a small molecule H2O
DOI NEED TO PUBLISH

The XYZ coordinates of H2O ;
Center     Atomic     Atomic              Coordinates (Angstroms)
Number     Number      Type              X           Y           Z
---------------------------------------------------------------------
   1          8             0        0.000000    0.000000    0.122755
   2          1             0        0.000000    0.785462   -0.491020
   3          1             0        0.000000   -0.785462   -0.491020
The optimised H-O bond distance is 0.99 Å. The optimised H-O-H bond angle is 104.0°. The type of file used was a .log file. The calculation method used was RB3LYP. The basis set used was 3-21G. The final energy was -75.97397 a.u *2625.5=-199470 kJ/mol The dipole moment was 2.24 Debye and the point group of H2O is C2v. The calculation took 16 seconds to complete.
Vibrational Analysis of BH3
In order to confirm that we have the minimum structures frequency and vibrational analysis has been carried out on the fully optimised structure of BH3.
IR spectrum for BH3

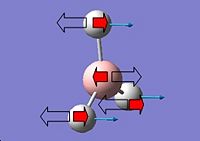
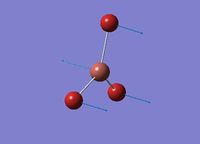
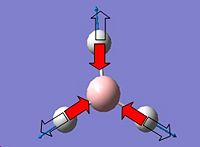
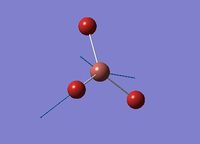
There are only three peaks seen in the IR spectrum despite the fact that BH3 has six vibrations. This is due to vibration 5 has no overall dipole therefore does not result in an absorption peak. Vibrations 2 and 3 absorb at the same frequency with almost identical IR intensities which overlap and so appear as one peak, this is also the case for vibrations 5 and 6 consequently only 3 peaks are seen.
Molecular orbitals of BH3
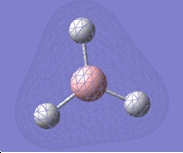
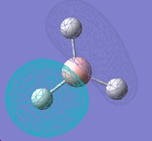
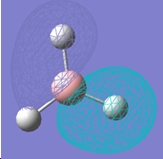
MO diagram of trigonal planar D3h BH3
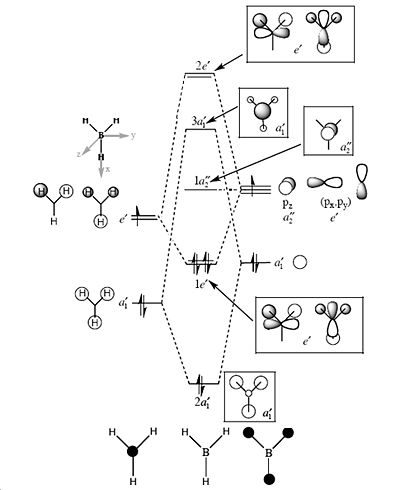
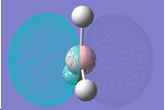
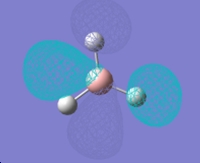
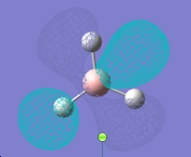
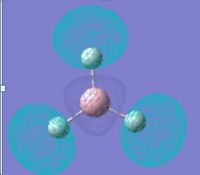
Comparing the significant differences between the quantitative and qualitative molecular orbital representations.
Overall the qualitative representations are still very useful especially for predicting the bonding orbitals, however it is not always accurate. More sophisticated modelling techniques are required as well as steric and electronic effects need to be taken into account to get a better representation. The most significant differences seem to be for the lumo orbitals, where the anti-bonding molecular orbitals appear to be larger and more diffuse. Anti-bonding orbitals are not represented or predicted very well via qualitative representations perhaps due to the fact no electrons are occupying these orbitals hence the predicted spread of electrons is a poor representation.
Isomers of Mo(CO)4L2
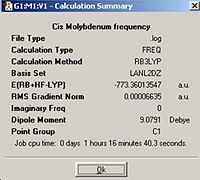
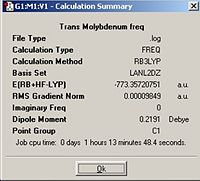
In order to predict the thermal stabilities and compare the spectral characteristics of the two cis and trans isomers of Mo(CO)4P(CH3)2, they were optimised initially using the B3LYP method with a low level basis set and pseudo-potential LANL2MB to get the rough geometry right. This was followed by optimisation where the B3LYP method with the LANL2DZ pseudo-potential and basis sets were used. After which the vibrational frequencies were computed; Trans optimisation http://hdl.handle.net/10042/to-1784
Cis optimisation http://hdl.handle.net/10042/to-1785
Trans Frequency http://hdl.handle.net/10042/to-1787
Cis Frequency http://hdl.handle.net/10042/to-1786
Comparing the geometry of the Cis and Trans isomers
| Cis Isomer | Trans Isomer |
 |
 |
 |
 |
Geometries of the isomers
| Bond lengths (Å) | Cis | Cis literature | Trans |
| Mo-P | 2.65 | 2.529 | 2.57 |
| CO | 1.19 | 1.140 | 1.19 |
| Mo-C cis(CO) | 1.98 | 1.982 | 2.03 |
| Mo-C trans(CO) | 2.03 | 2.016 | 2.03 |
| P-CH3 | 1.89 | 1.840 | 1.89 |
| Bond angles (°) | Cis | Cis literature | Trans |
| P-Mo-P | 92.8 | 94.78 | 177.4 |
| Mo-P-C | 113.8 | 116.0 | 116.7 |
| C-P-C | 101.3 | 101.9 | 101.4 |
From comparing the cis and trans geometries it can be seen that first of all the cis calculated values match those of literature very well. Therefore the calculations run are very accurate. Literature for the trans isomer could not be found, however comparing the trans and cis geometries the main differences appear to be the P-Mo-P angle but this is expected to be close to 180° for the trans and it is 92.8° for the cis isomer. For the cis isomer the Mo-C bonds vary with the (CO) groups’ cis to each other give rise to a shorter Mo-C length compared to the Mo-C bonds with the CO groups trans to one another. Whereas in the trans isomer, all of the Mo-C lengths are the same.
IR Spectra and Vibrational frequencies
IR spectrum of Cis-Mo(CO)4(PMe3)2

IR spectrum of Trans-Mo(CO)4(PMe3)2
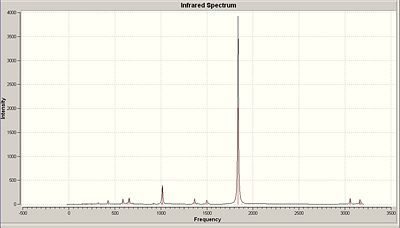
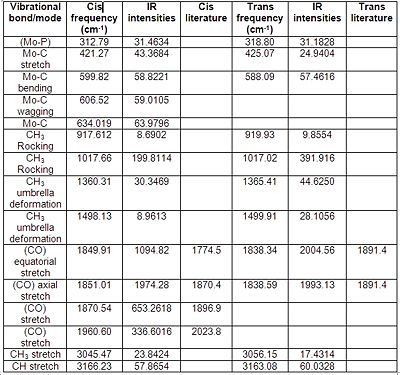
From comparing the vibrational frequencies between the two isomers it can be seen that the most significant difference between the two isomers is that the cis isomer gives rise to four unique absorption peaks from the four CO bond stretching frequencies at 1850, 1851, 1870 and 1961 cm -1. Whereas the trans isomer although has two CO stretching frequencies they overlap at 1838 cm -1 so one peak of extremely high IR intensity is seen on the spectrum. Overall the other vibrational modes are similar and comparable. literature corresponds to PPh3 ligands which may explain the variations from the values computed.
The energies of the two isomers are; Trans =-2030449 kJ/mol and cis =-2030457, the energy difference between the two isomers is very small at 8kJ/mol. The cis isomer has the more negative energy value thereby being the more thermodynamically stable isomer. Fine tuning of the isomers can be achieved by altering the ligand P(CH3)2 by using a ligand which could intermolecularly stabilise the trans conformation perhaps via H-bonding to the neighbouring CO bond either side. Thereby making the trans isomer the more favourable and more stable product.
Ammonia NH3
The structure of Ammonia was configured in Gaussview the structure was optimised using a 6-31G basis set and the B3LYP method. The symmetry of this NH3 molecule is C3v as can be seen from the calculation summary below.

After Generating an NH3 molecule with one N-H bond extended to 1.01Å , by ignoring the symmetry and optimising the molecule C1symmetry was obtained for the molecule;
NH3with D3hsymmetry was obtained by optimising an NH3 molecule with an extra dummy atom which has been used to restrict the symmetry of this molecule.
Calculation summaries;
| Ammonia C3v | Ammonia C1 | Ammonia D3h |
 |
 |
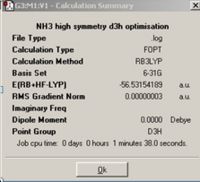 |
The final structure of NH3 appears planar with D3hsymmetry, from comparing the different symmetry groups it can be seen that the symmetry has not been changed for the final structure of the C3v and C1 structures. The calculation for the C3v molecule took the shortest amount of time to complete this may be due to the fact that the ground state of Ammonia was already in the correct configuration compared to the transition state with symmetry which took the longest amount of time for the calculation to complete. This is because it takes longer to transform and optimise the molecule from its original C3v structure to the planar D3h. It is hard to say whether a molecule can ‘break symmetry’ in these three examples this has not occurred however there may be instances where a molecule can. The implications for entering a high energy structure to optimise are that the greater the number of symmetry planes and characters associated with a molecule the more conformationally bound the molecule is to maintain this symmetry and there is a set of symmetries that Gausian can recognise for this rigid molecule optimisation should be quite fast.
The lowest energy geometry is the ground state C3v molecule; only by about 0.83 kJ/mo1 less than that of the C1molecule. The energy of the two isomers above the energy of the lowest energy structure is 0.91kJ/mol where the transition state D3h molecule has the highest energy structure, the energy difference between these structures could be significant in determining whether the formation of ammonia is thermodynamically controlled and is useful in disclosing the energy barrier for the transition state however the energy differences are so close and due to the ~1kJ/mol error associated with the calculated values the values are insignificant and not as accurate as we would have hoped for them to be of much use.
Ammonia MP2 Method
In this section the effect of using a better method and basis set on the time it takes to do a calculation, and on the final geometry and energies obtained was explored. A 6-311+G(d,p) basis set and the MP2 method was applied in order to see the time difference between the lower level and the higher level calculations so optimisation of the molecules were prepared from scratch.
MP2 method of optimising NH3 the ground state under C3v symmetry was calculated as well as the planar transition state NH3which has D3hsymmetry.
Calculation summaries:
| Ammonia C3v | Ammonia D3h |
 |
 |
From comparing the two optimisations these calculations take slightly longer than the lower level calculations. The barrier height to inversion at this level of calculation is ΔE=E(D3h)-E(C3v) = 20.46kJ/mol. There is a significant change between the ΔE calculated between the B3LYP/6-31G and MP2/6-311+G(d,p) sets of calculations. The MP2 calculations give rise to a result which is actually quite similar to the experimentally determined barrier of 24.3 kJ/mol. This suggests that the MP2 method is a much more powerful and accurate technique in obtaining energies.
Vibrational Analysis of Ammonia
The IR spectrum of ground state ammonia with C3v symmetry
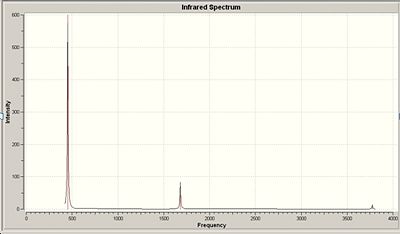
Frequency analysis for the optimised NH3 B3LYP/6-31G C3v

The IR spectrum of ground state ammonia with D3h symmetry

Frequency analysis for the optimised NH3 B3LYP/6-31G D3h

There are six positive frequencies for the C3v structure and 5 positive frequencies for the intermediate D3h structure.

have the same character of motion. Whereas with vibration 1 the vibrational mode for C3v a concerted stretching motion of the N-H bonds are inverted for that of the D3h structure which corresponds to the negative frequency for this vibrational mode in D3h. The experimental values for the C3v structure are a significant amount lower than the values calculated via the MP2 method, this may be due to the fact that the harmonic oscillator has not been taken into account, dissociation values have not been included and so the vibrational frequencies are higher than what is expected.
The D3h structure is a transition state structure, transition states always have only one negative frequency, the negative vibration is the imaginary frequency of crossing over during the inversion and the negative vibration corresponds to the movement of the atoms on the two reaction coordinates. Where the up and down movement is translated/inverted to the mirrored coordinates. It is vibration 1 which follows the inversion reaction path and is inverted as demonstrated in the transformation scheme below.

For the C3v structure the N-H bond move up and down in a concerted motion moving below the x axis, once inverted for the D3h structure the N-H bonds move up and down above the x-axis, For example whilst performing a symmetry operation if the N atom is the centre of inversion then the H-atoms in fig.2 their coordinates are inverted into those which would give the mirror image of fig.2 if the atom was reflected along the x-axis fig.4 the molecule in figure four would be obtained.


