Rep:Mod:wd812org
Conformational Analysis Using Molecular Mechanics
Since the energy values under a specific force field calculation is only comparable between different isomers, there is a table in each comparative section.
The cyclopentadiene dimer
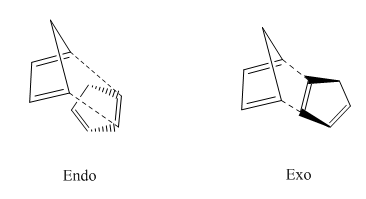
Cyclopentadiene dimerises to produce the endo adn The formation of the endo and exo products were manipulated below in Figure 1.
The 'endo' and 'exo' product of the cyclopentadiene dimer was sketched using Chem Draw Pro 14.0 . The .cdxml files were saved and re-opened by Avogadro, and their energy were optimized by the MMFF94s force field using the energy optimization tool [1]. Below are the are the geometric outcomes (Table 1).

|
|
The energies were then dissected in to different energy contributions, here is the breakdown of all the energy terms.
| Types of energy | Energy values (Kcal/mol) | |
|---|---|---|
| Endo | Exo | |
| Total Bond Stretching Energy | 3.46513 | 3.54444 |
| Total Angle Bending Energy | 33.22273 | 30.78158 |
| Total Stretch Bending Energy | -2.08133 | -2.04100 |
| Total Torsional Energy | -2.95337 | -2.73176 |
| Total Out-of-plane Bending Energy | 0.02015 | 0.01373 |
| Total Van Der Waals Energy | 12.33456 | 12.79356 |
| Total Electrostatic Energy | 14.18253 | 13.01269 |
| Total Energy | 58.19041 | 55.37324 |
We can see from the table that the exo product has lower energy compared with the endo form , although the endo form is the main product. This is due to the fact that the activation energy for the endo product in lower than that of the exo form, therefore kinetically the endo from is more favorable, which means, normally the reaction condition cannot provide enough energy for the reactant to be able to cross the energy barrier for the exo product. See the energy diagram for this reaction.
The dissected energies of the dihydro products of cyclopentadiene dimer (compound 3 and 4) were optimized and their relative stability were compared.
|
|
| Types of energy | Energy values (Kcal/mol) | |
|---|---|---|
| Structure 3 | Structure 4 | |
| Total Bond Stretching Energy | 3.30465 | 2.82306 |
| Total Angle Bending Energy | 30.85196 | 24.68552 |
| Total Stretch Bending Energy | -1.92544 | -1.65716 |
| Total Torsional Energy | 0.07637 | -0.37812 |
| Total Out-of-plane Bending Energy | 0.01516 | 0.00028 |
| Total Van Der Waals Energy | 13.27900 | 10.6369 |
| Total Electrostatic Energy | 5.12113 | 5.14702 |
| Total Energy | 50.72283 | 41.25749 |
Form the table we can see that the molecule4 (endo2) has lower overall energy. By inspection of the dissected energy terms, we can see that the main contribution comes from the (total)angel bending energy (30.85196 and 24.68552 respectively). There is also difference in the Van der Waals enrergy (5.12113 for product 3 and 5.14702 for product 4)
Two intermediates (molecule 9 and 10) of Taxol synthesis were shown below.
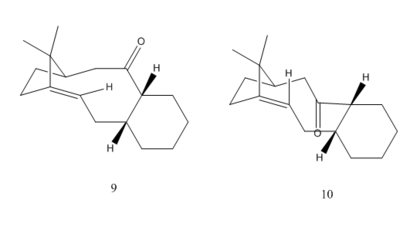
Notice that for the cyclohexane 6-membered ring of the molecule, it could either have 'chair' or 'boat' conformation, thus overall four structures can be optimized and compared. (named 'molecule 9, 10 chair/boat' respectively)
|
|
|
|
The energy of these two molecules were calculated and compared.
| Types of energy | Energy values (Kcal/mol) | |||
|---|---|---|---|---|
| Molecule9 | Molecule10 | |||
| Boat | Chair | Boat | Chair | |
| Total Bond Stretching Energy | 7.73857 | 8.09070 | 7.24788 | 8.18105 |
| Total Angle Bending Energy | 33.14649 | 31.48798 | 23.21627 | 26.86100 |
| Total Stretch Bending Energy | -0.13671 | -0.12280 | -0.18289 | -0.18249 |
| Total Torsional Energy | 4.96392 | 1.31000 | 1.16940 | -0.68111 |
| Total Out-of-plane Bending Energy | 0.84941 | 0.49460 | 0.69896 | 1.04463 |
| Total Van Der Waals Energy | 35.00721 | 36.05071 | 33.59989 | 35.26391 |
| Total Electrostatic Energy | 0.15117 | 0.04477 | 0.83828 | 0.18325 |
| Total Energy | 81.72005 | 77.35594 | 66.58779 | 70.67024 |
From the table we can see that overall structure 10 has lower energy than structure 9. This is due to the fact that the in structure 10 the C=O bond is pointing downwards, preventing the steric unfavorable interaction between the carbonyl group and the bridge structure. However, the computed result fails to confirm that the 'chair' structure has lower energy than the 'boat' structure for structure 10. The boat structure of molecule 10 has the lowest energy. The total angle bending energy, the torsional energy, and the Van Der Waals energy all favours the boat 10 structure.
Spectroscopic Simulation Using Quantum Mechanics
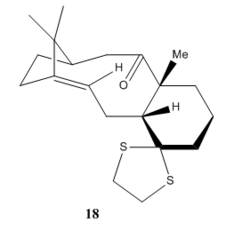
In this section we need to simulate the NMR spectrum of an intermediate of Taxol synthesis.From our previous exercise we can see that, structure 10 is lower in energy than structure 11, therefore we can deduce that structure 18 will have lower energy than 17. Both 'chair' and 'boat' structures (with regards to the 6-membered ring) was optimized using Avogadro. After trying out with several conformations the lowest energy form was found to be the 'chair' conformer of structure 18. We expect its NMR to be more close to the experimental data since it is the most stable form among all the others. Below is molecule 18 in chair conformation.
|
 |
The molecule under inspection was optimized at the density functional level(DFT) in the following steps:
- The 3D molecular structure was manipulated using ChemBio-3D.
- It was opened in Avogadro, and the following parameters were set as such:Extension--> Gaussian-->Calculation:
 Geometry optimization;
 Theory: B3LYP; Basis: 6-31G(d,p).
- The file was saved in .com form.
- The .com file was then opened in GaussView
- In Gaussview, the calculation setup is done by: Calculate-->Gaussian Calculation Setup:
 Job type: Opt+Freq;
 Method: Ground State,DFT,Default spin=B3LYP;
 Basis set: 6-31G, (d,p);
 Solvation: Model=CPCM; Solvent=Chloroform;
 In the additional keywords, type in 'NMR EmpiricalDispersion=GD3'.
- The file was then saved and uploaded into the HPC website. After around 5 hours, the result can be downloaded.
- The downloaded result file (.log) was then opened in Gaussview again under Result-->NMR the 1H and 13C NMR were selected and exported respectively. The reference chosen was "TMS B3LYP/6-311+G(2d,p) GIAO".
NMR data
NMR diagrams are shown below:
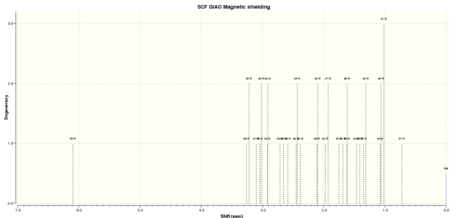
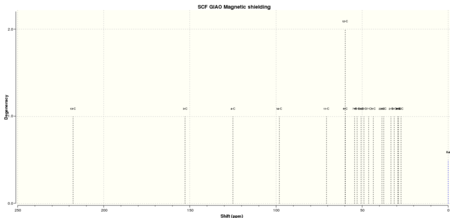
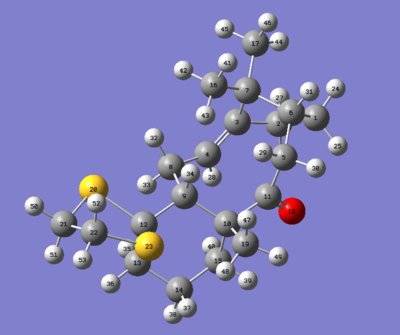
The results are appended below:
- 1H NMR
Summary of NMR spectra ( SCF GIAO Magnetic shielding)
Values for element H only
Reference:  TMS B3LYP/6-311+G(2d,p) GIAO
Reference shielding:  31.8821 ppm
Degenerate peaks are condensed together (Degeneracy Tolerance 0.05)
| Shift (ppm) | Degeneracy | Atom Assignment | ||
|---|---|---|---|---|
| Literature | Computed | Literature | Computed | Computed |
| 5.21 (m) | 5.4671 | 1 | 1 | 28 |
| 3.4373 | 1 | 52 | ||
| 3.3591 | 1 | 53 | ||
| 3.2888 | 1 | 34 | ||
| 3.1699 | 1 | 51 | ||
| 3.1089 | 1 | 50 | ||
| 3.00-2.70 (m) | 2.9771 | 6 | 2 | 32,29 |
| 2.70-2.35 | 2.6617 | 4 | 2 | 25,27 |
| 2.4184 | 1 | 35 | ||
| 2.2116 | 1 | 33 | ||
| 2.20-1.70 (m) | 2.0966 | 6 | 4 | 48,43,31,36 |
| 1.9435 | 2 | 24,37 | ||
| 1.8274 | 1 | 30 | ||
| 1.7334 | 3 | 39,26,38 | ||
| 1.58 (t) (J=5.4Hz) | 1.6365 | 1 | 2 | 44,42 |
| 1.5559 | 1 | 40 | ||
| 1.50-1.20(m) | 1.4001 | 3 | 1 | 47 |
| 1.10 | 1.1962 | 3 | 2 | 45,41 |
| 1.07 | 0.9635 | 3 | 1 | 46 |
| 1.03 | 0.5587 | 3 | 1 | 49 |

- 13C NMR
Summary of NMR spectra ( SCF GIAO Magnetic shielding)
Values for element C only
Reference:  TMS B3LYP/6-311+G(2d,p) GIAO
Reference shielding:  182.466 ppm
Degenerate peaks are condensed together (Degeneracy Tolerance 0.05)
| Shift (ppm) | Atom Assignment | |
|---|---|---|
| Literature | Computed | Computed |
| 211.49 | 200.0477 | 11 |
| 148.72 | 141.7579 | 3 |
| 120.90 | 114.2084 | 4 |
| 74.61 | 81.8160 | 12 |
| 60.53 | 52.3680 | 9 |
| 51.30 | 48.7760 | 10 |
| 50.94 | 44.1371 | 6 |
| 45.53 | 40.1372 | 7 |
| 43.28 | 36.6003 | 22 |
| 40.82 | 32.0190 | 13 |
| 38.73 | 30.2381 | 21 |
| 36.78 | 29.4466 | 5 |
| 35.47 | 25.6028 | 2 |
| 30.84 | 22.9541 | 8 |
| 30.00 | 20.7147 | 15 |
| 25.56 | 17.9870 | 17 |
| 25.35 | 16.0023 | 19 |
| 22.21 | 15.5411 | 1 |
| 21.39 | 13.4090 | 16 |
| 19.83 | 12.5569 | 14 |
- Analysis
From the above table we can see that there are some differences between the literature and the computational results. The computed results generally agree with the literature, especially in the number of chemical shifts(total integration number= No. of atoms in the molecule). However the chemical shift values are not the same. The main resources of the differences may come from the following aspects: Firstly, in the literature the NMR solvent used was 'benzene-d6', but herein the solvent used was 'chloroform' (It's impossible to use C6D6 as a solvent in Gaussview or equivalent softwares). Therefore we can see that there is a shift in the chemical shift values. Secondly, notice that in the real experiment, the chemical shift can be easily affected by the conformational change in the vicinity of the cyclohexane ring. Thirdly, the presence of oxygen/sulphur(oxygen especially since its electronegativity larger than carbon) atoms can affect the chemical shift of other nearby atoms( which explains why the chemical shifts for carbon atom 12,21,22 have divergency for ~10 ppm) Fourthly,the presence of double bond deshields the carbon atoms further more, which explains why chemical shifts for carbon atom 3,4 have reasonable discrepancy with their corresponding literature values.
The mechanical force field calculation only consider the atoms as spring, and using quantum mechanic knowledge includes data baring the information of bond/angle/torsion angle/non-bondend pairs/ partial charges.
Analysis of the Properties of the Synthesised Alkene Epoxides
In an epoxidation reaction the double bond between two carbon atoms reform into a single bond and the carbon atoms in turn each connected to a same oxygen atom, forming a cyclic ether. In this computational exercise two catalytic systems were studied for the epoxidation of i) styrene and ii) trans-stilbene.
Catalytic systems
The Shi Fructose-derived chiral catalyst
Species 21 drawn below is a isolatable precursor of the catalyst.
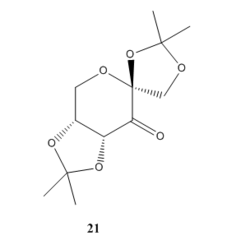
Molecule 21 was searched in the CCDC database using the Conquest Program. The molecule has
By using the Mercury program, the C-O bond length of the molecule is measured. Shown in the diagram below:

We can see that the C-O-C bond is labelled red is all around 1.42 Å, which is a bit shorter than the normal C-O bond length (1.43 Å). This can be explained by the anomeric effect: There is a hyperconjugation stabilisation interaction where the lone pair on the oxygen can donate its electron density into the C-O б* anti bonding orbital. The consequence of that is an antiperiplanar alignment of the lone pair and the C-O б* orbital. Overall one of the C-O bond is strengthened and the other is weekend, and adding up all the effect around the ring leads to the appearance of these shorter C-O bond lengths.
The Jacobsen salen-derived chiral catalyst
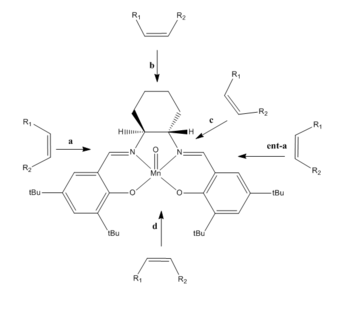
In 1990, Jacobsen and Katasuki independently announced their discovery of the manganese sealen based catalysis system. The active epoxidizing agent is a O=MV(salen)+ cavity produced by the oxidation of manganese oxo complex using NaOCl. In this exercise we will focus on the Jacobsen's catalyst, namely N,N′-Bis(3,5-di-tert-butylsalicylidene)-1,2-cyclohexanediaminomanganese(III) chloride (shown in Fig. 11).

The molecule cannot be found using the CDCC conquest programme. Therefore its crystal structure is downloaded from pub chem [1]. The distance between the two adjacent t-Butyl groups shown below in Fig. 12 are measured using ChemBio 3D.
Molecule 3 |
The bond distances between the adjacent carbon atoms and hydrogen atoms of the t-butyl gorup have been measured. The H...H distance between the two t-butyl groups is 0.213nm which is in the repulsive region, thus the alkene cannot approach the catalytic center through this direction. According to the reference [2] the alkene can only access the catalytic center via pathway b. The catalysis complex is also in a so-called 'stepped' structure (the two sale groups approximately in antiperiplanar position) due to the presence of two C=N bonds near the reaction centre.
The calculated NMR of the epoxide products
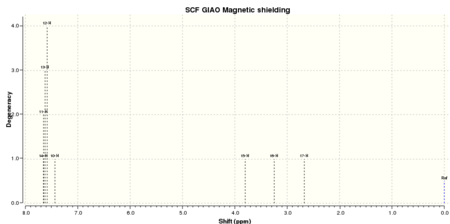
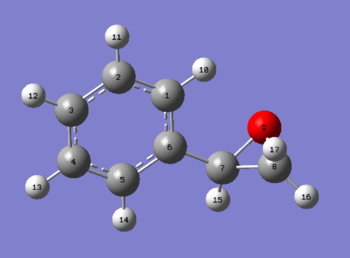
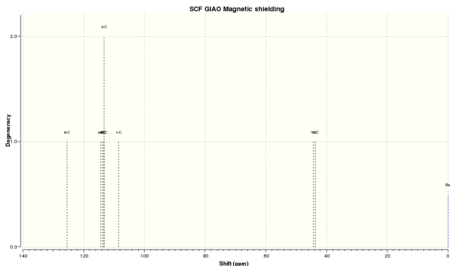
- Styrene oxide
The 1H and 13C NMR spectra are shown below:
| Computed NMR spectrum | Atom Assignment |
|---|---|
 |
 |
 |
- Trans-β-methyl styrene===
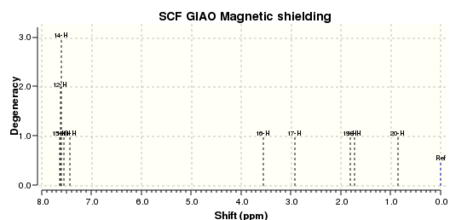
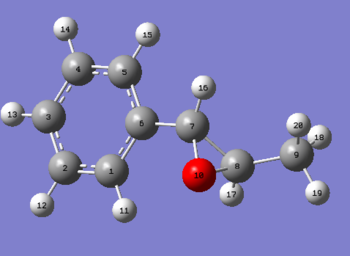
The 1H and 13C NMR spectra are shown below:
| Computed NMR spectrum | Atom Assignment |
|---|---|
 |
 |
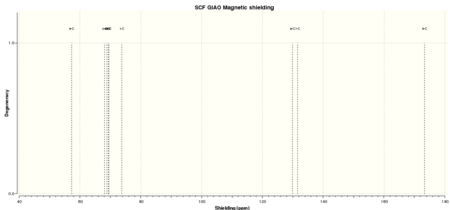 |
The NMR data can only confirm the identity of the molecule, but not their absolute configuration.
Assigning the absolute configuration
The absolute configuration of the products are assigned by three ways in this exercise:
Using literature
The epoxide products under investigation are widely known and the absolute configuration can be confirmed by results in literature. However we need to bare in mind that the results from different literature reports sometimes conflict with each others. The absolute sign and the magnitude of the rotation of the experimental data can always be affected by a subtle change in the structure of the molecules under inspection. For instance, a change in conformation can cause fluctuation of the results. The more reliable method of assigning the sign is the full quantum mechanical calculation [3]
Calculation of the chiroptical properties
Herein two methods are used:
i) The optical rotation at a specified wavelength of light (OR)
ii)The vibrational circular dichroism (VCD)
Note that since there are no chromophores exist in the epoxides under study, another method for calculating the chiroptical properties, namely the 'Electronic circular dichroism(ECD)' method cannot be used.
The results are shown below:
- For styrene oxide
The optical rotation (OR) for two configurations at 589 nm and 365 nm are:
| At 589 nm | At 365 nm | |
| (R)/deg. | -182.01 | -685.82 |
| (S)/deg. | 182.12 | 686.21 |
The VCD for two configurations are:
 |
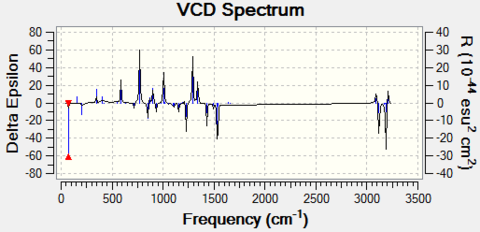 |
From above results we can see that the optical rotation values of each computed enantiomer pairs have similar values but opposite sign, this confirms that they are indeed enantiomeric. From the VCD spectrum we can also see that the graphs of each enantiomer pair are the inverse of each other (symmetrical along the x-axis).
- For β-methyl styrene oxide
The cis form can have (R,R) and (S,S) configuration; The trans form can have (S-methyl,R-phenyl) and (R-methyl,S-phenyl) configuration.
The optical rotation (OR) for these configurations at 589 nm and 365 nm are:
| At 589 nm | At365 nm | ||
| Trans | (R,R)/deg. | -102.46 | -432.18 |
| (S,S)/deg. | 101.57 | 428.58 | |
| Cis | (S,R) /deg. | -95.33 | -346.36 |
| (R,S)/deg. | 119.31 | 423.99 |
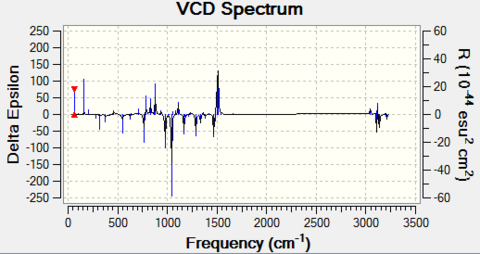
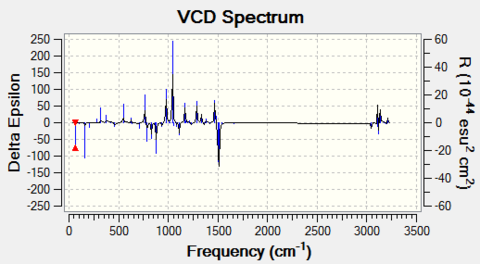
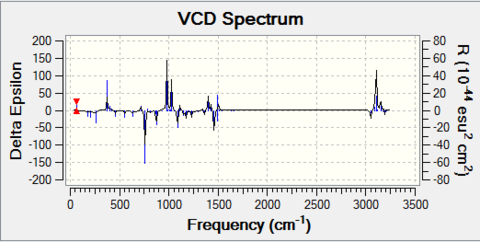
The VCD for two configurations are:
 |
 |
 |
 |
Note that for the (R,S) and (S,R) enantiomer pair, although the magnitudes of optical rotation of inverse-sign pair are not the same, the fact that their sign at two wavelengths are indeed opposite to each other proves that they are enantiomeric to each other. The VCD spectrum again is symmetric about the x-axis, which confirms their enantiomeric property.
Predict the enantiomeric excess by transition state free energy
Below is a breakdown of the energy calculation:
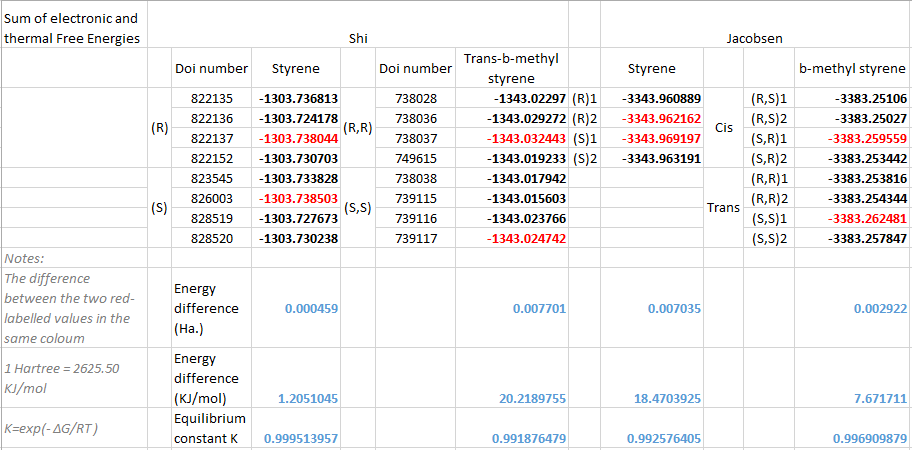
From the table we can see that using the Shi catalyst, the enantiomeric excess for (the epoxidation product of) styrene (S)/(R)is 0.9995, for (the epoxidation product of) trans-β-methyl styrene (R,R)/(S,S)=0.9920; using the Jacobsen catalyst, the enantiomeric excess for (the epoxidation product of) styrene (S)/(R)=0.9926, for (the epoxidation product of)β-methyl styrene trans/cis=0.9970. These information can be interpreted to several facts: For styrene, both the Shi and Jacobsen catalyst favour the (s) configuration of the product; For β-methyl styrene, the Shi catalyst produces only the trans form, and the dominant trans product is in (R,R) configuration; On the other hand, the Jacobsen catalyst leads to the formation of both trans and cis forms of the products, and the trans (S,R) form is the most favorable one.
To get better inspection of the transition state, the .log file of the configurations possess the lowest energy values(labelled red in the above table) is opened in Gaussview 5.0 The animation simulating the transition state can be obtained by checking the Result-->Vibration-->Starting Animation in Gaussview. The animation is then saved and uploaded onto the wiki page.
Procedure for NCI (non-covalent-interaction) analysis
NCI for Shi-styrene(S) |
The strength and nature of the non-covalent interaction can be indicated by different colours: Blue-strongly attractive; Green-moderately attractive; Yellow-moderately repulsive; Red-strongly repulsive. We can see that there is a red ring between the carbonyl group on the catalyst and the terminal vinyl carbon of the styrene molecule, this represents the C-O bond that is about to form during the transition state. Other prominent repulsive regions can be found between the acetal oxygen atoms. The lone pairs of these oxygen atoms are probably too close to each other, so that they display strong repulsive interactions. While the interactions along the substrate chain is mainly 'green', i.e. mostly attractive, therefore overall the transition state is 'attractive': it has lower energy and is stable.
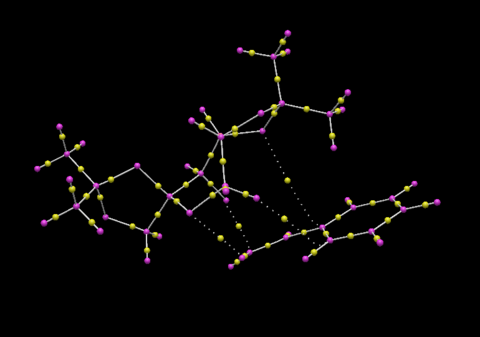
Procedure for Electronic topology (QTAIM)
- ↑ http://pubchem.ncbi.nlm.nih.gov/summary/summary.cgi?sid=24865246)
- ↑ McGarrige, E. M.; Gilheany, D. G. Chem. Rev. 2005, 105, 1563–1602.
- ↑ toolbox/chemwiki

