
Rep:Mod:wd812inorg
Day 1
BH3: B3LYP/3-21G
Optimisation log file for Cs geometry here; for C1 geometry here; for D3h geometry here
| geometry | summary data | convergence | Jmol | |||
|---|---|---|---|---|---|---|
| Cs | 
|
Item Value Threshold Converged? Maximum Force 0.000220 0.000450 YES RMS Force 0.000106 0.000300 YES Maximum Displacement 0.000919 0.001800 YES RMS Displacement 0.000447 0.001200 YES |
| |||
| C1 | 
|
Item Value Threshold Converged? Maximum Force 0.000030 0.000450 YES RMS Force 0.000016 0.000300 YES Maximum Displacement 0.000162 0.001800 YES RMS Displacement 0.000122 0.001200 YES |
| |||
| D3h | 
|
Item Value Threshold Converged? Maximum Force 0.000006 0.000450 YES RMS Force 0.000004 0.000300 YES Maximum Displacement 0.000023 0.001800 YES RMS Displacement 0.000015 0.001200 YES |
|
Day2
Optimisation
BH3:B3LYP/6-31G(d,p)
Optimisation log file here
| summary data | convergence | Jmol | |||
|---|---|---|---|---|---|

|
Item Value Threshold Converged? Maximum Force 0.000006 0.000450 YES RMS Force 0.000004 0.000300 YES Maximum Displacement 0.000023 0.001800 YES RMS Displacement 0.000015 0.001200 YES |
|
GaBr3: B3LYP/LanL2DZ
Optimisation file:DOI:10042/193799
| summary data | convergence | Jmol | |||
|---|---|---|---|---|---|

|
Item Value Threshold Converged? Maximum Force 0.000000 0.000450 YES RMS Force 0.000000 0.000300 YES Maximum Displacement 0.000003 0.001800 YES RMS Displacement 0.000002 0.001200 YES |
|
BBr3: B3LYP/Gen
Optimisation file:DOI:10042/193798
| summary data | convergence | Jmol | |||
|---|---|---|---|---|---|

|
Item Value Threshold Converged? Maximum Force 0.000008 0.000450 YES RMS Force 0.000005 0.000300 YES Maximum Displacement 0.000036 0.001800 YES RMS Displacement 0.000024 0.001200 YES |
|
Geometry Comparison
| BH3 | BBr3 | GaBr3 | |
|---|---|---|---|
| r(E-X) Å | 1.19 | 1.93 | 2.35 |
| θ(X-E-X) degrees(º) | 120.0 | 120.0 | 120.0 |
Bond lengths comparison and contrast
Simple analysis
Herein we discuss two main factors that affect the bond length: the sizes of the atomic orbitals holding the molecule together; and the electronegativity between the bonded atoms.
Changing the ligand X of EX3 from H to Br leads to an increase in the bond length as shown from the results. The valence configuration of H is 1s1; and of Br is 4s24p5, both 1 electron deficient from 8-electron full shell. The electronegativity of B,H,Br in pauling scale is 2.0, 2.1, and 2.8 respectively, which in turn causes the electronegativity difference of B-H to be 0.1; of B-Br to be 0.8. Since both bonds are covalent,the larger the electronegativity difference should give rise to stronger bond. However we should also consider the effect of orbital sizes between the bonded atoms. B and H are in period 1, and 2, they are much closer in sizes; B and Br, in the contrast, are much more different in sizes. Here the dominating factor is the orbital size. B-H has shorter bond length because they have similar sizes, and their orbital overlap is quite strong.
Changing the central atom from B to Ga results in an increase in bond length. B and Ga are in the same group, they have the same number of valance electrons. While B is in period 2, Ga is in period 4, therefore the atomic size of Ga is much larger than that of B. The bond lengths of BBr and GaBr can be rationalized by the following: although reasons from size differences and electronegativity all tends to favor B-Br to have weaker bond, the efficient orbital overlap between two period 3 atoms (Ga, Br) are much weaker than the overlap between B and Br, thus they form weaker bonds.
From covalent radii perspective In general, all these EX3 compounds have a structure of trigonal planar bearing a central group 3 central atom. All these compounds are therefore inherently electron deficient, and act as Lewis acid. Hereby for these EX3 molecules we use covalent model throughout by assuming all the interactions between the atoms are purely covalent. Accordingly we can use the covalent radii to rationalise the results.
The predicted bond length for H-Br in literature is 119 pm, which matches perfectly with our optimisation at 6-31G(d,p) level. Here minor contribution from the ionic interaction was made, which corresponds to a small electronegativity difference (0.1). For the B-Br bond length, the predicted value is 196 ppm, which deviate slightly from our optimised value (basis set=GEN) of 193 ppm here.
what is a bond
From orbital perspective [1]. A bond is originated from electrons occupying a bonding orbital were they can be spread over all the atoms and they hold the atoms in a molecule together. According to molecular orbital theory, a bonding orbital arises from the constructive interference of neighbouring atomic orbitals. A bonding orbital is so-called because comparing to separate atoms, the energy of the molecule is lowered if this orbital is occupied by electrons. An electron occupying a bonding orbital has higher chance of being found in the internuclear region, and therefore can interact strongly with the nuclei. As a result, the more overlap between orbitals, the more spreading of one orbital into the region occupied by the others, therefore a higher chance of finding electrons in between the atoms, and accordingly a stronger bond.
Form general perspective: It is helpful to make classifications of bonds. [2]. If two atoms of different atomic species make close contact, charge may flow from one to the other since the atoms have different ability to accommodate electrons. As a result, the atoms would be ionised, and oppositely charged.In the extreme case the electron would be transferred completely from one atom to the other, where an ionic bond is formed. The atoms are held to each other by electrostatic attraction. On the other hand, if two atoms are similar, electrons would tend to move back and forth between the two atom, forming instantaneous positive and negative ions. The attractions between them are described as a covalent bond. The reason why electrons behave in such a way is that they always keep trying to lower the total energy (sum of kinetic and potential energy) they possess, i.e. to be more stable. To achieve this, electrons have to make a balance between the amount of kinetic and potential energies they hold, which leads the best solution of 'shuffling back and forth' between atoms. Electrons in a covalent bond are said to be 'localised' between atoms, and they induce displacement of charges. This gives the atom pair a dipole moment. When molecules assemble, the dipole moment become important to hold the molecules together. Moreover, if fixed ionic charges are present, they would try to induce dipole moments to neighbouring atoms. Such interactions are termed van der waals force. They are different from covalent and ionic bonds since the force between them are distinguished as dispersion force. (see ref A. Holden,Bonds Between Atoms,1971,2,13).Metallic bonding can be considered as an electron 'sea' floating around an array of metals, and it is the attractions between all the freely moving electrons and positively charged cations that hold the molecule together. Another type of bond of interests that,apart form van der waals bond, often co-exist with covalent bonds is the dative bond (donor-acceptor bond). Dative bond can be regarded as a kind of covalent bond that formed between two independent molecules. During the dative interaction, one species (the donor) donate its lone pair of electrons into the vacant orbital of the other species (the acceptor).
Strength of a bond
1. Ionic bonding is the strongest among all. The bond strength is often interpreted 'bond/lattice energy': the energy needed to break up the crystal to form its component ions [3]. Since the force between ions is coulomb force, generally speaking, the ionic bond strength is proportional to the charge on the ions, and inversely proportional to the atomic radii.For example,experimental data for lattice energies[4]
| i) | ii) | |||
| Ionic species | LiF | LiI | MgO | NaCl |
| Mean bond enthalpies (kJ/mol) | 1030 | 757 | 3975 | 786 |
The former pair shows that larger atomic radii decrease the bond strength, the latter pair shows that higher charge.
2. The strength of covalent bonds can be varied to a great extent. The bond strength is dependent on orbital hybridisation and orbital overlap. Higher s-character in hybridised orbital would increase the bond strength: sp hybridised triple bond > sp2 hybridised double bond > sp3 hybridised single bond. This can be proved by experimental data[5]:
| Bond type | single bond | double bond | triple bond |
| Mean bond enthalpies (kJ/mol) | 163 | 409 | 946 |
Electronegativity also have an impact on the bond energy. The more electronegative, the stronger bond formed generally. See data below [6]
| Covalent bond | C-N | C-O | C-F |
| Mean bond enthalpies (kJ/mol) | 305 | 360 | 484 |
3. All the van der waals interactions are significantly waker than ionic and covalent bonds (strictly van der waals: o.4-4.0 kJ/mol), and the forces haver a more negative correlation with distance (they fall more rapidly with distance). Typical hydrogen bonds are stronger (~10-30 kJ/mol); Dative bonds are even stronger bonding energy (10-100 kJ/mol) but also much weaker than the ionic/covalent bonds.
How Gaussian defines bond
The Gausssian program itself have a set of predefined bond lengths. By optimising the input structure, Gaussian find the 'local minima' structure on the potential energy surface, and present the output structure as a computed model. If the length between a specific pair of atoms is longer than the bond length recorded in the database, Gaussian will not 'draw' a bond between these atoms. For instance, for the B2H6 adduct, if a low level of optimisation was performed, or if the input structure is poorly drawn, the bridging B-H bond will not appear in the output optimised structure. This is because the bridging 3c-2e interaction is relatively weak, and its easy for the program to simply ignore this interaction.
Day3
Frequency analysis
BH3 frequency analysis: B3LYP/6-21G(d,p)
Frequency file here
| summary data | low modes |
|---|---|

|
Low frequencies --- -6.3531 -1.3519 -0.0055 0.7786 8.0942 8.2063 Low frequencies --- 1162.9733 1213.1671 1213.1698 |
Vibrational spectrum for BH3
| wavenumber (cm-1) | Intensity | IR active? | type |
| 1163 | 93 | yes | bend (wagging) |
| 1213 | 14 | very slight | bend (rocking) |
| 1213 | 14 | very slight | bend (scissoring) |
| 2582 | 0 | no | stretch (symmetric) |
| 2716 | 126 | yes | stretch (anti-symmetric) |
| 2716 | 126 | yes | stretch (anti-symmetric) |
|
From the table we can see that there are 6 frequencies shown, however on the IR spectrum only three of them can be observed. Three of them (a degenerate pair at 1213 and a peak at 2582 cm-1) baring low intensities have peaks that are too small to be detected. In an IR spectrum, the peak intensities are proportional to the changes in dipole moment of the molecule during the vibration. Upon closer inspection, the vibrations causing the anti-symmetric stretches at 2157 cm-1 (degenerate) can cause largest amount of change in dipole moment. On the contrary, the vibration at 2582 cm-1 has intensity of 0, which is IR inactive. This is due to the fact that this vibration mode has zero change in dipole moment overall.
GaBr3 frequency analysis: B3LYP/LANL2DZ
Frequency log file here. DOI:10042/193808
| summary data | low modes |
|---|---|

|
Low frequencies --- -0.5252 -0.5247 -0.0024 -0.0010 0.0235 1.2011 Low frequencies --- 76.3744 76.3753 99.6982 |
Vibrational spectrum for GaBr3
| wavenumber (cm-1) | Intensity | IR active? | type |
| 76 | 3 | very slight | bend (sissoring) |
| 76 | 3 | very slight | bend (rocking) |
| 100 | 9 | very slight | bend (wagging) |
| 197 | 0 | no | stretch (symmetric) |
| 316 | 57 | yes | stretch (anti-symmetric) |
| 316 | 57 | yes | stretch (anti-symmetric) |
|
Compare and contrast: BH3 and GaBr3
Similarity: Both GaBr3 and BH3 are non linear having the same symmetry, and thus they possess same number of vibrational modes (3N-6=6, where N=number of atoms). Although we can see from the frequency analysis table that there are indeed 6 modes for both of them, however only 3 peaks are visible from IR spectra. Both molecules have two set of degenerate vibrational modes,and one peak of zero intensity. The peaks of zero intensity are caused by the vibrational mode where no change in the overall dipole moment. For peaks to be visible in IR, the molecule need a change in dipole moment.
Contrast: The most obvious difference between the two spectra is their frequency range. From the spectra we can see that the frequency of BH3 is far higher than that of GaBr3. But bare in mind that their total energies are not comparable since different basis set are used. The level of accuracy using different basis sets would deviates, and the comparison of energies based on different basis sets is meaningless. Another interesting observation is that the intensities of BH3 peaks are much higher than that of GaBr3. The difference in intensity is directly correlated to the amount of change in dipole moment during vibrations. In addition, the position of the degenerate pair on the IR spectra of two molecules differs. For BH3, the second/ third and the last two peaks form two degenerate peaks; for GaBr3, it is the first/second peak and the last two peaks forming the degenerate peaks.
Frequency difference
The large difference in frequency values indicates that the dipole moment of the two molecules are different greatly. To understand the IR, it is useful to analyse the bond using a classical vibrating spring model. The spring model can be described by the Hook's law:
where is the frequency, k is the force constant, is the reduced mass of the molecule.
Obviously since GaBr3 has a large reduced mass, the frequency would be much smaller. Also, the force constant k for GaBr3 is smaller than that of BH3. This is due to the fact that the orbital overlap between Ga and Br is much weaker than B and H, since Ga and Br are much larger in atomic radii. Weaker orbital overlap in turns result in weaker bond formed.
Reordering of modes
By inspecting the umbrella motion of both BH3 and GaBr3 one can conclude that both frequency and intensity of GaBr3 is lower than that of BH3. The frequency difference can be explained using above discussion where both GaBr3 has smaller force constant and larger reduced mass. The intensity difference comes from the extent of change in dipole moments of the molecules. From the vibration animation of the 'umbrella mode' we can see that H atom of BH3 contributes to a greater displacement change; in GaBr3 it is the centre atom Ga that shows the greater displacement change. Due to the fact that in GaBr3 the centre atom Ga is smaller and lighter than Br, the vibrational movement/ change in dipole moment for GaBr3 would be rather small; whereas in BH3, the vibrating hydrogen atoms are lighter and smaller than the centre B atom, thus the whole molecule vibrates more vigorously(larger displacement change and dipole moment change).
Discussion on basis set and frequency analysis
The first derivative of a potential energy surface is force. In Gaussian optimisation we try to optimise the conformation of the molecule by setting the force to zero. This point with zero gradient on the potential energy surface is a stationary point. But to determine whether this point is a transition state or not we need to take a look at the frequency outcomes. If there is one and only one negative frequency shows up,then the configuration of the molecule of this point is said to be the transition state(the maximum on the potential energy surface), rather than the optimised structure (optimised structure should be the minimum on the potential energy surface). Therefor by carrying our the frequency analysis we can be able to tell the nature of the stationary point, and accordingly we can determine whether the optimised structure is a transition state or not. Low frequencies have values close to zero are originated from rotational and translational modes of vibration. These should be kept as low as possible, by using a tighter convergence criteria if necessary. The low frequencies represent the minor distortions of the optimised structure, and for vibrations having low energy, a subtle change in the minor distortion would have a large impact on the energy of the outcome.
Different basis sets have different level of accuracy. A basis set with lower level of accuracy (for example, the 3-21G basis set)can result in a loss of symmetry in the optimised outcome and a more non-accurate energy value, comparing to basis sets with higher level of accuracy (for example, the 6-31G basis set). Therefore for the comparison of energy to be valid, we need to use same basis set to analyse the molecules of interest.
BH3: MO diagram: B3LYP/6-31G (d,p)

Comments
In MO theory, the LCAO approximation is used throughout. The contribution from each atomic orbital were superimposed (summed up) to build up the molecular orbital. The LCAO approximation is reasonable accurate where the number of atoms are small and atoms themselves do not have complex orbital interactions (for example, the BH3 molecule in this case). However if we want to study molecules with more complex orbital interactions, for example, the electron density is unevenly distribute; for MOs of significantly higher energy, etc, the lCAO prediction can be inaccurate.
A main restriction on the LCAO theory is that it assumes that all the MOs are built up form atomic orbitals with the same symmetry, and energy. For larger and more complex molecules,the MOs become more diffuse and the boundary between them can be very vogue, and the MO theory starts to break dowon
NH3: NBO Analysis
NH3 optimization: B3LYP/6-31G(d,p)
Frequency log file here
| summary data | convergence | Jmol | |||
|---|---|---|---|---|---|

|
Item Value Threshold Converged? Maximum Force 0.000122 0.000450 YES RMS Force 0.000058 0.000300 YES Maximum Displacement 0.000531 0.001800 YES RMS Displacement 0.000296 0.001200 YES |
|
NH3 Frequency analysis: B3LYP/6-31G (d,p)
Frequency log file here
| summary data | low modes |
|---|---|

|
Low frequencies --- -0.0137 -0.0026 0.0014 7.0783 8.0932 8.0937 Low frequencies --- 1089.3840 1693.9368 1693.9368 |
| wavenumber (cm-1) | Intensity | IR active? | type |
| 1089 | 145 | yes | bend (wagging) |
| 1694 | 14 | very slight | bend (rocking) |
| 1694 | 14 | very slight | bend (scissoring) |
| 3461 | 1 | no | stretch (symmetric) |
| 3590 | 0 | no | stretch (anti-symmetric) |
| 3590 | 0 | no | stretch (anti-symmetric) |
|
NH3 Population analysis: B3LYP/6-31G (d,p)
|
|
Summary of Natural Population Analysis:
                                      Natural Population
               Natural  -----------------------------------------------
   Atom  No    Charge         Core      Valence    Rydberg      Total
-----------------------------------------------------------------------
     N    1   -1.12514      1.99982     6.11104    0.01429     8.12514
     H    2    0.37505      0.00000     0.62250    0.00246     0.62495
     H    3    0.37505      0.00000     0.62250    0.00246     0.62495
     H    4    0.37505      0.00000     0.62250    0.00246     0.62495
=======================================================================
  * Total *    0.00000      1.99982     7.97852    0.02166    10.00000
| Atom | N | H |
|---|---|---|
| Charge | -1.125 | 0.375 |
Day 4
NH3BH3
Optimization: B3LYP/6-31G (d,p)
Optimisation log file here
| summary data | convergence | Jmol | |||
|---|---|---|---|---|---|

|
Item Value Threshold Converged? Maximum Force 0.000002 0.000015 YES RMS Force 0.000001 0.000010 YES Maximum Displacement 0.000006 0.000060 YES RMS Displacement 0.000002 0.000040 YES |
|
Frequency analysis: B3LYP/6-31G(d,p)
Frequency analysis log file here
| summary data | low modes |
|---|---|

|
Low frequencies --- -5.2655 -0.3536 -0.0532 -0.0005 1.0177 1.1179 Low frequencies --- 263.2972 632.9558 638.4570 |
| wavenumber (cm-1) | Intensity | IR active? | type |
| 263 | 0 | no | bend |
| 633 | 14 | very slight | stretch |
| 638 | 4 | no | bend |
| 638 | 4 | no | bend |
| 1069 | 41 | yes | bend |
| 1069 | 41 | yes | bend |
| 1196 | 109 | yes | bend |
| 1204 | 3 | no | bend |
| 1204 | 3 | no | bend |
| 1329 | 114 | yes | bend |
| 1676 | 28 | yes | bend |
| 1676 | 28 | yes | bend |
| 2470 | 67 | yes | stretch |
| 2530 | 231 | yes | stretch |
| 2530 | 231 | yes | stretch |
| 3463 | 3 | no | stretch |
| 3580 | 28 | yes | stretch |
| 3580 | 28 | yes | stretch |
|
Energies of the NH3BH3 bond
E(NH3)=-56.5577687 a.u.
E(BH3)=-26.6153236 a.u.
E(NH3BH3)=-83.2246891 a.u.
ΔE=E(NH3BH3)-[E(NH3)+E(BH3)]=-0.0515968 a.u.=-135.47 kJ/mol
Comments The interaction between the NH3 and BH3 is quite strong since they have a calculated value of -135.47, which can be classified as a medium strong bond, comparing to the bonds we discussed in the previous session. The calculated bonding energy is fairly sensible since it is larger than typical van der waals interaction and smaller than typical covalent and ionic bond.
Week 2: Lewis acid and bases mini project
Introduction
As a result of the presence of heavy atom Br, a mixture of basis-sets and psuedo-potential is used for better accuracy. Each isomeric structure was optimized using 6-31G(d,p) basis set first, and a psedopotential calculation for Br was set up at LanL2DZ level at the same time. Note: during the analysis the additional key words'geom=connectivity integral=grid=ultrafine pseudo=read gfinput' must be included all the time to ensure that for Br, not only the core orbitals but also the electrons were included in calculation.
For all optimisation the symmetry was first broken; then for the frequency analysis the input file was checked before calculation to see if the symmetry is retained from optimisation or not. If not, the molecule was symmetrisized before doing the frequency analysis.
The nature of E2X6 adduct
From previous analysis of BH3, GaBr3, NH3,and the AlCl2Br that we are going to study, they all belong to a category of compound that tend to form an E2X6 adduct. This is originated from the electron deficient nature of element E. Typical the elements of E are in group 3, and there are only 6 electrons in their outer-most electron shell up on bonding. As a result, the EX3 species tend to form a dimer where the lone pair of electrons on X donate its electron density on to the empty orbital of E, forming two X-E-X bridging bonds, to compensate for its electron deficient character. Each donor (X) transfers 1 electron into the acceptor (E)'s orbital. Although this is a formal transfer of electron, however, once the bond is formed, it still holding the basic covalent character, where electrons are shared between atoms. [7] Note that two types of bonds formed on element E, one is the sp2 hybridised typical 2c-2e covalent bond with terminal X, the other is the 3c-2e dative bond with the bridging X.
In addition, the interaction between the two E atoms is controversial, it is suggested that in some MOs, there is E-E orbital overlap, especially when E is form the lower part of group3 where orbitals are more defused through space.
6 Isomers of Al2Cl4Br2:

Isomers of Al2Cl4Br2
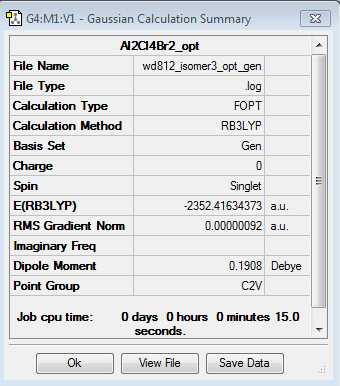
Isomer 1
Optimization: B3LYP/6-31G (d,p)/PP LANL2DZdp
DOI:10042/193948 Optimisation log file here.
| summary data | convergence | Jmol | |||
|---|---|---|---|---|---|

|
Item Value Threshold Converged? Maximum Force 0.000002 0.000015 YES RMS Force 0.000001 0.000010 YES Maximum Displacement 0.000011 0.000060 YES RMS Displacement 0.000004 0.000040 YES |
|
Frequency analysis: B3LYP/6-31G(d,p)
DOI:10042/193947 Frequency analysis log file here.
| summary data | low modes |
|---|---|

|
Low frequencies --- -1.3312 -0.7670 -0.0048 -0.0034 -0.0028 2.2427 Low frequencies --- 17.4983 51.1472 78.5270 |
| wavenumber (cm-1) | Intensity | IR active? | type |
| 18 | 0 | no | bend |
| 51 | 0 | no | bend |
| 79 | 0 | no | bend |
| 99 | 0 | no | bend |
| 103 | 3 | no | bend |
| 121 | 13 | very slight | bend |
| 123 | 6 | very slight | bend |
| 157 | 0 | no | bend |
| 158 | 5 | very slight | bend |
| 194 | 2 | no | bend |
| 263 | 0 | no | stretch |
| 279 | 26 | yes | stretch |
| 308 | 2 | no | stretch |
| 413 | 149 | yes | stretch |
| 420 | 410 | yes | stretch |
| 461 | 35 | yes | stretch |
| 571 | 33 | yes | stretch |
| 583 | 277 | yes | stretch |

Isomer 2
Optimization: B3LYP/6-31G (d,p)/PP LANL2DZdp
DOI:10042/193951 Optimisation log file here
| summary data | convergence | Jmol | |||
|---|---|---|---|---|---|

|
Item Value Threshold Converged? Maximum Force 0.000008 0.000015 YES RMS Force 0.000003 0.000010 YES Maximum Displacement 0.000047 0.000060 YES RMS Displacement 0.000022 0.000040 YES |
|
Frequency analysis: B3LYP/6-31G(d,p)
DOI:10042/193949 Frequency analysis log file here
| summary data | low modes |
|---|---|

|
Low frequencies --- -0.5675 -0.4794 0.0043 0.0046 0.0049 2.3602 Low frequencies --- 18.3306 49.2237 72.9024 |
| wavenumber (cm-1) | Intensity | IR active? | type |
| 18 | 0 | no | bend |
| 49 | 0 | no | bend |
| 73 | 0 | no | bend |
| 105 | 0 | no | bend |
| 109 | 0 | no | bend |
| 117 | 9 | very slight | bend |
| 120 | 13 | very slight | bend |
| 157 | 0 | no | bend |
| 159 | 6 | very slight | bend |
| 192 | 0 | no | bend |
| 263 | 0 | no | stretch |
| 280 | 29 | yes | stretch |
| 308 | 0 | no | stretch |
| 413 | 149 | yes | stretch |
| 421 | 438 | yes | stretch |
| 459 | 0 | no | stretch |
| 575 | 0 | no | stretch |
| 580 | 316 | yes | stretch |
|
Isomer 3
Optimization: B3LYP/6-31G (d,p)/PP LANL2DZdp
DOI:10042/193953 Optimisation log file here
| summary data | convergence | Jmol | |||
|---|---|---|---|---|---|

|
Item Value Threshold Converged? Maximum Force 0.000008 0.000015 YES RMS Force 0.000003 0.000010 YES Maximum Displacement 0.000047 0.000060 YES RMS Displacement 0.000022 0.000040 YES |
|
Frequency analysis: B3LYP/6-31G(d,p)
DOI:10042/193956 Frequency analysis log file here
| summary data | low modes |
|---|---|

|
Low frequencies --- -0.7530 -0.5954 0.0029 0.0038 0.0039 2.0895 Low frequencies --- 18.6361 51.2137 72.2011 |
| wavenumber (cm-1) | Intensity | IR active? | type |
| 19 | 0 | no | bend |
| 51 | 0 | no | bend |
| 72 | 0 | no | bend |
| 98 | 0 | no | bend |
| 112 | 0 | no | bend |
| 112 | 8 | very slight | bend |
| 120 | 11 | very slight | bend |
| 160 | 1 | no | bend |
| 166 | 7 | very slight | bend |
| 187 | 2 | no | bend |
| 263 | 0 | no | bend |
| 271 | 14 | very slight | stretch |
| 323 | 41 | yes | stretch |
| 413 | 150 | yes | stretch |
| 418 | 309 | yes | stretch |
| 495 | 134 | yes | stretch |
| 503 | 105 | yes | stretch |
| 616 | 177 | yes | stretch |
|
Isomer 4
Optimization: B3LYP/6-31G (d,p)/PP LANL2DZdp
DOI:10042/193952 Optimisation log file here
| summary data | convergence | Jmol | |||
|---|---|---|---|---|---|

|
Item Value Threshold Converged? Maximum Force 0.000001 0.000015 YES RMS Force 0.000001 0.000010 YES Maximum Displacement 0.000041 0.000060 YES RMS Displacement 0.000016 0.000040 YES |
|
Frequency analysis: B3LYP/6-31G(d,p)
DOI:10042/193957 Frequency analysis log file here
| summary data | low modes |
|---|---|

|
Low frequencies --- -0.8302 -0.0050 -0.0048 -0.0047 1.2808 1.3993 Low frequencies --- 16.0692 63.6252 86.1146 |
| wavenumber (cm-1) | Intensity | IR active? | type |
| 16 | 0 | no | bend |
| 64 | 0 | no | bend |
| 86 | 0 | no | bend |
| 87 | 0 | no | bend |
| 108 | 5 | very slight | bend |
| 111 | 0 | no | bend |
| 126 | 8 | very slight | bend |
| 135 | 0 | no | bend |
| 138 | 7 | very slight | bend |
| 163 | 0 | no | stretch |
| 197 | 0 | no | stretch |
| 241 | 100 | yes | stretch |
| 247 | 0 | no | stretch |
| 341 | 161 | yes | stretch |
| 468 | 346 | yes | stretch |
| 494 | 0 | no | stretch |
| 609 | 0 | no | stretch |
| 617 | 332 | yes | stretch |
|
Isomer 5
Optimization: B3LYP/6-31G (d,p)/PP LANL2DZdp
DOI:10042/193954 Optimisation log file here
| summary data | convergence | Jmol | |||
|---|---|---|---|---|---|

|
Item Value Threshold Converged? Maximum Force 0.000002 0.000015 YES RMS Force 0.000001 0.000010 YES Maximum Displacement 0.000046 0.000060 YES RMS Displacement 0.000017 0.000040 YES |
|
Frequency analysis: B3LYP/6-31G(d,p)
DOI:10042/193958 Frequency analysis log file here
| summary data | low modes |
|---|---|

|
Low frequencies --- -0.2366 -0.0021 -0.0007 0.0013 1.0968 1.8066 Low frequencies --- 16.9421 55.9195 80.0644 |
| wavenumber (cm-1) | Intensity | IR active? | type |
| 17 | 0 | no | bend |
| 56 | 0 | no | bend |
| 80 | 0 | no | bend |
| 92 | 0 | no | bend |
| 107 | 0 | no | bend |
| 110 | 5 | very slight | bend |
| 121 | 8 | very slight | bend |
| 149 | 5 | very slight | bend |
| 154 | 6 | very slight | bend |
| 186 | 1 | no | bend |
| 211 | 21 | very slight | stretch |
| 257 | 10 | very slight | stretch |
| 289 | 48 | yes | stretch |
| 384 | 153 | yes | stretch |
| 424 | 274 | yes | stretch |
| 493 | 107 | yes | stretch |
| 575 | 122 | yes | stretch |
| 615 | 197 | yes | stretch |
|
Isomer 6
Isomer 5 and 6 are enantiomers of each other, therefore theoretically they have the same amount of energy and vibrational frequencies, i.e., they are indistinguishable by inspecting energy values and IR spectra.
The optimisation and frequency analysis were ran just for consistency.
Optimization: B3LYP/6-31G (d,p)/PP LANL2DZdp
DOI:10042/193959 Optimisation log file here
| summary data | convergence | Jmol | |||
|---|---|---|---|---|---|

|
Item Value Threshold Converged? Maximum Force 0.000002 0.000015 YES RMS Force 0.000001 0.000010 YES Maximum Displacement 0.000046 0.000060 YES RMS Displacement 0.000017 0.000040 YES |
|
Frequency analysis: B3LYP/6-31G(d,p)
DOI:10042/193960 Frequency analysis log file here
| summary data | low modes |
|---|---|

|
Low frequencies --- -0.2366 -0.0010 0.0025 0.0037 1.0968 1.8066 Low frequencies --- 16.9421 55.9195 80.0644 |
| wavenumber (cm-1) | Intensity | IR active? | type |
| 17 | 0 | no | bend |
| 56 | 0 | no | bend |
| 80 | 0 | no | bend |
| 92 | 0 | no | bend |
| 107 | 0 | no | bend |
| 110 | 5 | very slight | bend |
| 121 | 8 | very slight | bend |
| 149 | 5 | very slight | bend |
| 154 | 6 | very slight | bend |
| 186 | 1 | no | bend |
| 211 | 21 | very slight | stretch |
| 257 | 10 | very slight | stretch |
| 289 | 48 | yes | stretch |
| 384 | 153 | yes | stretch |
| 424 | 274 | yes | stretch |
| 493 | 107 | yes | stretch |
| 575 | 122 | yes | stretch |
| 615 | 197 | yes | stretch |
|
SUMMARY

| Isomer | Symmetry | Energy (a.u.) | Energy difference | |
|---|---|---|---|---|
| in a.u. | in kJ/mol | |||
| isomer1 | C2v | -2352.4162785 | 0.0000652 | 0.17 |
| isomer 2 | C2h | -2352.4163010 | 0.0000427 | 0.11 |
| isomer 3 | C2v | -2352.4163437 | 0.0000000 | 0.00 |
| isomer 4 | D2h | -2352.4063255 | 0.0100182 | 26.30 |
| isomer 5 | C1 | -2352.4111073 | 0.0052364 | 13.75 |
| isomer 6 | C1 | -2352.4111073 | 0.0052364 | 13.75 |
Energy comparison of the isomers
Form above table we can see that the lowest energy conformer is isomer 3, with two Br atoms on the same Al atom. However, since the error of Gauss calculation is ±10 kJ/mol therefore we cannot conclude that isomer 3 is possessing the lowest energy in the real world. The only conclusion one can made is that conformer 1,2,3 have lower energy than conformer 4,5,6. Conclusion:
| Energy order | Isomer 3< Isomer 2< Isomer 1<Isomer 5= Isomer 6 |
| Energy order(taking account of Gaussian error) | Isomer 1= Isomer 2= Isomer 3< Isomer 5= Isomer 6< isomer 4 |
Position of Br atoms: effect on stability
Conformers with higher energy(less negative) values would be less stable and easier to be decomposed.
The Al-Cl orbital interaction is less stronger than the Al-Br interaction. Br is more electropositive than Cl, and the electronegativity between Al Br is smaller than that between Al Cl, thus weaker roughly we expect the AlBr bond to be weaker.As a result we are expecting the isomer with more bridging Cl to be more stable and favoured, but this is not the case.
One thing that was ignored is that the effect of orbital overlap also plays an important part. Bromine is larger in atomic size and have more diffused orbitals, hence it is probably having weaker orbital overlap integral when interacting with Al atom. On the contrary, Cl is in the same period with Al, therefore they two can form greater orbital overlap, resulting a more stabilising effect. Therefore, molecules tend to make more formal bonding (2c-2e) interactions between Al and Cl atoms, to get more stabilisation energy. This explains the trend we observed where isomer with Al in the terminal position is more stable (lower in energy) than isomers with Al in bridging position.
Dissociation to AlCl2Br monomer
Optimization: B3LYP/6-31G (d,p)/PP LANL2DZdp
Optimisation log file here
| summary data | convergence | Jmol | |||
|---|---|---|---|---|---|

|
Item Value Threshold Converged? Maximum Force 0.000002 0.000015 YES RMS Force 0.000001 0.000010 YES Maximum Displacement 0.000011 0.000060 YES RMS Displacement 0.000004 0.000040 YES |
|
Frequency analysis: B3LYP/6-31G(d,p)
DOI:10042/193962 Frequency analysis log file here
| summary data | low modes |
|---|---|

|
Low frequencies --- 0.0021 0.0033 0.0034 1.8508 1.8548 3.5866 Low frequencies --- 120.7374 133.8467 185.7650 |
| wavenumber (cm-1) | Intensity | IR active? | type |
| 121 | 5 | yes (slight) | bend |
| 134 | 6 | yes (slight) | bend |
| 186 | 33 | yes | bend |
| 314 | 7 | yes (slight) | stretch |
| 552 | 174 | yes | stretch |
| 614 | 186 | yes | stretch |
| 123 | 6 | yes (slight) | stretch |

Dissociation energy
E(AlCl2Br)=-1176.1901404 a.u.
E(Al2Cl4Br2)=-2352.4163437 a.u.
ΔE=E(Al2Cl4Br2)-2E(AlCl2Br)=-0.0360629 a.u.=-94.68 kJ/mol
The dimer is more stable than two isolated monomers. Compared with B, Al is more readily to expand its coronation number, and forming a dimerised structure. However, the pi interaction between Al and Br is not sufficiently large enough to receive the electron deficiency on the Al atom, therefore Al adduct tend to dimmers to form a more stabled structure.
Frequency analysis: vibration modes
To compare the difference in vibration of terminal and bridging Cl/Br, herein two modes of motion were chosen, and the vibration modes were picked up from each isomer. The frequencies corresponding to these modes of all the isomers were recorded and analysed. Isomer 1 and 2 have very similar frequencies for this mode, and therefore we can see that the most stable forms of the bond are when both bromine atoms are in the terminal position and when they are not on the same Al atom. Here we mainly discuss and compare the frequencies rather than intensities. Intensity is simply proportional to the change in dipole moment.
Terminal stretches

| Isomer | Symmetry | Mode number | Frequency | Intensity |
|---|---|---|---|---|
| 1 | C2v | 18 | 583 | 277 |
| 2 | C2h | 18 | 580 | 316 |
| 3 | C2v | 16,18 | 495,616 | 134,177 |
| 4 | D2h | 18 | 617 | 332 |
| 5 (6) | C1 | 17,18 | 575,615 | 122,197 |
| isomer 1 | isomer2 | isomer 3 | isomer 4 | isomer 5(6) |

gif here |

gif here |

gif here |

gif here |

gif here |

gif here |

gif here |
The bonds that are kept still is the four bonds in the centre. The terminal bonds are subject to vibrational motion. From the above table we can see that isomer 1, 2, and 4 have symmetry element that are more subject to the symmetrical vibrational motion under study. The Br atoms in these isomers balance each other on the left- and right- hand side of the molecule (if we say the draw a line through the two bridging atoms bisecting the molecule into two). Isomer 3,5 have two frequency, since for the selected(symmetrical) vibrational motion, the symmetry of these isomers allow them to only adopt vibration at one side at a time. That's the reason why they have two frequencies.
To discuss magnitude of the frequencies, from the frequency data we can see that with regards to the motion of the terminal bonds, if one/two bromine atoms are on the terminal position, the frequency would decrease. This is reasonable since here the atoms subject to the motion is the terminal ones, and the higher in mass (reduced mass) of these vibrating atoms, the lower the frequencies. Thus isomer 1,2 and 3 with one or more bromine atoms in the terminal vibrating motion would have lower frequency subject to the vibrational motion chosen.
Bridging stretches

| Isomer | Symmetry | Mode number | Frequency | Intensity |
|---|---|---|---|---|
| 1 | C2v | 14 | 413 | 149 |
| 2 | C2h | 14 | 413 | 149 |
| 3 | C2v | 14 | 413 | 150 |
| 4 | D2h | 14 | 341 | 161 |
| 5 (6) | C1 | 14 | 384 | 153 |
| isomer 1 | isomer2 | isomer 3 | isomer 4 | isomer 5(6) |

gif here |

gif here |

gif here |

gif here |

gifhere |
From the data shown above, we can see that isomer 1,2 and 3 have same magnitude of frequencies. This suggests that the relative positions of the terminal atoms has no effect on the vibration of the bridging bonds. It is the mass of the atoms under vibration that affects the frequency. Isomer 4 with two heavier bromine atoms in the bridging position has the lowest frequency among all. This is explained again using the Hook's law where higher mass (reduced mass) would lead to lower frequencies of the vibration.
Terminal/bridging?
Compare to the terminal stretches, we can see that the bridging stretches are obviously having lower frequencies. Terminal stretches: 580;495;616;617;575,615 cm-1 (isomer 1-5); bridging stretches: 413 (isomer 1,2,3);341;384 (isomer 4-5). To explain for that observation we have to first think about the nature of the terminal and the bridging bond: terminal bond is a 2c-2e covalent bond, whereas the bridging bond is a 3c-2e dative bond. In nature , the dative (bridging) bond would be much weaker then the covalent (terminal) bond. From previous discussion we can see that frequency is dependent on k, the force constant. Therefore we can draw the conclusion that bridging bond has lower frequency than the terminal bond owning to its weaker bond nature.
MO analysis of the isomer with lowest energy
Computed orbitals were generated by using optimised structure of isomer3. The chk formatted output file was then opened, and the MO orbitals were visualised and studied. There are 54 occupied orbitals, and the first 30 are core orbitals (orbitals are numbered according to their energy),which is not of interest. The MOs between MO31 and MO54 are valence orbitals, and are subject to our study. There is a big energy jump between core and valence orbitals. In addition,unoccupied orbitals are not comparable with the occupied ones, since they are much more diffuse, thus we ignore any orbitals higher than MO54. For MO analysis, we are aiming to find five non-core MOs with tapering 'bonding character' (Ideally strong bonding-->weak bonding-->non bonding-->weak anti-bonding--> strong anti-bonding, but in reality hard to define the boundaries).
With regard to the fact that the MOs of the dimer were built from fragment orbitals (FOs), MO of the dimer can be considered as a combination of FOs of AlClBr2 and AlCl3. These two FOs have some common features with AlCl3 FOs (the main discrepancy comes form the electronegativity factor). Since AlCl3 is in hypervalent with BH3, therefore the interpretation of some of the MOs can be borrowed from previous exercise (in 'Day 3' section).
To examine each MO, the orbital components of the dimer were analysed empirically from fragment orbitals (from EX3 and EH3 fragment). Bare in mind the three-centre two-electorn interactions where "two electrons occupy a bonding MO which is delocalised over three atomic centres" (ref:p 124-127 of Inorganic Chemistry, Catherine Housecroft and Alan Sharpe, 2nd Edition, Pearson, Prentice Hall, Harlow, 2005)
Notice that all these different orbital combine through overlying on each other. Although for some individual orbital the electron density seems to be localized on electro-positive bromine aotms, however by looking at the combination of all the whole set of orbital, overall the electron density is still on the the more electronegative species.
Only main interactions are analysed, any through-space nteraction between considerable long distance atoms is ignored.
MO 37

By inspecting the shape of the competed MO, we can deduce the AOs involved in the orbital overlap. Interaction a,b,c are all caused by the strong in-phase overlap between the s-orbital of Al and the outward leaning p-orbital of Cl. This interaction is quite strong,and contribute to the overall strong bonding interaction of the MO.
From the orbital diagram we can also see that there are 2 internuclear nodes at terminal chlorine atoms, and there is one nodal plane bisecting the bridging chlorine atoms. But for the red and green lobes on the Al atoms, there is no node in between. In addition, the electron density is delocalized through the four frame bonds in the centre, and there is accordingly a stabilising effect caused by this delocalisation.
Overall: strong bonding
MO 52

From the diagram we can see that there is a strong p-p orbital overlap( interaction)between the terminal bromine atoms. The orbitals of the bridging atoms are orthogonal to this bonding interaction, and therefore although it seems like there is a weak anti-bonding interaction, there is actually no anti-bonding contribution. The electron density is localised on the bonding orbital, as we can see from the diagram there are large lobes on the terminal bromine atoms. There is one nodal plane in plane with the bridging bonds bisecting the bridging bromine atoms; and there are two internuclear nodes on the terminal bromine atoms. Overall the electron density is localised on the terminal chlorine atoms, and comparing to MO37, since the electron density is more localised, and less delocalised, the energy of this orbital is higher than that of MO37.
Overall: strong bonding
MO 46

Form the MO diagram we can see that there are 5 through-space interactions in this MO. The interaction between two terminal bromine atoms are fairly strong. The interaction between the bridging chlorine atoms and the terminal bromine atoms in the 'front view' are through-space medium sized anti-bonding interaction. The bridging chorine atoms also forms a weak through-space anti-bondig orbital with the terminal chlorine atoms. There is one nodal plane bisecting the bridging chlorines, and there are 6 internuclear nodes on all the halogen atoms. Notice that here we assume there is no through-space bonding interaction between the two bridging chlorine atoms, since in the computed MO diagram shown above, there two lobes on these bridging atoms are not connected. Overall the electron density is only delocalised a certain extent, while with the bromine atoms baring most electron densities.
Overall: strong anti-bonding
MO 49

From the MO diagram we can see that there are mainly 3 through-space anti-bonding interactions. The most effective interaction takes place between the terminal chlorine atoms, and the interaction between the bridging and terminal chlorine atoms are medium sized. We can find 2 nodal planes (shown in the diagram) and 2 internuclear nodes on the bridging chlorine atoms. Over all the electron density is localised on the terminal chlorine atoms, and thus comparing with MO46 , the whole orbital is higher in energy, due to this lesser extent of delocalisation.
Overall: strong anti-bonding
MO 50

From the MO diagram we can see that the anti-boding interaction is very similar to that of MO 49, but the difference between these two is that the orientation of the p-orbitals of the terminal chlorine atoms. The orientation in MO50 allows the bridging chlorine atoms to react more strongly with the terminal atoms, therefore a even larger anti-bonding interaction exists in MO50. The electron density is not fully delocalised, in stead the electron density is localised more on the terminal chlorine atoms.
Overall: strong anti-bonding
Conclusion
From this exercise, energies and vibrational modes of 5 isomers of Al2Cl4Br were took place by using 6-31 G (d,p) basis set on Al/Cl, and LANL2DZdp for more largely sized Br atoms. Relative energies are calculated and compared. Frequency analysis on the lowest energy isomer allow us to rationalise the effect of different stretching modes, and the effect of changing the bridging/ terminal atom bring to the frequencies. Molecular orbital analysis was also carried out to visualise and conclude the overall bonding/ anti-bonding character.
- ↑ Atkins,Inorgchemistry 5th ed.,2,50
- ↑ A. Holden,Bonds Between Atoms,1971,2,5
- ↑ N.W. Alcock, Bonding and structure, 1990,4.7, 85
- ↑ S. Atkins,Inorganic chemistry 5ed,2009, 3, 86
- ↑ S. Atkins,Inorganic chemistry 5ed,2009, 3, 60)
- ↑ S. Atkins,Inorganic chemistry 5ed,2009, 3, 60
- ↑ R.J.Gillespie, P.L.A Popelier, Chemical Bonding and Molecular Geometry, 2001,1.