Rep:Mod:wadarmy
Introduction
This module aims to highlight the key uses of the Gaussview computational chemistry software and to illustrate how the various features can be interpreted to help us understand key information regarding molecular and electronic structures of a molecule. Initially, the basic concepts are investigated by studying three similar, but slightly different, trigonal planar structures; these differences between the structures are then used to illustrate how certain molecular features affect the way in which we model and represent them computationally.
Optimisation of Molecular Structures
Optimising BH3
The first type of calculation to be studied was the optimisation. This is a process in which the Schrodinger equation is solved for the electrons and the energy at various different arrangements of nuclear positions. The position which results in the lowest possible energy gives rise to the optimised geometry. This minimum energy point is representative of the equilibrium point for the structure, the point at which the structure exists in the most stable form possible. In such calculations, basis sets and pseudo-potentials are used to model the behaviour of the atoms involved in the structure. Initially only basis sets are considered, as pseudo-potentials are used only for heavier atoms in which certain effects are observed that are not accounted for by the standard Schrodinger equation. Basis sets dictate the number of functions used to describe the electronic structure of a given atom. To begin with, a low-level accuracy basis set (3-21G) was adopted for the initial optimisation.
The initial optimisation file (using the 3-21G basis set) is linked to here.
Item               Value     Threshold  Converged?
 Maximum Force            0.000413     0.000450     YES
 RMS     Force            0.000271     0.000300     YES
 Maximum Displacement     0.001610     0.001800     YES
 RMS     Displacement     0.001054     0.001200     YES
 Predicted change in Energy=-1.071764D-06
 Optimization completed.
    -- Stationary point found.
                           ----------------------------
                           !   Optimized Parameters   !
                           ! (Angstroms and Degrees)  !
 --------------------------                            --------------------------
 ! Name  Definition              Value          Derivative Info.                !
 --------------------------------------------------------------------------------
 ! R1    R(1,2)                  1.1935         -DE/DX =    0.0004              !
 ! R2    R(1,3)                  1.1935         -DE/DX =    0.0004              !
 ! R3    R(1,4)                  1.1935         -DE/DX =    0.0004              !
 ! A1    A(2,1,3)              120.0            -DE/DX =    0.0                 !
 ! A2    A(2,1,4)              120.0            -DE/DX =    0.0                 !
 ! A3    A(3,1,4)              120.0            -DE/DX =    0.0                 !
 ! D1    D(2,1,4,3)            180.0            -DE/DX =    0.0                 !
 --------------------------------------------------------------------------------
 GradGradGradGradGradGradGradGradGradGradGradGradGradGradGradGradGradGrad
The Jmol for this optimisation found via this
Total energy for 3-21G optimised structure = -26.38296912 a.u.
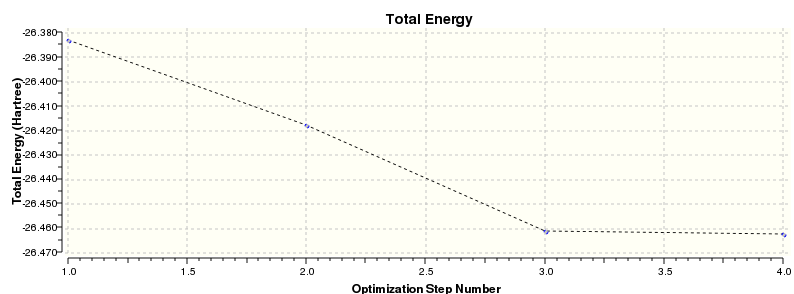
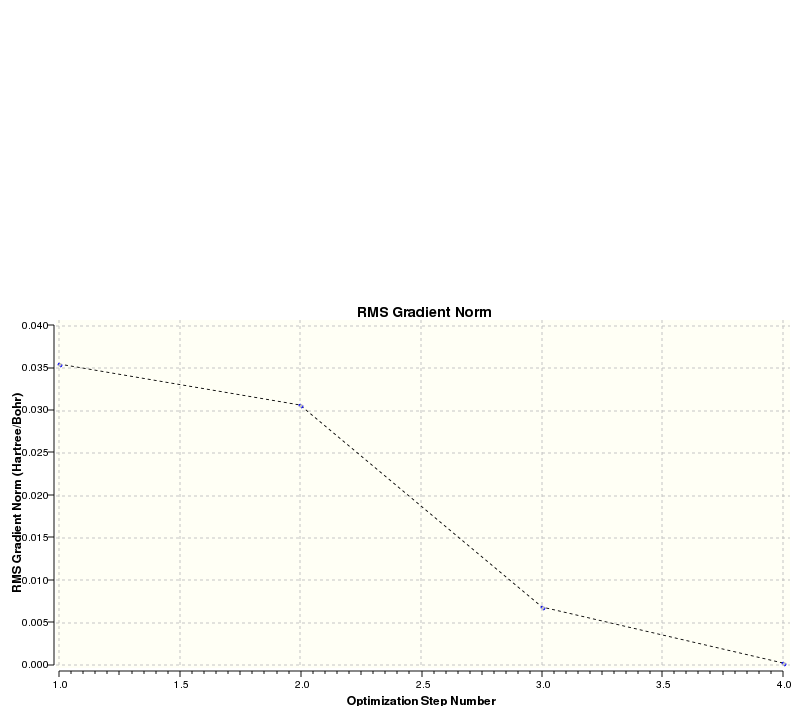
The 'Item' table above contains information which allows the confirmation as to whether the calculation was successful or not. The derivative info. contains values for the gradient of the energy vs. distance plot (i.e. force): this value is close to zero (i.e. ±0.001) indicating the turning point required for a minimum energy point. However the more definitive feature of a successful calculation is whether the forces have converged or not (i.e. whether or not the gradient remains unchanged for small changes in distance). These two features can both be represented graphically in the optimisation plots (see below).
The second plot shows how the gradient reaches zero at the end of the optimisation, confirming that the minimum has been reached.
The optimised borane molecule was then optimised a second time, this time using a better basis set (6-31G) to improve the accuracy of the optimisation.
The second optimisation file (using the 6-31G basis set) is linked to here.
Item               Value     Threshold  Converged?
 Maximum Force            0.000433     0.000450     YES
 RMS     Force            0.000284     0.000300     YES
 Maximum Displacement     0.001702     0.001800     YES
 RMS     Displacement     0.001114     0.001200     YES
 Predicted change in Energy=-1.189019D-06
 Optimization completed.
    -- Stationary point found.
                           ----------------------------
                           !   Optimized Parameters   !
                           ! (Angstroms and Degrees)  !
 --------------------------                            --------------------------
 ! Name  Definition              Value          Derivative Info.                !
 --------------------------------------------------------------------------------
 ! R1    R(1,2)                  1.1914         -DE/DX =    0.0004              !
 ! R2    R(1,3)                  1.1914         -DE/DX =    0.0004              !
 ! R3    R(1,4)                  1.1914         -DE/DX =    0.0004              !
 ! A1    A(2,1,3)              120.0            -DE/DX =    0.0                 !
 ! A2    A(2,1,4)              120.0            -DE/DX =    0.0                 !
 ! A3    A(3,1,4)              120.0            -DE/DX =    0.0                 !
 ! D1    D(2,1,4,3)            180.0            -DE/DX =    0.0                 !
 --------------------------------------------------------------------------------
 GradGradGradGradGradGradGradGradGradGradGradGradGradGradGradGradGradGrad
The Jmol for this optimisation found via this
Optimised B-H bond length = 1.19143Å
Optimised H-B-H bond angle = 120.0000o
Total energy for 6-31G optimised structure = -26.61532252 a.u.
Optimising TlBr3
Thallium tribromide was optimised, however this required the use of psuedo-potentials with a medium-level basis set (Los Alamos ECP) in order to achieve sufficient accuracy for the structure containing heavier atoms.
Optimised TlBr3 results.
File Type:    .log
Calculation Type:    FOPT
Calculation Method:    RB3LYP
Basis Set:    LANL2DZ
Charge:    0
Spin:    Singlet
E(RB3LYP):    -91.21812851     a.u.
RMS Gradient Norm:    0.00000090     a.u.
Imaginary Freq
Dipole Moment:    0.0000     Debye
Point Group:    D3h
Job CPU time:  0 days  0 hours  0 minutes 37.8 seconds.
The optimisation file is linked to here.
 Item               Value     Threshold  Converged?
 Maximum Force            0.000002     0.000450     YES
 RMS     Force            0.000001     0.000300     YES
 Maximum Displacement     0.000022     0.001800     YES
 RMS     Displacement     0.000014     0.001200     YES
 Predicted change in Energy=-6.084081D-11
 Optimization completed.
    -- Stationary point found.
                           ----------------------------
                           !   Optimized Parameters   !
                           ! (Angstroms and Degrees)  !
 --------------------------                            --------------------------
 ! Name  Definition              Value          Derivative Info.                !
 --------------------------------------------------------------------------------
 ! R1    R(1,2)                  2.651          -DE/DX =    0.0                 !
 ! R2    R(1,3)                  2.651          -DE/DX =    0.0                 !
 ! R3    R(1,4)                  2.651          -DE/DX =    0.0                 !
 ! A1    A(2,1,3)              120.0            -DE/DX =    0.0                 !
 ! A2    A(2,1,4)              120.0            -DE/DX =    0.0                 !
 ! A3    A(3,1,4)              120.0            -DE/DX =    0.0                 !
 ! D1    D(2,1,4,3)            180.0            -DE/DX =    0.0                 !
 --------------------------------------------------------------------------------
 GradGradGradGradGradGradGradGradGradGradGradGradGradGradGradGradGradGrad
The Jmol for this optimisation found via this
Optimised Tl-Br bond length = 2.65095Å
Optimised Br-Tl-Br bond angle = 120.0000o. This value has been compared to literature,[1] which is in agreement with the value obtained in this calculation. Slight deviations can be expected due to variations between optimisations performed by the software.
Total energy for optimised structure = -91.21812851 a.u.
Optimising BBr3
Boron tribromide contains both light and heavy atoms therefore this optimisation was performed using the GEN basis, which allows us to choose a basis set/pseudo-potential for each atom within the structure. The 6-31G basis set was chosen for the boron atom and the Los Alamos ECP was chosen for the bromine atoms.
File Type:    .log
Calculation Type:    FOPT
Calculation Method:    RB3LYP
Basis Set:    GEN
Charge:    0
Spin:    Singlet
E(RB3LYP):    -64.43645296     a.u.
RMS Gradient Norm:    0.00000382     a.u.
Imaginary Freq
Dipole Moment:    0.0000     Debye
Point Group:    D3h
Job CPU time:  0 days  0 hours  0 minutes 36.2 seconds.
The optimisation file is linked to here.
Item               Value     Threshold  Converged?
 Maximum Force            0.000008     0.000450     YES
 RMS     Force            0.000005     0.000300     YES
 Maximum Displacement     0.000036     0.001800     YES
 RMS     Displacement     0.000023     0.001200     YES
 Predicted change in Energy=-4.027672D-10
 Optimization completed.
    -- Stationary point found.
                           ----------------------------
                           !   Optimized Parameters   !
                           ! (Angstroms and Degrees)  !
 --------------------------                            --------------------------
 ! Name  Definition              Value          Derivative Info.                !
 --------------------------------------------------------------------------------
 ! R1    R(1,2)                  1.934          -DE/DX =    0.0                 !
 ! R2    R(1,3)                  1.934          -DE/DX =    0.0                 !
 ! R3    R(1,4)                  1.934          -DE/DX =    0.0                 !
 ! A1    A(2,1,3)              120.0            -DE/DX =    0.0                 !
 ! A2    A(2,1,4)              120.0            -DE/DX =    0.0                 !
 ! A3    A(3,1,4)              120.0            -DE/DX =    0.0                 !
 ! D1    D(2,1,4,3)            180.0            -DE/DX =    0.0                 !
 --------------------------------------------------------------------------------
 GradGradGradGradGradGradGradGradGradGradGradGradGradGradGradGradGradGrad
The Jmol for this optimisation found via this
Optimised B-Br bond length = 1.93396Å
Optimised Br-B-Br bond angle = 120.0000o.
Total energy for optimised structure = -64.43645296 a.u.
Comparing optimised structures
| Molecule | Bond length (Å) |
| BH3 | 1.19143 |
| BBr3 | 1.93396 |
| TlBr3 | 2.65095 |
Comparison of bond lengths for all three optimised molecules shows unsurprisingly that there a relationship between the size of the molecule and bond length. Comparison of borane with boron tribromide allows us to observe the effect of changing the ligand for the same atomic centre. Hydrogen and bromine both have odd numbers of valence electrons, hence they both tend towards the formation of single bonds with other atoms. However the two atoms contrast hugely in size; hydrogen has just one electron and a small atomic radius, whilst bromine has a much larger atomic radius and seven valence electrons, including three lone electron pairs. The larger atomic radius also results in more diffuse atomic orbitals, reducing the strength of the overlap between orbitals during bonding, hence giving rise to weaker and thus longer bonds.
The steric effects observed are also a key factor when considering the effect of changing the central atom for the same ligands. Comparison of boron tribromide with thallium tribromide allows us to observe this effect and it is clear that the difference in size between boron and thallium is crucial here. Thallium has a larger atomic radius than boron and therefore more diffuse orbitals. Consequently, despite there being a mismatch in the size of the orbitals between central atom and ligand in both cases, the effect is enhanced more significantly in the case of thallium. This, combined with the steric bulk of the larger thallium metal centre, results in longer bonds in the thallium compound than in the boron compound.
Amongst the above discussions regarding bond length, it is important to note what constitutes a bond in the first place. IUPAC defines a chemical bond to exist where forces are acting between two atoms that lead to the formation of a stable molecular entity; it is further stated that the principal characteristic of a bond is the existence of a region between the nuclei of constant potential contours.[2] It is this region on which Gaussview bases its interpretation of the existence of bonds; Gaussview uses a pre-determined value to differentiate between whether a bond is present or not. Consequently in some instances, Gaussview may fail to display a bond in a structure even though that bond is present in reality. However bond order is not necessarily an integer value like Gaussview interprets; in actual fact, as a bond is formed it is simply starting at zero order and gradually increasing as the two atoms get closer, the internuclear region becomes smaller and the orbital overlap increases.
Vibrational Analysis of Optimised Structures
Frequency analysis for BH3
The re-optimised borane structure (i.e. the structure optimised using the 6-31G basis set) was used to perform a frequency calculation (i.e. vibrational analysis) in order to further confirm that the structure present was of a minimum energy.
File Type:    .log
Calculation Type:    FREQ
Calculation Method:    RB3LYP
Basis Set:    6-31G(d,p)
Charge:    0
Spin:    Singlet
E(RB3LYP):    -26.61532252     a.u.
RMS Gradient Norm:    0.00021669     a.u.
Imaginary Freq:    0
Dipole Moment:    0.0000     Debye
Point Group:    D3h
Job CPU time:  0 days  0 hours  1 minutes 57.0 seconds.
The results file for the frequency analysis is linked to here.
 Item               Value     Threshold  Converged?
 Maximum Force            0.000433     0.000450     YES
 RMS     Force            0.000217     0.000300     YES
 Maximum Displacement     0.001697     0.001800     YES
 RMS     Displacement     0.000848     0.001200     YES
 Predicted change in Energy=-1.103020D-06
 Optimization completed.
    -- Stationary point found.
 GradGradGradGradGradGradGradGradGradGradGradGradGradGradGradGradGradGrad
The above 'Item' table confirmed that the calculation had converged, hence was successful.
Low frequencies ---  -70.3431  -69.5542  -69.5540   -0.0055    0.0695    0.1595
 Low frequencies --- 1161.4019 1212.1084 1212.1111
 Harmonic frequencies (cm**-1), IR intensities (KM/Mole), Raman scattering
 activities (A**4/AMU), depolarization ratios for plane and unpolarized
 incident light, reduced masses (AMU), force constants (mDyne/A),
 and normal coordinates:
                     1                      2                      3
                    A2"                    E'                     E'
 Frequencies --  1161.4019              1212.1084              1212.1111
 Red. masses --     1.2531                 1.1072                 1.1072
 Frc consts  --     0.9959                 0.9584                 0.9584
 IR Inten    --    92.7103                13.9813                13.9849
  Atom  AN      X      Y      Z        X      Y      Z        X      Y      Z
     1   5     0.00   0.00   0.16     0.00   0.10   0.00    -0.10   0.00   0.00
     2   1     0.00   0.00  -0.57     0.00   0.08   0.00     0.81   0.00   0.00
     3   1     0.00   0.00  -0.57    -0.39  -0.59   0.00     0.14   0.39   0.00
     4   1     0.00   0.00  -0.57     0.39  -0.59   0.00     0.14  -0.39   0.00
                     4                      5                      6
                    A1'                    E'                     E'
 Frequencies --  2587.8127              2721.5176              2721.5188
 Red. masses --     1.0078                 1.1273                 1.1273
 Frc consts  --     3.9765                 4.9196                 4.9196
 IR Inten    --     0.0000               126.1376               126.1280
  Atom  AN      X      Y      Z        X      Y      Z        X      Y      Z
     1   5     0.00   0.00   0.00     0.11   0.00   0.00     0.00   0.11   0.00
     2   1     0.00   0.58   0.00     0.02   0.00   0.00     0.00  -0.81   0.00
     3   1     0.50  -0.29   0.00    -0.60   0.36   0.00     0.36  -0.19   0.00
     4   1    -0.50  -0.29   0.00    -0.60  -0.36   0.00    -0.36  -0.19   0.00
The above table gives values for the low ('zero') frequencies recorded for the structure, and the symmetry groups assigned to each frequency.
This calculation was repeated, this time restricting the symmetry of the molecule to adopt the D3h point group.
File Type:    .log
Calculation Type:    FREQ
Calculation Method:    RB3LYP
Basis Set:    6-31G(d,p)
Charge:    0
Spin:    Singlet
E(RB3LYP):    -26.61532252     a.u.
RMS Gradient Norm:    0.00021669     a.u.
Imaginary Freq:    0
Dipole Moment:    0.0000     Debye
Point Group:    D3h
Job CPU time:  0 days  0 hours  1 minutes 56.0 seconds.
The results file for the frequency analysis is linked to here.
Item               Value     Threshold  Converged?
 Maximum Force            0.000433     0.000450     YES
 RMS     Force            0.000217     0.000300     YES
 Maximum Displacement     0.001697     0.001800     YES
 RMS     Displacement     0.000848     0.001200     YES
 Predicted change in Energy=-1.103011D-06
 Optimization completed.
    -- Stationary point found.
 GradGradGradGradGradGradGradGradGradGradGradGradGradGradGradGradGradGrad
Low frequencies ---  -70.3430  -69.5541  -69.5539   -0.0054    0.0695    0.1595
 Low frequencies --- 1161.4019 1212.1084 1212.1111
 Harmonic frequencies (cm**-1), IR intensities (KM/Mole), Raman scattering
 activities (A**4/AMU), depolarization ratios for plane and unpolarized
 incident light, reduced masses (AMU), force constants (mDyne/A),
 and normal coordinates:
                     1                      2                      3
                    A2"                    E'                     E'
 Frequencies --  1161.4019              1212.1084              1212.1111
 Red. masses --     1.2531                 1.1072                 1.1072
 Frc consts  --     0.9959                 0.9584                 0.9584
 IR Inten    --    92.7103                13.9813                13.9849
  Atom  AN      X      Y      Z        X      Y      Z        X      Y      Z
     1   5     0.00   0.00   0.16     0.00   0.10   0.00    -0.10   0.00   0.00
     2   1     0.00   0.00  -0.57     0.00   0.08   0.00     0.81   0.00   0.00
     3   1     0.00   0.00  -0.57     0.39  -0.59   0.00     0.14  -0.39   0.00
     4   1     0.00   0.00  -0.57    -0.39  -0.59   0.00     0.14   0.39   0.00
                     4                      5                      6
                    A1'                    E'                     E'
 Frequencies --  2587.8127              2721.5176              2721.5187
 Red. masses --     1.0078                 1.1273                 1.1273
 Frc consts  --     3.9765                 4.9196                 4.9196
 IR Inten    --     0.0000               126.1376               126.1280
  Atom  AN      X      Y      Z        X      Y      Z        X      Y      Z
     1   5     0.00   0.00   0.00     0.11   0.00   0.00     0.00   0.11   0.00
     2   1     0.00  -0.58   0.00     0.02   0.00   0.00     0.00  -0.81   0.00
     3   1     0.50   0.29   0.00    -0.60  -0.36   0.00    -0.36  -0.19   0.00
     4   1    -0.50   0.29   0.00    -0.60   0.36   0.00     0.36  -0.19   0.00
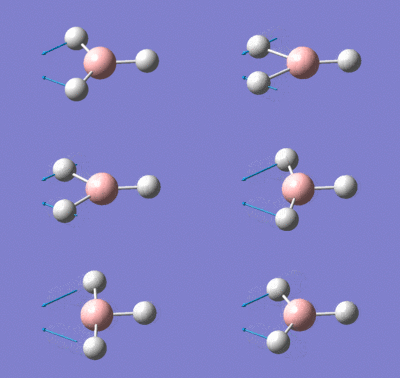
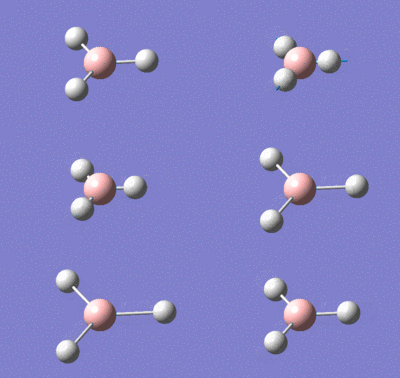
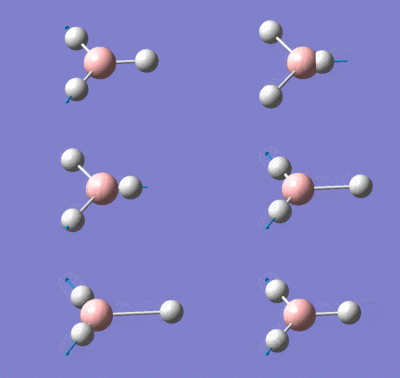
The individual vibrations for each frequency were then analysed and animated in accordance with the corresponding symmetry group; this is illustrated in the table below.
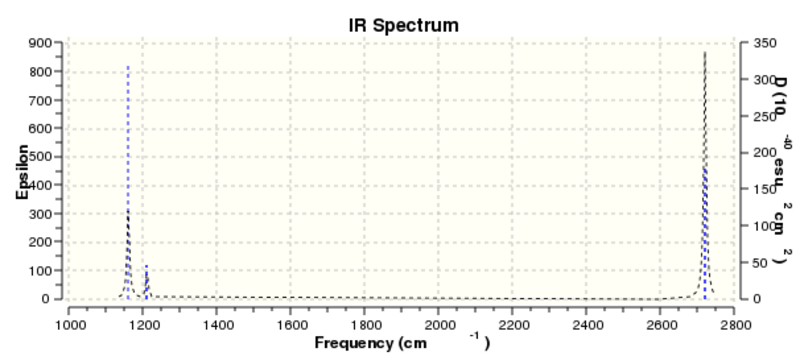
The frequency data obtained from the above analysis can be represented by the vibrational spectrum:
It should be noted that the frequency analysis calculated six different forms of vibration, however the infrared spectrum only displays three peaks. The peak at 1212.11 cm-1 in fact represents two vibrational forms, as does the peak at 2721.52 cm-1. In addition, the vibration at a frequency of 2587.81 cm-1 has been calculated to have zero intensity, which means that it would be invisible in the infrared spectrum; vibrations with very low intensities are often very difficult (sometimes impossible) to detect in the spectrum. The net effect of the above is that only three signals are observed in the vibrational spectrum.
Frequency analysis for TlBr3
The same vibrational analysis conducted on borane was also performed on thallium tribromide.
TlBr3 frequency analysis results.
File Type:    .log
Calculation Type:    FREQ
Calculation Method:    RB3LYP
Basis Set:    LANL2DZ
Charge:    0
Spin:    Singlet
E(RB3LYP):    -91.21812851     a.u.
RMS Gradient Norm:    0.00000088     a.u.
Imaginary Freq:    0
Dipole Moment:    0.0000     Debye
Point Group:    D3h
Job CPU time:  0 days  0 hours  0 minutes 28.1 seconds.
The results file for the frequency analysis is linked to here.
        Item               Value     Threshold  Converged?
 Maximum Force            0.000002     0.000450     YES
 RMS     Force            0.000001     0.000300     YES
 Maximum Displacement     0.000022     0.001800     YES
 RMS     Displacement     0.000011     0.001200     YES
 Predicted change in Energy=-5.660901D-11
 Optimization completed.
    -- Stationary point found.
 GradGradGradGradGradGradGradGradGradGradGradGradGradGradGradGradGradGrad
Once again, the above 'Item' table confirmed that a successful calculation was performed.
Low frequencies ---   -3.4213   -0.0026   -0.0004    0.0015    3.9367    3.9367
 Low frequencies ---   46.4289   46.4292   52.1449
 Harmonic frequencies (cm**-1), IR intensities (KM/Mole), Raman scattering
 activities (A**4/AMU), depolarization ratios for plane and unpolarized
 incident light, reduced masses (AMU), force constants (mDyne/A),
 and normal coordinates:
                     1                      2                      3
                    E'                     E'                     A2"
 Frequencies --    46.4289                46.4292                52.1449
 Red. masses --    88.4613                88.4613               117.7209
 Frc consts  --     0.1124                 0.1124                 0.1886
 IR Inten    --     3.6867                 3.6867                 5.8466
  Atom  AN      X      Y      Z        X      Y      Z        X      Y      Z
     1  81     0.00   0.28   0.00    -0.28   0.00   0.00     0.00   0.00   0.55
     2  35     0.00   0.26   0.00     0.74   0.00   0.00     0.00   0.00  -0.48
     3  35     0.43  -0.49   0.00    -0.01  -0.43   0.00     0.00   0.00  -0.48
     4  35    -0.43  -0.49   0.00    -0.01   0.43   0.00     0.00   0.00  -0.48
                     4                      5                      6
                    A1'                    E'                     E'
 Frequencies --   165.2685               210.6948               210.6948
 Red. masses --    78.9183               101.4032               101.4032
 Frc consts  --     1.2700                 2.6522                 2.6522
 IR Inten    --     0.0000                25.4830                25.4797
  Atom  AN      X      Y      Z        X      Y      Z        X      Y      Z
     1  81     0.00   0.00   0.00     0.42   0.00   0.00     0.00   0.42   0.00
     2  35     0.00  -0.58   0.00     0.01   0.00   0.00     0.00  -0.74   0.00
     3  35     0.50   0.29   0.00    -0.55  -0.32   0.00    -0.32  -0.18   0.00
     4  35    -0.50   0.29   0.00    -0.55   0.32   0.00     0.32  -0.18   0.00
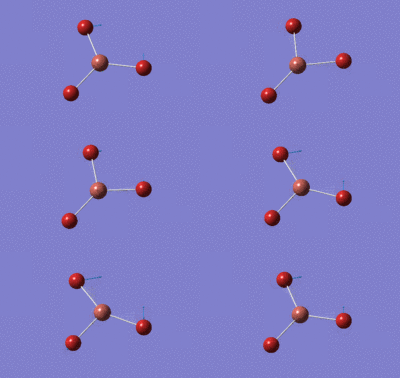
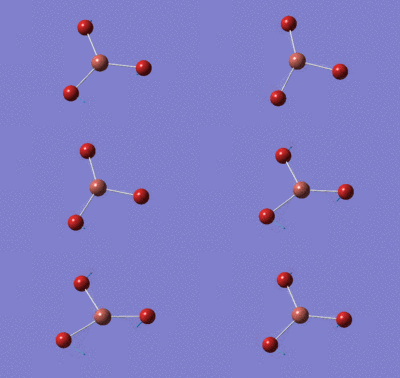
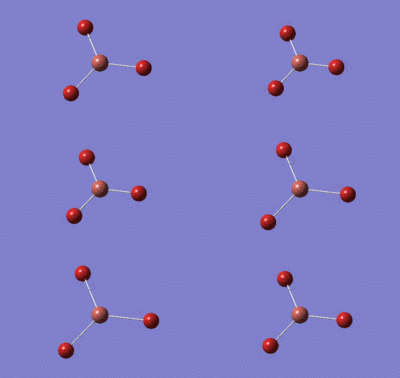
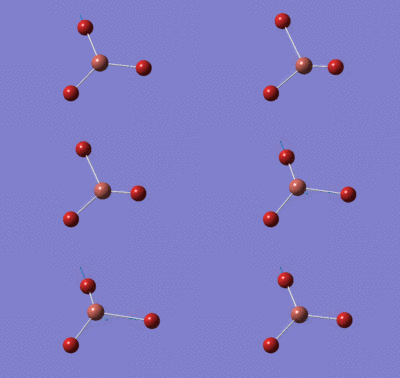
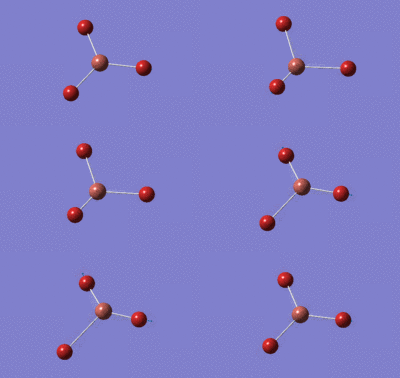
The above table gives the low frequency values recorded for the structure and the corresponding symmetry groups. The individual vibrations for each frequency were then analysed and animated in accordance with the corresponding symmetry group; this is illustrated in the table below.
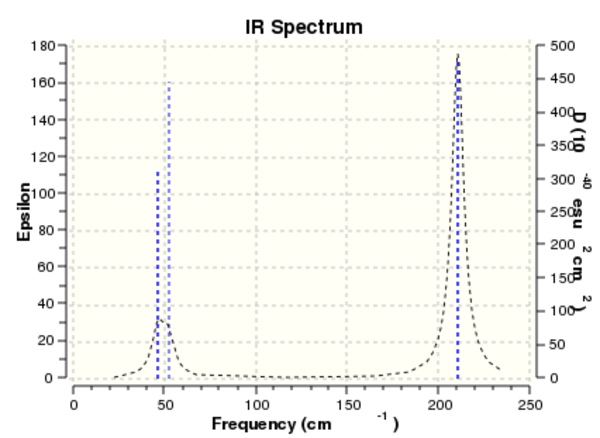
The vibrational spectrum was produced based on the above analysis:
Once again, six different vibrational forms are represented by only three peaks in the infrared spectrum; exactly the same analysis of the spectrum provides a similar explanation for this observation. The peak at 46.43 cm-1 represents two vibrational forms, as does the peak at 210.69 cm-1. In addition, the vibration at a frequency of 165.27 cm-1 has been calculated to have zero intensity and therefore cannot be seen in the spectrum. The net effect again is that only three signals are observed.
Comparing vibrational frequencies
| D3h symmetry group | BH3 freq. (cm -1) | TlBr3 freq. (cm -1) |
| A2" | 1161.40 | 52.14 |
| E' | 1212.11 | 46.43 |
| E' | 1212.11 | 46.43 |
| A1' | 2587.81 | 165.27 |
| E' | 2721.52 | 210.69 |
| E' | 2721.52 | 210.69 |
The frequency values for the various vibrational forms of borane and thallium tribromide were compared above with respect to their corresponding symmetry group. The most apparent difference is the contrasting magnitudes of the values; the borane frequencies are vastly greater than those for the thallium structure. This can be explained largely by the sizes of the atoms present in each case, along with the equation below linking frequency and reduced mass.
The equation above implies that larger, heavier atoms will lower the frequency of vibrations, consistent with the trend shown in the table above. In addition, the equation shows that a larger force constant will increase the vibrational frequency. As discussed earlier, the B-H bond length is far shorter than the Tl-Br bond length, meaning that borane will have a much higher force constant, hence much higher vibrational frequencies. The other significant difference to note between the two molecules is the reordering of the A2" and lower energy E' symmetry groups.
Despite these differences, there are key similarities to be observed. For example, the infrared spectra for the two molecules both have three signals as mentioned previously. There are also trends in the intensities of the signals, namely that for both molecules the vibration at the highest frequency gives rise to the most intense peak, and also that the intensity for the A1' vibrational mode is zero in both cases. Note that the vibrational modes appear to be split into two groups: the A2" and lower energy pair of E' modes are much lower in energy than the A1' and higher energy pair of E' modes. This is owing to the fact that stretching vibrational modes are often much higher in energy than bending vibrational modes.
In general when performing calculations like the above for the purpose of comparison, it is of paramount importance that the same method and basis-sets are used throughout. Use of various methods and basis-sets allows certain assumptions to be made (different in each case) in order to solve the Schrodinger equation for electrons and energies. Consequently, in order to allow direct comparison of results, basis-sets have to be kept consistent such that the assumptions being made for the calculation are exactly the same. Failure to maintain this consistency will result in significant variances in the results obtained.
A frequency analysis like the one above is performed in order to verify the accuracy of the optimisation of the structure and to confirm that the minimum energy structure has in fact been obtained. This type of analysis also allows identification of the individual vibrational modes and their corresponding symmetry groups, including those which may have too weak an intensity to be observed in the infrared spectra (e.g. A1' mode in the above analyses). This analysis also produces 'low frequency' data, which are not actual vibrations of the molecule but are in fact motions of its centre of mass. Consequently, these values are much smaller than any vibrational frequencies and should often be as close to zero as possible, hence being also known as 'zero frequencies'.
Analysing Molecular Orbitals
MO Analysis of BH3
Population analysis in the form of an energy calculation was performed on the optimised borane structure.
BH3 population analysis results.
File Type:    .log
Calculation Type:    SP
Calculation Method:    RB3LYP
Basis Set:    6-31G(d,p)
Charge:    0
Spin:    Singlet
E(RB3LYP):    -26.61532252     a.u.
RMS Gradient Norm:     a.u.
Imaginary Freq
Dipole Moment:    0.0000     Debye
Point Group:    D3h
Job CPU time:  0 days  0 hours  0 minutes 34.2 seconds.
The results file for the population analysis is linked to here.
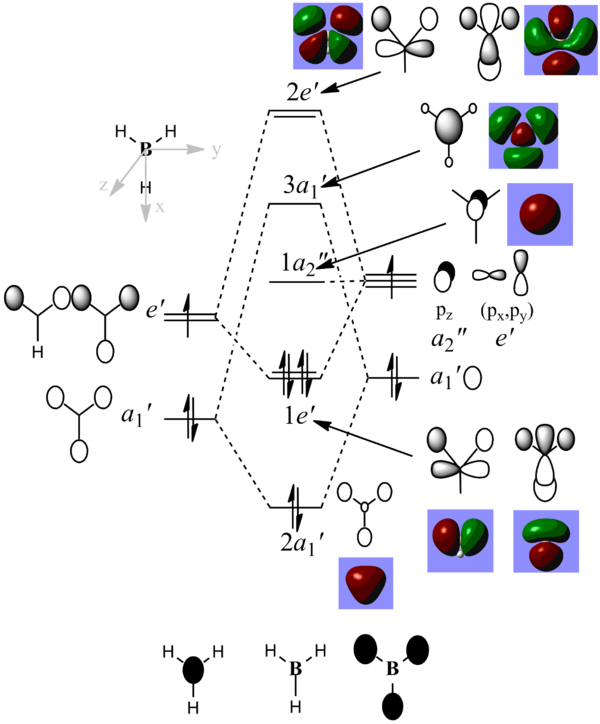
The MO diagram for the optimised borane molecule is shown below:
The MO diagram shows the accuracy of MO theory with respect to LCAO, as it does not display any significant differences between the real and LCAO MOs. From this observation, it can be concluded that qualitative MO theory is very accurate for determining molecular orbitals of simple molecules such as borane; however the extent of agreement between MO theory and LCAO is sufficient to suggest that the theory could be accurately applied to far more complex molecules in order to compute much more complicated MOs.
Natural Bond Orbital (NBO) Analysis
Analysis of NH3
In order to prepare it for NBO analysis, a molecule of ammonia was constructed and optimised before subsequently carrying out frequency and population (MO) analyses.
Optimisation
File Type:    .log
Calculation Type:    FOPT
Calculation Method:    RB3LYP
Basis Set:    6-31G(d,p)
Charge:    0
Spin:    Singlet
E(RB3LYP):    -56.55776856     a.u.
RMS Gradient Norm:    0.00000885     a.u.
Imaginary Freq
Dipole Moment:    1.8464     Debye
Point Group:    C1
Job CPU time:  0 days  0 hours  0 minutes 16.0 seconds.
The optimisation file (using the 6-31G basis set) is linked to here.
Item               Value     Threshold  Converged?
 Maximum Force            0.000024     0.000450     YES
 RMS     Force            0.000012     0.000300     YES
 Maximum Displacement     0.000079     0.001800     YES
 RMS     Displacement     0.000053     0.001200     YES
 Predicted change in Energy=-1.629727D-09
 Optimization completed.
    -- Stationary point found.
                           ----------------------------
                           !   Optimized Parameters   !
                           ! (Angstroms and Degrees)  !
 --------------------------                            --------------------------
 ! Name  Definition              Value          Derivative Info.                !
 --------------------------------------------------------------------------------
 ! R1    R(1,2)                  1.018          -DE/DX =    0.0                 !
 ! R2    R(1,3)                  1.018          -DE/DX =    0.0                 !
 ! R3    R(1,4)                  1.018          -DE/DX =    0.0                 !
 ! A1    A(2,1,3)              105.7413         -DE/DX =    0.0                 !
 ! A2    A(2,1,4)              105.7486         -DE/DX =    0.0                 !
 ! A3    A(3,1,4)              105.7479         -DE/DX =    0.0                 !
 ! D1    D(2,1,4,3)           -111.8631         -DE/DX =    0.0                 !
 --------------------------------------------------------------------------------
 GradGradGradGradGradGradGradGradGradGradGradGradGradGradGradGradGradGrad
The Jmol for this optimisation given via this
Total energy for 6-31G optimised structure = -56.55776856 a.u.
Frequency analysis
File Type:    .log
Calculation Type:    FREQ
Calculation Method:    RB3LYP
Basis Set:    6-31G(d,p)
Charge:    0
Spin:    Singlet
E(RB3LYP):    -56.55776856     a.u.
RMS Gradient Norm:    0.00000881     a.u.
Imaginary Freq:    0
Dipole Moment:    1.8464     Debye
Point Group:    C1
Job CPU time:  0 days  0 hours  2 minutes 49.0 seconds.
The results file for the frequency analysis is linked to here.
Item               Value     Threshold  Converged?
 Maximum Force            0.000021     0.000450     YES
 RMS     Force            0.000009     0.000300     YES
 Maximum Displacement     0.000077     0.001800     YES
 RMS     Displacement     0.000039     0.001200     YES
 Predicted change in Energy=-1.600242D-09
 Optimization completed.
    -- Stationary point found.
 GradGradGradGradGradGradGradGradGradGradGradGradGradGradGradGradGradGrad
Low frequencies ---  -30.6965    0.0020    0.0022    0.0022   20.2203   28.2940
 Low frequencies --- 1089.5540 1694.1243 1694.1861
 Harmonic frequencies (cm**-1), IR intensities (KM/Mole), Raman scattering
 activities (A**4/AMU), depolarization ratios for plane and unpolarized
 incident light, reduced masses (AMU), force constants (mDyne/A),
 and normal coordinates:
                     1                      2                      3
                     A                      A                      A
 Frequencies --  1089.5540              1694.1243              1694.1861
 Red. masses --     1.1800                 1.0644                 1.0644
 Frc consts  --     0.8253                 1.8000                 1.8001
 IR Inten    --   145.4404                13.5558                13.5560
  Atom  AN      X      Y      Z        X      Y      Z        X      Y      Z
     1   7     0.12   0.00   0.00     0.00  -0.02  -0.06     0.00   0.06  -0.02
     2   1    -0.53  -0.21   0.00    -0.07  -0.04   0.73     0.25   0.14   0.20
     3   1    -0.53   0.11   0.18     0.25  -0.24  -0.03    -0.07  -0.62   0.40
     4   1    -0.53   0.11  -0.18    -0.18   0.52   0.18    -0.18  -0.41  -0.36
                     4                      5                      6
                     A                      A                      A
 Frequencies --  3460.9801              3589.3986              3589.5206
 Red. masses --     1.0272                 1.0883                 1.0883
 Frc consts  --     7.2496                 8.2615                 8.2621
 IR Inten    --     1.0593                 0.2700                 0.2709
  Atom  AN      X      Y      Z        X      Y      Z        X      Y      Z
     1   7    -0.04   0.00   0.00     0.00  -0.04   0.07     0.00   0.07   0.04
     2   1     0.18  -0.55   0.00    -0.14   0.35   0.02     0.27  -0.67   0.01
     3   1     0.18   0.27   0.47    -0.17  -0.22  -0.34    -0.26  -0.31  -0.55
     4   1     0.18   0.27  -0.48     0.31   0.38  -0.65    -0.01   0.00   0.04
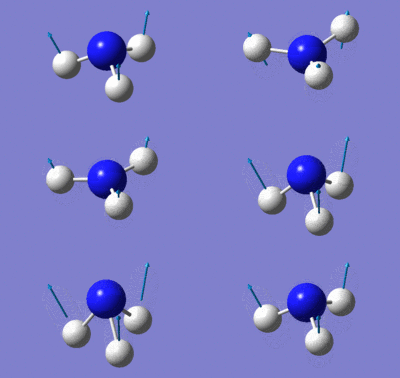
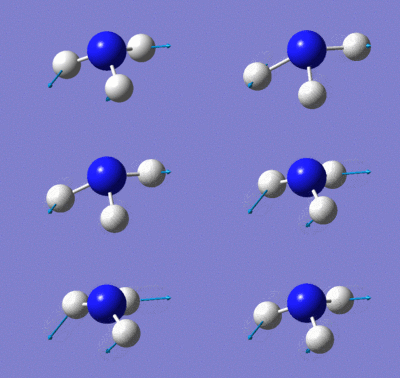
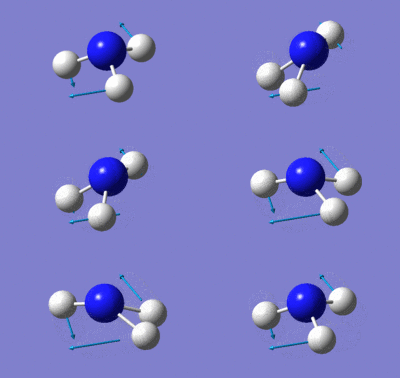
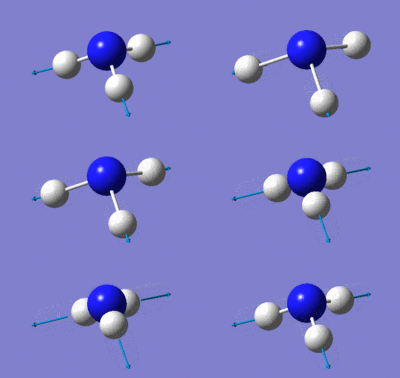
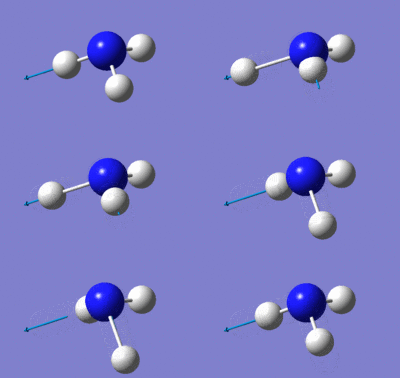
The individual vibrations within the C1 point group for each frequency were then analysed and animated; this is illustrated in the table below.
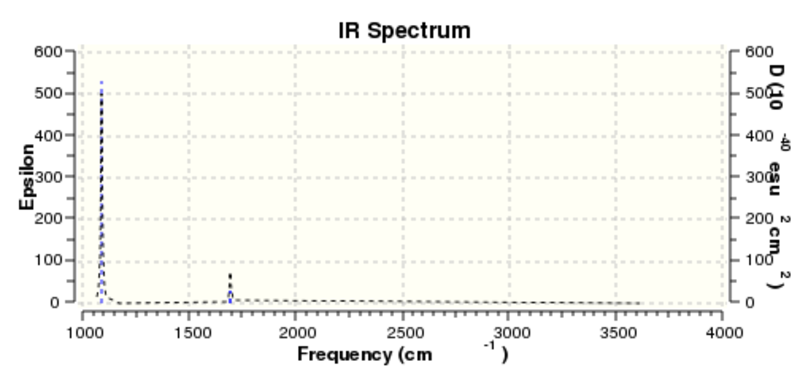
The vibrational spectrum was produced based on the above analysis:
Population analysis
NH3 population analysis results.
File Type:    .log
Calculation Type:    SP
Calculation Method:    RB3LYP
Basis Set:    6-31G(d,p)
Charge:    0
Spin:    Singlet
E(RB3LYP):    -56.55776856     a.u.
RMS Gradient Norm:     a.u.
Imaginary Freq
Dipole Moment:    1.8464     Debye
Point Group:    C1
Job CPU time:  0 days  0 hours  0 minutes 31.7 seconds.
The results file for the population analysis is linked to here.
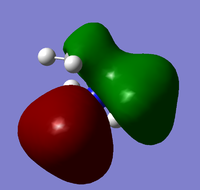
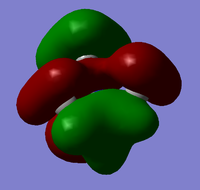
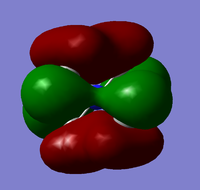
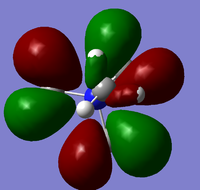
The MOs are shown in the following table:
| No. | MO |
| 1 | 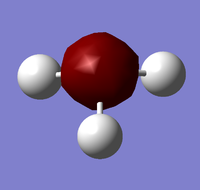
|
| 2 | 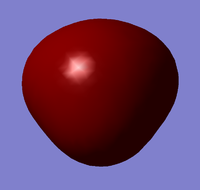
|
| 3 | 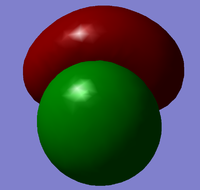
|
| 4 | 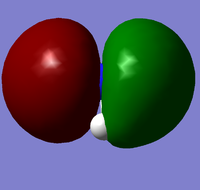
|
| 5 | 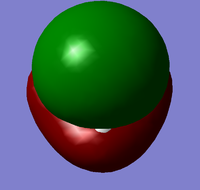
|
| 6 | 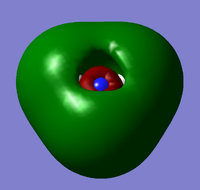
|
| 7 | 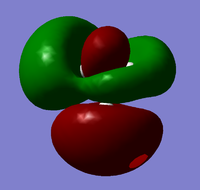
|
| 8 | 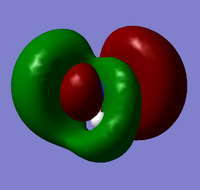
|
Natural Bond Orbital (NBO) Analysis
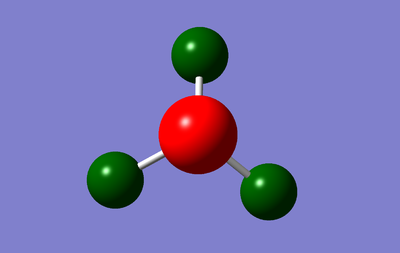
The charge distribution for the output structure of the population analysis was analysed and is shown in the image below:
The charge range in this case is -1.125 to +1.125; areas of negative charge are represented in red, whilst areas of positive charge are shown in green. The specific NBO charge for the nitrogen atom is -1.125, whilst for each of the hydrogen atoms it is +0.375; the net effect of the specific charges is that they cancel each other out as they sum to give zero, therefore the molecule is shown to be neutral as expected.
Association Energies
Analysis of NH3BH3
This section of analysis was conducted with the aim of computing the reaction enthalpy (in this case the association energy) for the reaction of ammonia and borane to form the corresponding adduct. This involved optimising the product molecule then performing frequency analysis on it; the association energy was then calculated by taking the difference between the total energies of the product and the reactants.
Optimisation
File Type:    .log
Calculation Type:    FOPT
Calculation Method:    RB3LYP
Basis Set:    6-31G(d,p)
Charge:    0
Spin:    Singlet
E(RB3LYP):    -83.22469032     a.u.
RMS Gradient Norm:    0.00005935     a.u.
Imaginary Freq
Dipole Moment:    5.5648     Debye
Point Group:    C1
Job CPU time:  0 days  0 hours  8 minutes 59.0 seconds.
The optimisation file (using the 6-31G basis set) is linked to here.
Item               Value     Threshold  Converged?
 Maximum Force            0.000121     0.000450     YES
 RMS     Force            0.000057     0.000300     YES
 Maximum Displacement     0.000508     0.001800     YES
 RMS     Displacement     0.000294     0.001200     YES
 Predicted change in Energy=-1.611643D-07
 Optimization completed.
    -- Stationary point found.
                           ----------------------------
                           !   Optimized Parameters   !
                           ! (Angstroms and Degrees)  !
 --------------------------                            --------------------------
 ! Name  Definition              Value          Derivative Info.                !
 --------------------------------------------------------------------------------
 ! R1    R(1,7)                  1.0186         -DE/DX =   -0.0001              !
 ! R2    R(2,7)                  1.0186         -DE/DX =   -0.0001              !
 ! R3    R(3,7)                  1.0186         -DE/DX =   -0.0001              !
 ! R4    R(4,8)                  1.21           -DE/DX =   -0.0001              !
 ! R5    R(5,8)                  1.21           -DE/DX =   -0.0001              !
 ! R6    R(6,8)                  1.21           -DE/DX =   -0.0001              !
 ! R7    R(7,8)                  1.6681         -DE/DX =   -0.0001              !
 ! A1    A(1,7,2)              107.873          -DE/DX =    0.0                 !
 ! A2    A(1,7,3)              107.873          -DE/DX =    0.0                 !
 ! A3    A(1,7,8)              111.0212         -DE/DX =    0.0                 !
 ! A4    A(2,7,3)              107.8692         -DE/DX =    0.0                 !
 ! A5    A(2,7,8)              111.0298         -DE/DX =    0.0                 !
 ! A6    A(3,7,8)              111.0297         -DE/DX =    0.0                 !
 ! A7    A(4,8,5)              113.8796         -DE/DX =    0.0                 !
 ! A8    A(4,8,6)              113.8796         -DE/DX =    0.0                 !
 ! A9    A(4,8,7)              104.5972         -DE/DX =    0.0                 !
 ! A10   A(5,8,6)              113.8728         -DE/DX =    0.0                 !
 ! A11   A(5,8,7)              104.591          -DE/DX =    0.0                 !
 ! A12   A(6,8,7)              104.591          -DE/DX =    0.0                 !
 ! D1    D(1,7,8,4)            179.9998         -DE/DX =    0.0                 !
 ! D2    D(1,7,8,5)            -59.9967         -DE/DX =    0.0                 !
 ! D3    D(1,7,8,6)             59.9963         -DE/DX =    0.0                 !
 ! D4    D(2,7,8,4)            -60.0005         -DE/DX =    0.0                 !
 ! D5    D(2,7,8,5)             60.003          -DE/DX =    0.0                 !
 ! D6    D(2,7,8,6)            179.996          -DE/DX =    0.0                 !
 ! D7    D(3,7,8,4)             60.0001         -DE/DX =    0.0                 !
 ! D8    D(3,7,8,5)           -179.9964         -DE/DX =    0.0                 !
 ! D9    D(3,7,8,6)            -60.0034         -DE/DX =    0.0                 !
 --------------------------------------------------------------------------------
 GradGradGradGradGradGradGradGradGradGradGradGradGradGradGradGradGradGrad
The Jmol for this optimisation given via this
Total energy for 6-31G optimised structure = -83.22469032 a.u.
Frequency analysis
File Type    .log
Calculation Type    FREQ
Calculation Method    RB3LYP
Basis Set    6-31G(d,p)
Charge    0
Spin    Singlet
E(RB3LYP)    -83.22469032     a.u.
RMS Gradient Norm    0.00005942     a.u.
Imaginary Freq    0
Dipole Moment    5.5648     Debye
Point Group    C1
Job cpu time:  0 days  0 hours  2 minutes 49.0 seconds.
The results file for the frequency analysis is linked to here.
Item               Value     Threshold  Converged?
 Maximum Force            0.000113     0.000450     YES
 RMS     Force            0.000059     0.000300     YES
 Maximum Displacement     0.000584     0.001800     YES
 RMS     Displacement     0.000343     0.001200     YES
 Predicted change in Energy=-1.715239D-07
 Optimization completed.
    -- Stationary point found.
 GradGradGradGradGradGradGradGradGradGradGradGradGradGradGradGradGradGrad
Low frequencies ---   -0.0007    0.0001    0.0005   18.5329   23.7785   41.0366
 Low frequencies ---  266.2888  632.2326  639.8278
 Harmonic frequencies (cm**-1), IR intensities (KM/Mole), Raman scattering
 activities (A**4/AMU), depolarization ratios for plane and unpolarized
 incident light, reduced masses (AMU), force constants (mDyne/A),
 and normal coordinates:
                     1                      2                      3
                     A                      A                      A
 Frequencies --   266.2801               632.2325               639.8278
 Red. masses --     1.0078                 4.9939                 1.0453
 Frc consts  --     0.0421                 1.1761                 0.2521
 IR Inten    --     0.0000                14.0030                 3.5517
  Atom  AN      X      Y      Z        X      Y      Z        X      Y      Z
     1   1     0.00   0.00  -0.45     0.37   0.01   0.00     0.58   0.17   0.00
     2   1     0.00  -0.39   0.22     0.35   0.00   0.00    -0.30   0.20  -0.02
     3   1     0.00   0.39   0.22     0.35   0.00   0.00    -0.29   0.20   0.02
     4   1     0.00   0.00  -0.36    -0.28   0.03   0.00     0.46   0.11   0.00
     5   1     0.00   0.32   0.18    -0.29  -0.01   0.03    -0.23   0.14   0.02
     6   1     0.00  -0.32   0.18    -0.29  -0.01  -0.03    -0.23   0.14  -0.02
     7   7     0.00   0.00   0.00     0.36   0.00   0.00     0.00  -0.05   0.00
     8   5     0.00   0.00   0.00    -0.48   0.00   0.00     0.00  -0.03   0.00
                     4                      5                      6
                     A                      A                      A
 Frequencies --   639.9398              1069.2381              1069.5996
 Red. masses --     1.0452                 1.3349                 1.3342
 Frc consts  --     0.2522                 0.8992                 0.8993
 IR Inten    --     3.5401                40.5830                40.4671
  Atom  AN      X      Y      Z        X      Y      Z        X      Y      Z
     1   1     0.00   0.00   0.21     0.00   0.00   0.13    -0.45  -0.07   0.00
     2   1    -0.51  -0.02   0.18    -0.39  -0.03   0.08     0.22  -0.11   0.03
     3   1     0.51   0.01   0.18     0.39   0.03   0.08     0.22  -0.11  -0.03
     4   1     0.00   0.00   0.16     0.00   0.00  -0.17     0.63   0.04   0.00
     5   1     0.40   0.02   0.12    -0.54  -0.06  -0.07    -0.31   0.14   0.06
     6   1    -0.40  -0.02   0.12     0.54   0.06  -0.07    -0.31   0.14  -0.06
     7   7     0.00   0.00  -0.05     0.00   0.00  -0.11     0.00   0.11   0.00
     8   5     0.00   0.00  -0.03     0.00   0.00   0.14     0.00  -0.14   0.00
                     7                      8                      9
                     A                      A                      A
 Frequencies --  1196.7206              1203.7157              1203.7263
 Red. masses --     1.1450                 1.0607                 1.0613
 Frc consts  --     0.9662                 0.9055                 0.9060
 IR Inten    --   108.6658                 3.4543                 3.8521
  Atom  AN      X      Y      Z        X      Y      Z        X      Y      Z
     1   1    -0.02   0.00   0.00     0.00   0.00  -0.02     0.02   0.00   0.00
     2   1    -0.02   0.00   0.00    -0.02   0.01   0.00    -0.01  -0.01   0.01
     3   1    -0.02   0.00   0.00     0.02  -0.01   0.00    -0.01  -0.01  -0.01
     4   1     0.53   0.17   0.00     0.01   0.00   0.75    -0.31  -0.14   0.02
     5   1     0.55  -0.06   0.17    -0.25   0.37   0.08     0.11   0.54   0.38
     6   1     0.55  -0.06  -0.17     0.24  -0.40   0.10     0.12   0.53  -0.37
     7   7    -0.02   0.00   0.00     0.00   0.00  -0.01     0.00  -0.01   0.00
     8   5    -0.11   0.00   0.00     0.00   0.00  -0.07     0.01  -0.07   0.00
                    10                     11                     12
                     A                      A                      A
 Frequencies --  1329.7768              1676.4601              1676.5833
 Red. masses --     1.1793                 1.0556                 1.0555
 Frc consts  --     1.2286                 1.7480                 1.7480
 IR Inten    --   113.6811                27.5776                27.5167
  Atom  AN      X      Y      Z        X      Y      Z        X      Y      Z
     1   1     0.53   0.21   0.00    -0.29  -0.15   0.00     0.00   0.00   0.75
     2   1     0.53  -0.11  -0.18     0.14   0.53  -0.39     0.25  -0.39   0.07
     3   1     0.53  -0.11   0.18     0.14   0.52   0.39    -0.25   0.39   0.08
     4   1     0.00   0.00   0.00     0.01   0.00   0.00     0.00   0.00   0.02
     5   1     0.00   0.00   0.00    -0.01   0.01   0.01     0.01   0.01   0.00
     6   1     0.00   0.00   0.00    -0.01   0.01  -0.01    -0.01  -0.01   0.00
     7   7    -0.11   0.00   0.00     0.00  -0.06   0.00     0.00   0.00  -0.06
     8   5     0.00   0.00   0.00     0.00  -0.01   0.00     0.00   0.00  -0.01
                    13                     14                     15
                     A                      A                      A
 Frequencies --  2470.4079              2530.4291              2530.4589
 Red. masses --     1.0218                 1.1176                 1.1176
 Frc consts  --     3.6742                 4.2164                 4.2163
 IR Inten    --    67.2330               231.3705               231.2847
  Atom  AN      X      Y      Z        X      Y      Z        X      Y      Z
     1   1     0.01   0.00   0.00     0.00   0.00   0.00    -0.01  -0.01   0.00
     2   1     0.01   0.00   0.00     0.00   0.00  -0.01     0.00  -0.01   0.00
     3   1     0.01   0.00   0.00     0.00   0.00  -0.01     0.00   0.00   0.00
     4   1    -0.15   0.56   0.00     0.01  -0.05  -0.01    -0.21   0.78   0.00
     5   1    -0.15  -0.28   0.48    -0.19  -0.36   0.60     0.10   0.16  -0.31
     6   1    -0.15  -0.28  -0.48     0.18   0.33   0.56     0.12   0.20   0.38
     7   7     0.00   0.00   0.00     0.00   0.00   0.00     0.00   0.00   0.00
     8   5     0.04   0.00   0.00     0.00   0.01  -0.10     0.00  -0.10  -0.01
                    16                     17                     18
                     A                      A                      A
 Frequencies --  3462.6256              3579.4842              3579.5801
 Red. masses --     1.0270                 1.0921                 1.0921
 Frc consts  --     7.2549                 8.2442                 8.2446
 IR Inten    --     2.5124                27.9228                27.9419
  Atom  AN      X      Y      Z        X      Y      Z        X      Y      Z
     1   1    -0.18   0.55   0.00     0.01  -0.02  -0.02    -0.28   0.76   0.00
     2   1    -0.18  -0.27  -0.47     0.24   0.33   0.56     0.15   0.19   0.35
     3   1    -0.18  -0.27   0.48    -0.25  -0.34   0.58     0.14   0.17  -0.32
     4   1     0.00   0.00   0.00     0.00   0.00   0.00     0.00   0.01   0.00
     5   1     0.00   0.00   0.00     0.00   0.00   0.01     0.00   0.00   0.00
     6   1     0.00   0.00   0.00     0.00   0.00   0.01     0.00   0.00   0.00
     7   7     0.04   0.00   0.00     0.00   0.00  -0.08     0.00  -0.08   0.00
     8   5     0.00   0.00   0.00     0.00   0.00   0.00     0.00   0.00   0.00
Calculation of association energy
Having now completed calculations for the product and the two reactants, the total energies were used to calculate the association energy for this process:
E(NH3) = -56.55776856 a.u.
E(BH3) = -26.61532252 a.u.
E(NH3BH3) = -83.22469032 a.u.
Therefore:
ΔE = E(NH3BH3) - [E(NH3) + E(BH3)]
ΔE = -83.22469032 - (-56.55776856 + (-26.61532252))
ΔE = -0.05159924 a.u.
ΔE = -135.47381494 kJ mol-1
Thus the association energy was calculated to be -135.47381494 kJ mol-1; it is worth noting that by inspection, inverting the sign of this value gives the dissociation energy (i.e. +135.47381494 kJ mol-1), which is also the bond enthalpy for the boron-nitrogen single bond. This value appears to be reasonable upon comparison with bond enthalpies involving elements of a similar nature; it is also of the correct magnitude that would be expected for a bond enthalpy value, indicating that the computational work conducted provides a fairly accurate model for the calculation of these energies.
Mini Project - Ionic Liquids: Designer Solvents
The remainder of this article details a small project that was carried out to investigate ionic liquids. These materials are either liquids at room temperature or solids with a low melting point that consist only of ions; these ions are normally asymmetric organic species, large in steric bulk with significant delocalisation of charge. The following work initially studies three selected alkyl 'onium' cations: ammonium ([NR4]+), phosphonium ([PR4]+) and sulphonium ([SR3]+). Subsequent analysis then focuses on the ammonium species, investigating any potential effects that the ligands may have on the structure by varying the functional groups present in the molecule.
Part 1 - Comparison of 'onium' cations
Tetramethylammonium ([N(CH3)4]+)
Optimisation
Optimised [N(CH3)4]+ results.
File Type:    .log
Calculation Type:    FOPT
Calculation Method:    RB3LYP
Basis Set:    6-31G(d,p)
Charge:    +1
Spin:    Singlet
E(RB3LYP):    -214.18127263     a.u.
RMS Gradient Norm:    0.00002102     a.u.
Imaginary Freq
Dipole Moment:    4.3295     Debye
Point Group:    C1
Job CPU time:  0 days  0 hours  5 minutes 56.0 seconds.
The optimisation file (using the 6-31G basis set) is linked to here.
Item               Value     Threshold  Converged?
 Maximum Force            0.000074     0.000450     YES
 RMS     Force            0.000017     0.000300     YES
 Maximum Displacement     0.000668     0.001800     YES
 RMS     Displacement     0.000227     0.001200     YES
 Predicted change in Energy=-4.880836D-08
 Optimization completed.
    -- Stationary point found.
The Jmol for this optimisation given via this
Total energy for 6-31G optimised structure = -214.18127263 a.u.
Frequency analysis
[N(CH3)4]+ frequency analysis results.
File Type:    .log
Calculation Type:    FREQ
Calculation Method:    RB3LYP
Basis Set:    6-31G(d,p)
Charge:    +1
Spin:    Singlet
E(RB3LYP):    -214.18127263     a.u.
RMS Gradient Norm:    0.00002099     a.u.
Imaginary Freq:    0
Dipole Moment:    4.3295     Debye
Point Group:    C1
Job CPU time:  0 days  0 hours 10 minutes  7.1 seconds.
The results file for the frequency analysis is linked to here.
Item               Value     Threshold  Converged?
 Maximum Force            0.000073     0.000450     YES
 RMS     Force            0.000021     0.000300     YES
 Maximum Displacement     0.000326     0.001800     YES
 RMS     Displacement     0.000164     0.001200     YES
 Predicted change in Energy=-4.637161D-08
 Optimization completed.
    -- Stationary point found.
 Low frequencies ---  -13.0393   -0.0006   -0.0005    0.0003    6.1448   11.9526
 Low frequencies ---  179.8930  278.8631  285.7096
Population analysis
[N(CH3)4]+ population analysis results.
File Type:    .log
Calculation Type:    SP
Calculation Method:    RB3LYP
Basis Set:    6-31G(d,p)
Charge:    +1
Spin:    Singlet
E(RB3LYP):    -214.18127057     a.u.
RMS Gradient Norm:     a.u.
Imaginary Freq
Dipole Moment:    0.0003     Debye
Point Group:    C1
Job CPU time:  0 days  0 hours  1 minutes 29.6 seconds.
The results file for the population analysis is linked to here.
The table below shows a selection of five of the non-core MOs, comprising a variation of highly bonding and anti-bonding orbitals and the interactions present:
NBO analysis
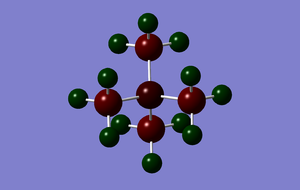
The charge distribution was analysed and is shown in the image below:
The charge range here is -1.625 to +1.625; areas of negative charge are represented in dark red, whilst areas of positive charge are shown in dark green. The specific NBO charge for the central nitrogen atom is -0.295; each of the carbon atoms on the methyl groups have a specific charge of -0.483, whilst the positive charge is distributed amongst the hydrogen atoms with each atom having a specific charge of +0.269. The net effect of the specific charges sum to give 1, therefore the molecule is shown to have a +1 charge as expected.
Tetramethylphosphonium ([P(CH3)4]+)
Optimisation
Optimised [P(CH3)4]+ results.
File Type:    .log
Calculation Type:    FOPT
Calculation Method:    RB3LYP
Basis Set:    6-31G(d,p)
Charge:    +1
Spin:    Singlet
E(RB3LYP):    -500.82700304     a.u.
RMS Gradient Norm:    0.00002566     a.u.
Imaginary Freq
Dipole Moment:    4.3332     Debye
Point Group:    C1
Job CPU time:  0 days  0 hours  9 minutes 26.4 seconds.
The optimisation file (using the 6-31G basis set) is linked to here.
Item               Value     Threshold  Converged?
 Maximum Force            0.000148     0.000450     YES
 RMS     Force            0.000033     0.000300     YES
 Maximum Displacement     0.000903     0.001800     YES
 RMS     Displacement     0.000308     0.001200     YES
 Predicted change in Energy=-1.808434D-07
 Optimization completed.
    -- Stationary point found.
The Jmol for this optimisation given via this
Total energy for 6-31G optimised structure = -500.82700304 a.u.
Frequency analysis
[P(CH3)4]+ frequency analysis results.
File Type:    .log
Calculation Type:    FREQ
Calculation Method:    RB3LYP
Basis Set:    6-31G(d,p)
Charge:    +1
Spin:    Singlet
E(RB3LYP):    -500.82700304     a.u.
RMS Gradient Norm:    0.00002565     a.u.
Imaginary Freq:    0
Dipole Moment:    4.3332     Debye
Point Group:    C1
Job CPU time:  0 days  0 hours  9 minutes 50.5 seconds.
The results file for the frequency analysis is linked to here.
Low frequencies ---  -16.5688   -0.0019    0.0016    0.0017    4.6096   16.2063
 Low frequencies ---  153.3396  183.0597  190.9777
Population analysis
[P(CH3)4]+ population analysis results.
File Type:    .log
Calculation Type:    SP
Calculation Method:    RB3LYP
Basis Set:    6-31G(d,p)
Charge:    +1
Spin:    Singlet
E(RB3LYP):    -500.82699370     a.u.
RMS Gradient Norm:     a.u.
Imaginary Freq
Dipole Moment:    0.0014     Debye
Point Group:    C1
Job CPU time:  0 days  0 hours  1 minutes 31.3 seconds.
The results file for the population analysis is linked to here.
NBO analysis
The charge distribution was analysed and is shown in the image below:
The charge range applied is -1.625 to +1.625; areas of negative charge are represented in dark red, whilst areas of positive charge are shown in dark green. The specific NBO charge for the central phosphorus atom is +1.667; each of the carbon atoms on the methyl groups have a specific charge of -1.060, whilst the positive charge is distributed amongst the hydrogen atoms with each atom having a specific charge of +0.298. The net effect of the specific charges sum to give 1, therefore the molecule is shown to have a +1 charge as expected.
Trimethylsulphonium ([S(CH3)3]+)
Optimisation
Optimised [S(CH3)3]+ results.
File Type:    .log
Calculation Type:    FOPT
Calculation Method:    RB3LYP
Basis Set:    6-31G(d,p)
Charge:    +1
Spin:    Singlet
E(RB3LYP):    -517.68327891     a.u.
RMS Gradient Norm:    0.00000857     a.u.
Imaginary Freq
Dipole Moment:    3.7066     Debye
Point Group:    C1
Job CPU time:  0 days  0 hours  4 minutes 32.3 seconds.
The optimisation file (using the 6-31G basis set) is linked to here.
Item               Value     Threshold  Converged?
 Maximum Force            0.000015     0.000450     YES
 RMS     Force            0.000007     0.000300     YES
 Maximum Displacement     0.000487     0.001800     YES
 RMS     Displacement     0.000178     0.001200     YES
 Predicted change in Energy=-9.047815D-09
 Optimization completed.
    -- Stationary point found.
The Jmol for this optimisation given via this
Total energy for 6-31G optimised structure = -517.68327891 a.u.
Frequency analysis
[S(CH3)3]+ frequency analysis results.
File Type:    .log
Calculation Type:    FREQ
Calculation Method:    RB3LYP
Basis Set:    6-31G(d,p)
Charge:    +1
Spin:    Singlet
E(RB3LYP):    -517.68327891     a.u.
RMS Gradient Norm:    0.00000857     a.u.
Imaginary Freq:    0
Dipole Moment:    3.7066     Debye
Point Group:    C1
Job CPU time:  0 days  0 hours  4 minutes 42.4 seconds.
The results file for the frequency analysis is linked to here.
Item               Value     Threshold  Converged?
 Maximum Force            0.000028     0.000450     YES
 RMS     Force            0.000009     0.000300     YES
 Maximum Displacement     0.000550     0.001800     YES
 RMS     Displacement     0.000207     0.001200     YES
 Predicted change in Energy=-1.029453D-08
 Optimization completed.
    -- Stationary point found.
Low frequencies ---  -13.6375  -11.0447   -0.0033   -0.0029    0.0014   22.4854
 Low frequencies ---  158.4046  194.3202  198.3244
Population analysis
[S(CH3)3]+ population analysis results.
File Type:    .log
Calculation Type:    SP
Calculation Method:    RB3LYP
Basis Set:    6-31G(d,p)
Charge:    +1
Spin:    Singlet
E(RB3LYP):    -517.68327720     a.u.
RMS Gradient Norm:     a.u.
Imaginary Freq
Dipole Moment:    0.9649     Debye
Point Group:    C1
Job CPU time:  0 days  0 hours  0 minutes 60.0 seconds.
The results file for the population analysis is linked to here.
NBO analysis
The charge distribution was analysed and is shown in the image below:
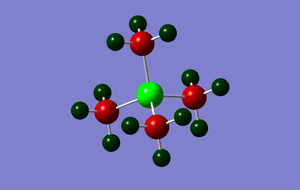
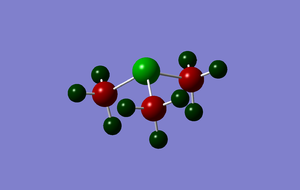
The charge range here is -1.625 to +1.625; areas of negative charge are represented in dark red, whilst areas of positive charge are shown in dark green. The specific NBO charge for the central sulphur atom is +0.917; each of the carbon atoms on the methyl groups have a specific charge of -0.846, whilst the positive charge is distributed amongst the hydrogen atoms with the atoms in each methyl group averaging a specific charge of +0.291 (2 x +0.297 and 1 x +0.279). The net effect of the specific charges sum to give 1, therefore the molecule is shown to have a +1 charge as expected.
Structural Comparison
Overall structure, C-X bond lengths and C-X-C bond angles
| Cation | C-X Bond length (Å) | C-X-C Bond angle (o) |
| [N(CH3)4]+ | 1.510 | 109.5 |
| [P(CH3)4]+ | 1.817 | 109.5 |
| [S(CH3)3]+ | 1.823 | 102.7 |
The bond angles confirm the expected tetrahedral structures of the ammonium and phosphonium cations, with a bond angle of 109.5o; however the reduced bond angle of 102.7o for the sulphonium cation suggests a trigonal pyramidal structure based on a tetrahedral pseudostructure. The reduced bond angle is a result of the fact that lone electron pair repulsion is greater than bonding electron pair repulsion, and the lone electron pair on the sulphur atom is in an apical (axial) position producing repulsion towards the three methyl groups. The bond lengths also follow the expected trend based on the size of the central heteroatom. The atoms are ordered from smallest to largest as follows: (N << P < S); the larger atomic radius results in more diffuse atomic orbitals, reducing the strength of the overlap between orbitals during bonding, hence giving rise to weaker and thus longer bonds. Consequently, we see exactly the same ordering of the heteroatoms with respect to C-X bond length (i.e. N << P < S).
NBO charge distribution
| [N(CH3)4]+ | [P(CH3)4]+ | [S(CH3)3]+ |
 |
 |
|
| NBO specific charge (range = -1.625 to +1.625) | |||
|---|---|---|---|
| Cation | Central heteroatom (X) | Methyl carbons (C) | Methyl hydrogens (H) |
| [N(CH3)4]+ | -0.295 | -0.483 | +0.269 |
| [P(CH3)4]+ | +1.667 | -1.060 | +0.298 |
| [S(CH3)3]+ | +0.917 | -0.846 | +0.291§ |
(§ - averaged across the hydrogens per methyl group (2 x +0.297 and 1 x +0.279))
The above data shows how the specific charges of the atoms varies between the different cations. The difference in the specific charges of the central heteroatoms is best explained by their differences in electronegativities. Nitrogen is fairly electronegative and therefore has a negative specific charge, whilst phosphorus and sulphur are more electropositive than nitrogen and thus have positive specific charges. The specific charges of the hydrogens remains positive and relatively constant across the three structures as expected. For the carbon atoms, the specific charge remains negative across all three structures however the magnitude varies considerably. The negative charge is a result of being bonded to three highly electropositive hydrogen atoms. The varying magnitude is again related to the electronegativity of the heteroatom to which the carbon is bonded; this is further highlighted and discussed below in the NBO population analysis when considering the contributions towards the C-X bond.
NBO population analysis - contributions to the C-X bond
| % contribution to C-X bonding orbitals | |||
|---|---|---|---|
| Cation | Central heteroatom (X) | Methyl carbon (C) | |
| [N(CH3)4]+ | 66.35 | 33.65 | |
| [P(CH3)4]+ | 40.43 | 59.57 | |
| [S(CH3)3]+ | 48.67 | 51.33 | |
As previously mentioned, the contributions of the individual atoms towards the C-X bond is largely related to the electronegativity of the heteroatom. The contribution (largest to smallest) from the heteroatom follows the order of most electronegative to least electronegative (i.e. N >> S > P). This is due to the fact that the more electronegative the atom, the greater the charge density surrounding it and therefore the bond is more polarised towards the electronegative atom (i.e. the greater the contribution from this atom).
[NR4]+ - 'formal' positive charge?
The structure of the alkyl ammonium cation often has a formal positive charge assigned to the nitrogen atom. However this is done based on the fact that the carbon and hydrogen atoms are uncharged and that the nitrogen atom forms four single bonds and therefore adopts a positive charge; in other words, the bonding present is assumed to be purely covalent with no ionic character. Despite these assumptions, the NBO analysis shows a charge distribution which suggests that the nitrogen and carbon atoms hold negative charges and the hydrogen atoms hold positive charges. As previously stated, this is due to the electronegativity of the central nitrogen atom, resulting in polarised bonds which are not purely covalent in character, rendering the above assumptions incorrect and inaccurate.
Part 2 - Influence of Functional Groups
The alkylammonium cation was then isolated and two different functional groups of contrasting electronic nature were introduced one-by-one to investigate any influence they might have on the electronics of the cationic species.
Hydroxymethyltrimethylammonium ([N(CH3)3(CH2OH)]+)
Optimisation
Optimised [N(CH3)3(CH2OH)]+ results.
File Type:    .log
Calculation Type:    FOPT
Calculation Method:    RB3LYP
Basis Set:    6-31G(d,p)
Charge:    +1
Spin:    Singlet
E(RB3LYP):    -289.39320768     a.u.
RMS Gradient Norm:    0.00000431     a.u.
Imaginary Freq
Dipole Moment:    4.8494     Debye
Point Group:    C1
Job CPU time:  0 days  0 hours 15 minutes  5.2 seconds.
The optimisation file (using the 6-31G basis set) is linked to here.
         Item               Value     Threshold  Converged?
 Maximum Force            0.000008     0.000450     YES
 RMS     Force            0.000002     0.000300     YES
 Maximum Displacement     0.000366     0.001800     YES
 RMS     Displacement     0.000067     0.001200     YES
 Predicted change in Energy=-2.921196D-09
 Optimization completed.
    -- Stationary point found.
The Jmol for this optimisation given via this
Total energy for 6-31G optimised structure = -289.39320768 a.u.
Frequency analysis
[N(CH3)3(CH2OH)]+ frequency analysis results.
File Type:    .log
Calculation Type:    FREQ
Calculation Method:    RB3LYP
Basis Set:    6-31G(d,p)
Charge:    +1
Spin:    Singlet
E(RB3LYP):    -289.39320768     a.u.
RMS Gradient Norm:    0.00000427     a.u.
Imaginary Freq:    1
Dipole Moment:    4.8494     Debye
Point Group:    C1
Job CPU time:  0 days  0 hours 13 minutes  1.6 seconds.
The results file for the frequency analysis is linked to here.
Low frequencies --- -125.7590  -18.8629   -7.6235   -0.0009   -0.0006    0.0004
 Low frequencies ---    6.9405  124.5028  210.3745
Population analysis
[N(CH3)3(CH2OH)]+ population analysis results.
File Type:    .log
Calculation Type:    SP
Calculation Method:    RB3LYP
Basis Set:    6-31G(d,p)
Charge:    +1
Spin:    Singlet
E(RB3LYP):    -289.39320190     a.u.
RMS Gradient Norm:     a.u.
Imaginary Freq
Dipole Moment:    1.5788     Debye
Point Group:    C1
Job CPU time:  0 days  0 hours  2 minutes 13.7 seconds.
The results file for the population analysis is linked to here.
NBO analysis
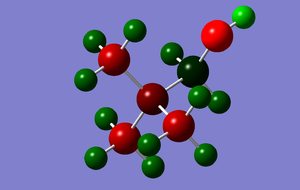
The charge distribution was analysed and is shown in the image below:
The charge range here is -0.750 to +0.750; areas of negative charge are represented in red, whilst areas of positive charge are shown in green (the brighter the colour, the greater the magnitude of charge). The specific NBO charge for the central nitrogen atom is -0.313; each of the carbon atoms on the methyl groups have a specific charge of -0.488, with the exception of the hydroxymethyl carbon which has a specific charge of -0.094. A significant proportion of the negative charge is also contributed by the oxygen atom with a specific charge of -0.707. The positive charge is distributed amongst the hydrogen atoms with each atom having a specific charge of +0.264 to +0.285, with the exception of the hydroxymethyl hydrogens; the alkyl hydrogens here have a specific charge of +0.234, whilst the hydroxyl proton has a specific charge of +0.532. The net effect of the specific charges sum to give 1, therefore the molecule is shown to have a +1 charge as expected.
Cyanomethyltrimethylammonium ([N(CH3)3(CH2CN)]+)
Optimisation
Optimised [N(CH3)3(CH2CN)]+ results.
File Type:    .log
Calculation Type:    FOPT
Calculation Method:    RB3LYP
Basis Set:    6-31G(d,p)
Charge:    +1
Spin:    Singlet
E(RB3LYP):    -306.39376701     a.u.
RMS Gradient Norm:    0.00000648     a.u.
Imaginary Freq
Dipole Moment:    5.2025     Debye
Point Group:    C1
Job CPU time:  0 days  0 hours 16 minutes 35.8 seconds.
The optimisation file (using the 6-31G basis set) is linked to here.
Item               Value     Threshold  Converged?
 Maximum Force            0.000022     0.000450     YES
 RMS     Force            0.000006     0.000300     YES
 Maximum Displacement     0.000936     0.001800     YES
 RMS     Displacement     0.000256     0.001200     YES
 Predicted change in Energy=-1.207781D-08
 Optimization completed.
    -- Stationary point found.
The Jmol for this optimisation given via this
Total energy for 6-31G optimised structure = -306.39376701 a.u.
Frequency analysis
[N(CH3)3(CH2CN)]+ frequency analysis results.
File Type:    .log
Calculation Type:    FREQ
Calculation Method:    RB3LYP
Basis Set:    6-31G(d,p)
Charge:    +1
Spin:    Singlet
E(RB3LYP):    -306.39376701     a.u.
RMS Gradient Norm:    0.00000644     a.u.
Imaginary Freq:    0
Dipole Moment:    5.2025     Debye
Point Group:    C1
Job CPU time:  0 days  0 hours 15 minutes  9.7 seconds.
The results file for the frequency analysis is linked to here.
Low frequencies ---   -4.3445    0.0001    0.0004    0.0011    6.1644   14.0739
 Low frequencies ---   91.0843  153.7812  210.7567
Population analysis
[N(CH3)3(CH2CN)]+ population analysis results.
File Type:    .log
Calculation Type:    SP
Calculation Method:    RB3LYP
Basis Set:    6-31G(d,p)
Charge:    +1
Spin:    Singlet
E(RB3LYP):    -306.39377003     a.u.
RMS Gradient Norm:     a.u.
Imaginary Freq
Dipole Moment:    5.7640     Debye
Point Group:    C1
Job CPU time:  0 days  0 hours  2 minutes 17.3 seconds.
The results file for the population analysis is linked to here.
NBO analysis
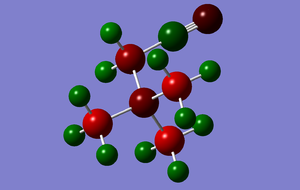
The charge distribution was analysed and is shown in the image below:
The charge range here is -0.750 to +0.750; areas of negative charge are represented in red, whilst areas of positive charge are shown in green (the brighter the colour, the greater the magnitude of charge). The specific NBO charge for the central nitrogen atom is -0.289; each of the carbon atoms on the methyl groups have a specific charge of -0.485 to -0.489, with the exception of the cyanomethyl carbon which has a specific charge of -0.358. The nitrile nitrogen atom also contributes negative charge with a specific value of -0.186. The positive charge is distributed mainly amongst the hydrogen atoms with each atom having a specific charge of +0.269 to +0.282; a small remaining part of the positive charge is held by the nitrile carbon which has a specific charge of +0.209. The net effect of the specific charges sum to give 1, therefore the molecule is shown to have a +1 charge as expected.
Structural comparison
Effect of functional groups on NBO charge distribution
| NBO specific charge values | |||||||
|---|---|---|---|---|---|---|---|
| Cation | Central heteroatom (N) | Methyl carbons (-CH3) | Functionalised carbon (-CH2-) | Nitrile carbon (-CN) | Nitrogen (-CN) | Oxygen (-OH) | Hydroxyl proton (-OH) |
| [N(CH3)4]+ | -0.295 | -0.483 | - | - | - | - | - |
| [N(CH3)3(CH2OH)]+ | -0.313 | -0.488 | -0.094 | - | - | -0.707 | +0.532 |
| [N(CH3)3(CH2CN)]+ | -0.289 | -0.485 to -0.489 | -0.358 | +0.209 | -0.186 | - | - |
The table above shows the effect of introducing a functional group to the ammonium cation with different electronic natures. The specific charges on the unfunctionalised methyl groups are unaffected by the structural difference. The significant effects are noticed mainly on the functionalised carbon atom (i.e. the carbon to which the functional group is attached to). Introduction of the electron-donating -OH group has a small effect on the central nitrogen atom (-0.295 to -0.313); however the signifcant difference is noticed on the functionalised carbon, as its specific charge changes from -0.483 to -0.094. This is due to being bonded to the highly electronegative oxygen atom which polarises the C-O bond, the positive end of which is located towards the carbon atom. Introduction of the electron-withdrawing -CN group has minimal effect on the central nitrogen atom, however a slightly more noticeable impact on the functionalised carbon (-0.483 to -0.358). This again correlates with the electronegativities of the neighbouring atoms; the differences in electronegativities between atoms bonded to each other polarises the bonds and the specific charges of the atoms involved reflect this accordingly.
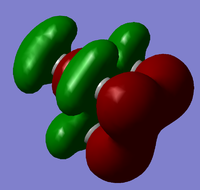
HOMO-LUMO analysis
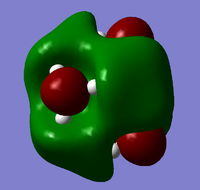
| Cation | HOMO energy (a.u.) | LUMO energy (a.u.) | HOMO-LUMO energy gap (ΔE, a.u.) | HOMO-LUMO energy gap (ΔE, kJ mol-1) |
| [N(CH3)4]+ | -0.57929 | -0.13305 | +0.44624 | +1171.6 |
| [N(CH3)3(CH2OH)]+ | -0.46627 | -0.11995 | +0.34632 | +909.3 |
| [N(CH3)3(CH2CN)]+ | -0.50048 | -0.18184 | +0.31864 | +836.6 |
| Cation | HOMO | LUMO |
| [N(CH3)4]+ | 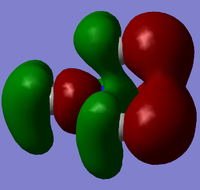 |
|
| [N(CH3)3(CH2OH)]+ | 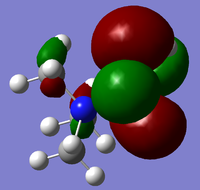 |
|
| [N(CH3)3(CH2CN)]+ | 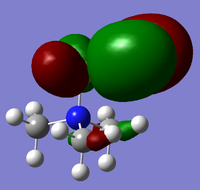 |
|
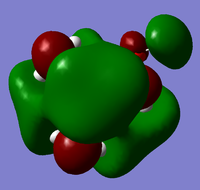
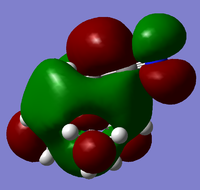
From the above HOMO-LUMO analysis, it can be seen that for the unfunctionalised ammonium cation both the HOMO and LUMO are widely distributed across the whole structure, illustrating a fairly even and consistent coverage of the molecule. However this changes with the introduction of the functional groups; the HOMOs for the functionalised cations are distributed predominantly around the functional groups themselves, whilst the LUMOs adopt a more widespread distribution across the functional groups and the central nitrogen atom. Upon analysis of the HOMO and LUMO energy values, the most apparent trend is that the introduction of functional groups to the cation increases the energy of the HOMOs. The LUMO trend is not as simple: presence of the electron-donating -OH group increases the energy of the LUMO, whereas the presence of the electron-withdrawing -CN group in fact decreases the energy of the LUMO. The net effect of this is observed in the trend of the HOMO-LUMO energy gap: functionalisation of the cation results in reducing the magnitude of the HOMO-LUMO energy gap, enhancing any prospective chemical reactivity. Based on this observation, it can be deduced that the functionalised cation containing the -CN group would be the most favoured cation for accepting an electron promoted from the HOMO in allowing further reactivity, with the functionalised cation containing the -OH group being the least favoured.
Conclusion
Overall, this module has been an interesting and effective way to investigate and learn about the GaussView and Gaussian softwares, and to gain a real understanding of some of the key calculations and analyses that can be performed within computational chemistry. The mini project utilises the knowledge obtained in the first half of the assignment and applies it to a practical example. It is definitely of interest to investigate the effects of introducing functionality into these systems on their energetics at an electronic level. Further work would involve analysing a wider range of functional groups, both electron-donating and electron-withdrawing, in order to build-up a better picture of the overall effects and perhaps identify any other significant factors other than those discussed in this work that may have an influence on various features of the cationic structures. A similar project could also be conducted on various anionic structures to determine whether or not similar effects are observed and whether they are as great or significant as in the case of the cationic species.

