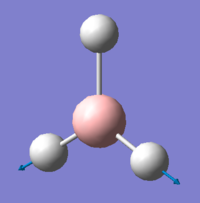
Rep:Mod:vsvp2109
3rd Year Computational Lab - Module 2
Introduction
Intro goes here... Gaussview 5 and Gaussian were used
Optimisation of a molecule
infiasndnfsdf
BH3 - B3LYP, 3-21G optimisation
Results from log file and Gaussview summary provided below:

         Item               Value     Threshold  Converged?
 Maximum Force            0.000413     0.000450     YES
 RMS     Force            0.000271     0.000300     YES
 Maximum Displacement     0.001610     0.001800     YES
 RMS     Displacement     0.001054     0.001200     YES
1)
BH3 - B3LYP, 6-31G d,p optimisation
Results from log fileand Gaussview summary provided below:

         Item               Value     Threshold  Converged?
 Maximum Force            0.000005     0.000450     YES
 RMS     Force            0.000003     0.000300     YES
 Maximum Displacement     0.000020     0.001800     YES
 RMS     Displacement     0.000012     0.001200     YES
Total energies of BH3 optimisations
Total energy for your 3-21G optimised structure = -26.46226338a.u.
Total energy for your 6-31G(d,p) optimised structure = -26.61532374a.u.
TlBr3 - optimisations using pseudo-potentials (LanL2DZ)
Results from log file and Gaussview summary provided below:

        Item               Value     Threshold  Converged?
Maximum Force            0.000002     0.000450     YES
RMS     Force            0.000001     0.000300     YES
Maximum Displacement     0.000022     0.001800     YES
RMS     Displacement     0.000014     0.001200     YES
Optimised molecule of TlBr3
2)
literature values are: 232Å[1] and 120°[2]
BBr3 - optimisation using a mixture of basis sets and pseudo potentials
Results from log fileand Gaussview summary provided below:
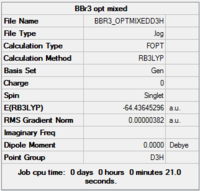
         Item               Value     Threshold  Converged?
 Maximum Force            0.000008     0.000450     YES
 RMS     Force            0.000005     0.000300     YES
 Maximum Displacement     0.000037     0.001800     YES
 RMS     Displacement     0.000024     0.001200     YES
3)
Comparison of bond distances
The bond lengths of the 3 molecules investigated are summarised in the table below:
| Molecule | bond lengths, Å |
|---|---|
| BH3 | 1.1933333 |
| BBr3 | 1.9333333 |
| TlBr3 | 2.655555 |
4), 5)
Frequency analysis
BH3 vibrational analysis
Gaussview summary provided below:
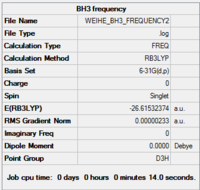
Results from frequency analysis
         Item               Value     Threshold  Converged?
 Maximum Force            0.000004     0.000450     YES
 RMS     Force            0.000002     0.000300     YES
 Maximum Displacement     0.000022     0.001800     YES
 RMS     Displacement     0.000010     0.001200     YES
 Low frequencies ---   -3.4213   -0.0026   -0.0004    0.0015    3.9367    3.9367
 Low frequencies ---   46.4289   46.4292   52.1449
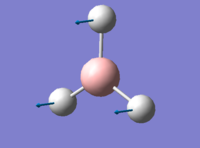
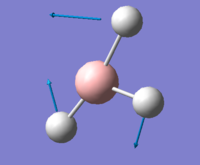
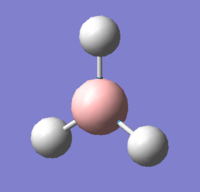
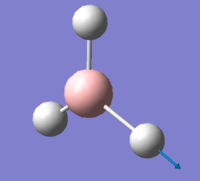
Normal modes of vibration (as predicted) are presented in the table below:
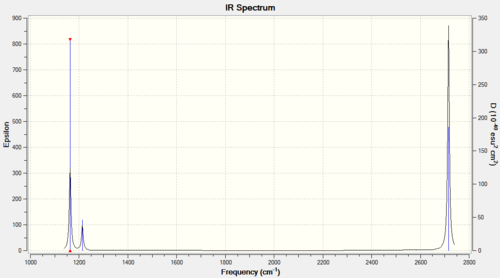
IR spectrum presented below:
TlBr3 vibrational analysis
Gaussview summary provided below:
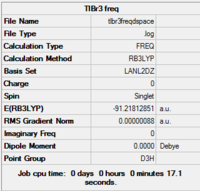
         Item               Value     Threshold  Converged?
 Maximum Force            0.000002     0.000450     YES
 RMS     Force            0.000001     0.000300     YES
 Maximum Displacement     0.000022     0.001800     YES
 RMS     Displacement     0.000011     0.001200     YES
Completed frequency analysis of TlBr3
| Number | Vibrational Mode | Frequency/ cm-1 | Intensity/ cm-1 | Symmetry Point group | Brief description |
|---|---|---|---|---|---|
| 1 | 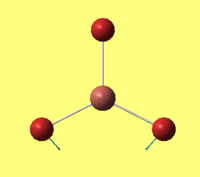 |
46 | 3.7 | E' | |
| 2 | 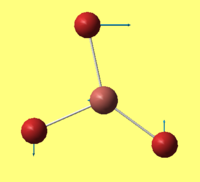 |
46 | 3.7 | E' | |
| 3 |  |
52 | 5.8 | A2' | |
| 4 | 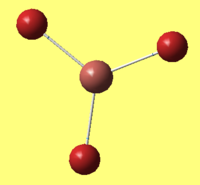 |
165 | 0 | A1' | |
| 5 | 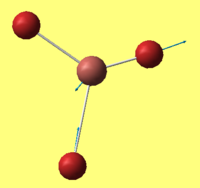 |
211 | 25 | E' | |
| 6 |  |
211 | 25 | E' |
IR spectrum presented below:

NH3
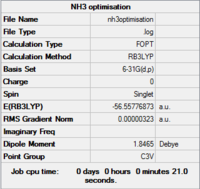
         Item               Value     Threshold  Converged?
 Maximum Force            0.000024     0.000450     YES
 RMS     Force            0.000012     0.000300     YES
 Maximum Displacement     0.000079     0.001800     YES
 RMS     Displacement     0.000053     0.001200     YES
 Predicted change in Energy=-1.629659D-09
 Optimization completed.
    -- Stationary point found.

