Rep:Mod:vrtMgO
Studies on the Thermal expansion of MgO
Introduction
The aims of this report are to study the vibrations of MgO and determine how it expands upon heating by calculation of the thermal expansion coefficient, , given by the following equation:
Each vibration has a wavelength, , and an equivalent wavevector; . Therefore, there is a k-label for every possible crystal vibration. From and it can be seen that where . Consequently, as the k-value increases so does the vibrational frequency, .
A summation over the crystal vibrations allows calculation of the vibrational energy levels present and determination of the average of a specific property.
The ensemble used in this model is the isothermal-isobaric ensemble where the number of particles, N, the pressure, P and the temperature, T are kept constant. This allows the change in volume to be calculated and so the thermal expansion coefficient. Use of an ensemble of system replicas is validated by the Ergodic hypothesis, which assumes that the system exhibits the same average properties in space as a single system exhibits in time.
Outline of methods used
Linux was employed as the operating system to run the computational analysis. DLV allowed visualisation of the methods outputs - the materials structure and properties. The simulation code, used to calculate the crystals thermodynamic properties, was GULP. This is a classical simulation relying on Newton Law.
| Quasi-Harmonic/Lattice Dynamic (LD) method | Molecular Dynamic (MD) method | |
|---|---|---|
| Description | This model is quantum mechanical and phonon-based, it is used to analyse solid-state crystals. It assumes that the harmonic approximation is true for every atom and that the generated oscillations are independent. Using this method, the Helmholtz free energy of the system (A) can be calculated. This equation includes an explicit dependence of phonon frequencies on the volume (the term in red below) so allowing for evaluation of the crystals thermal expansion.
|
This method averages the vibrational modes of a crystal without use of the harmonic approximation. It's dependant on Newton's second Law (F = ma). The forces acting on the atoms are computed allowing determination of the atoms accelerations and vibrational motion. Whilst the vibrations occur, the equations of motion for each atom are solved. The atoms are analysed at set time intervals (0.5 fs) until the property under consideration, in this case A, obtains a (near) constant value at the set temperature. |
| Advantages | Due to its quantum mechanical dependence it accounts for the zero-point energy of the system. This term is seen in the equation for the Helmholtz free energy: . Where; = internal energy of the crystal lattice, = vibrational zero-point energy , = temperature (K), = volume and = entropy.
|
It simulates the motion of the real crystals atoms without relying on the harmonic approximation therefore, bond breaking can be taken into account. |
| Disadvantages | As it is dependent on harmonic motion, it doesn't account for anharmonic motion meaning the approximation breaks down at the when bonds dissociation, especially at the melting point of the crystal being analysed. For MgO this is: 3250 +/- 20 K[1] | There is no consideration of the zero-point energy as it's based on classical mechanics. This reliance means the atomic motion distorts from periodic.
|
Crystal Structure
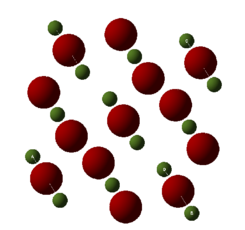
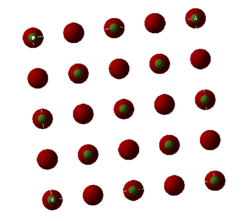
Crystalline MgO takes the form of a face centred cubic (fcc) lattice whereby Mg2+ ions form the basis of the lattice with O2- filling all the octahedral sites. The ions are held in position by electrostatic forces.
MgO can be represented by different cell structures, these are shown below and are named; primitive, conventional or super. The primitive cell is rhombohedron in shape and contains 2 atoms. Via translation along the x, y and z directions, it can be used to create the whole lattice, giving rise to a periodic motif. As such, the local physical properties are invariant under cell translation.
The conventional cell is a cuboid containing 8 atoms, it is the structure normally used to represent MgO as it clearly shows the fcc atomic arrangement.
Lastly, the supercell is created by positioning 8 conventional cells together to create a larger cuboid. As a result, this supercell contains 64 atoms.
The periodic nature of the crystal allows its properties to be written in terms of a Fourier series. Consequently. the cell can be defined in reciprocal space - also referred to as k-space.
In 3D:
Lattice vibrations: Use of LD to compute the phonon dispersion
Atoms oscillate around their equilibrium position in three independent directions, this means a solid can be described as a system of 3N simple harmonic oscillators, where N denotes the number of atoms in the lattice. The oscillations/vibrations give rise to a multitude of thermal and electrical properties.
In a crystal, there are an infinite number of atoms with an infinite number of vibrational degrees of freedom (DOF) = 3N DOF. Atoms in different positions can vibrate with a certain phase shift with respect to each other. This creates vibrational bands/branches.
A vibration can be in the form of a wave or a particle. As the particles in a crystal are close together they vibrate in a uniform fashion at a single frequency, these discrete units of vibrational motion are described by quantum mechanics as phonons. The vibrational band structure is called the phonon dispersion.
For crystal structures with 2 or more atoms in their primitive cell (such as MgO), two types of phonons occur which results in differing branches in the phonon dispersion. These phonon types are acoustic or optical.
| Mode Type | Description |
|---|---|
 Acoustic Acoustic
|
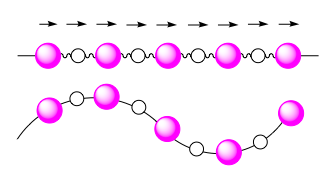
The frequency is acoustic, giving rise to vibrations with a long wavelength. These phonon modes arise from in-phase vibrations between adjacent atoms and converge to . |
 Optical Optical
|
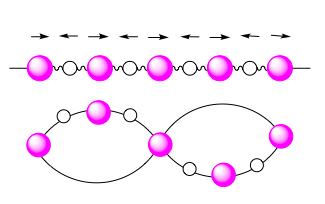
The frequency is in the optical region of the electromagnetic spectrum, the atomic motions associated are the same as the response to an oscillating electromagnetic field. They are seen due to out-of-phase vibrations where 2 adjacent atoms of the crystal lattice move in opposing directions. As a result, they do not converge to . |
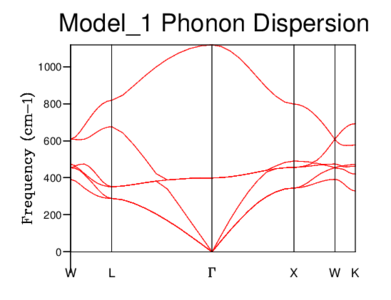
Both optical and acoustic phonons are observed in MgO's phonon dispersion below.
Density of States (DOS) of MgO
A graph of the density of states (DOS), relating to the number of states available at each k-value, can be generated from the phonon dispersion. For example, If the k-value L is taken from the phonon dispersion above, the DOS is simply the number of branches encountered upon a vertical increase in frequency.
DOS was computed for a range of grid-sizes, where increasing grid size means more k-points are incorporated into the calculation. Starting with a grid size of 1x1x1 (which has one k-value) and increasing the grid size, the graph went from having distinct peaks to being a smooth curve with greater resolution. The 4x4x4 grid size is the first to give a more sophisticated view of the DOS than lower dimensional ones. However, it still goes to zero at values where states should be present. The graphs of sizes 32x32x32 and 64x64x64 do not tend to zero and are visually identical. The minimum grid size for a reasonable approximation to the DOS is therefore 32x32x32, due to it giving the same detail as a larger size grid, while being less time consuming. This size was used for all further calculations involving the quasi-harmonic model.
| Grid size | DOS graph | Grid size | DOS graph |
|---|---|---|---|
| 1x1x1 | 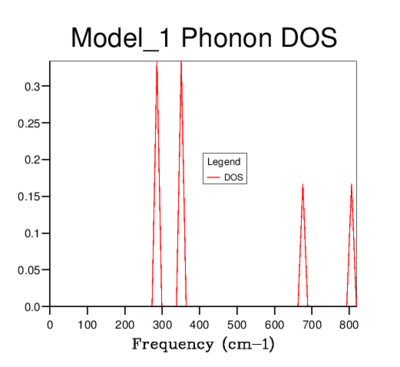 |
8x8x8 |  |
| 2x2x2 | 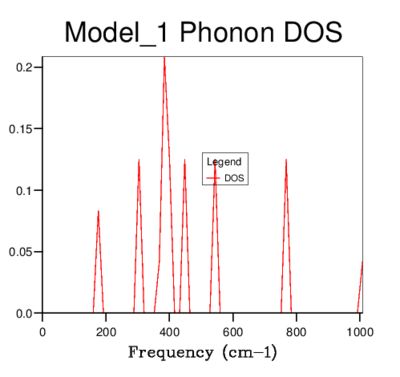 |
16x16x16 | 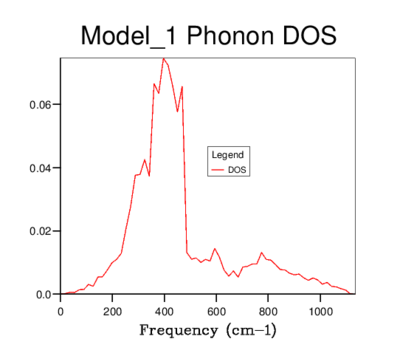 |
| 3x3x3 |  |
32x32x32 | 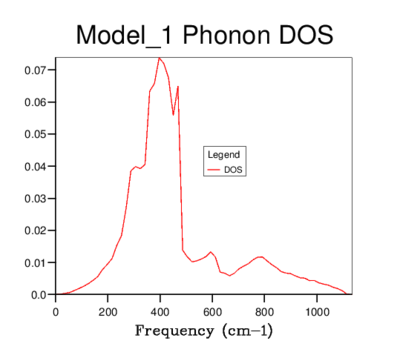 |
| 4x4x4 | 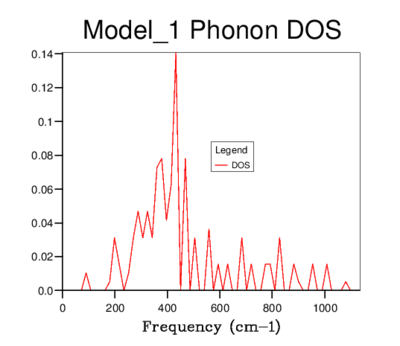 |
64x64x64 | 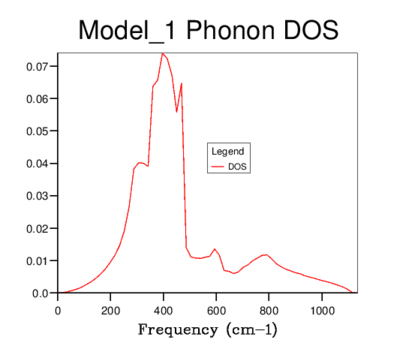 |
For a grid size of 1x1x1, the single k-point used to calculate the density of states was k() which corresponds to symmetry point L from the phonon dispersion. The peaks of the DOS graph are at frequencies of; 288.49, 351.76, 676.23 and 818.82 cm-1 (please refer to this log file: File:Vrt Harmonic approx111.out) which are identical to the frequencies of the bands at point L on the phonon dispersion. The reason that two peaks in the DOS graph have double the intensity compared with the other two is due to the convergence of 4 acoustic lines to 2 lines at this k-value.
The optimal grid size calculated for MgO would be appropriate for calculation on a similar oxide such as CaO. This is because CaO also has an fcc lattice structure (so it's primitive cell will contain 2 atoms) and a similar lattice paramater (4.80 Å [3]). On top of this, the charges on the atoms are the same for MgO so CaOs crystal properties will resemble MgOs.
For a zeolite e.g. Faujasite, a smaller grid size would give a reasonable approximation for the DOS. This is because the primitive cell of Faujasite is larger than MgOs. The lattice parameter = 24.66 Å[4] versus 4.22 Å[5]. Accordingly, in reciprocal space, the primitive zeolite cell will be smaller than MgOs. This is because, in real space the periodic distance = a, whereas in reciprocal space the periodic distance (a*) is inversely proportional to a. a*=. As a result, a smaller grid size should give an appropriate DOS graph as a smaller number of k-points are needed to optimise the calculation.
For a metal e.g. Lithium (Li), whose primitive cell in real-space is smaller than that of MgO at 3.49 Å,[6] the reciprocal space lattice is larger so more k-points are needed to optimise the DOS and a larger grid size would be appropriate.
The Helmholtz Free Energy of MgO
Upon increasing grid size from 1x1x1 to 32x32x32, the recorded Helmholtz free energy increases. It becomes constant (to the accuracy generated by the program) for grid sizes above this so a grid size of 32x32x32 may be used to reliably calculate the free energy of the system.
| Grid size | Helmholtz Free Energy (eV) | Appropriate for calculations accurate to x meV |
|---|---|---|
| 1x1x1 | -40.930301 | |
| 2x2x2 | -40.926609 | |
| 3x3x3 | -40.926432 | |
| 4x4x4 | -40.926450 | |
| 8x8x8 | -40.926478 | |
| 16x16x16 | -40.926482 | |
| 32x32x32 | -40.926483 | x = 1 |
| 64x64x64 | -40.926483 | x = 0.1 |
NOTE: for a calculation accurate to 0.5 meV, a grid size between 32x32x32 and 64x64x64 should be used.
These results highlight a slight decrease in inter-atomic free energy (A) as grid-size increases. This change would effect the equilibrium bond distance of the crystal therefore, the optimal grid sizes for CaO, Faujasite and Lithium, whilst still being similar to those previously mentioned, may deviate slightly.
Application of the Quasi-Harmonic Approximation to the thermal expansion of MgO
The quasi-harmonic model uses the harmonic oscillator to model the atomic vibrations. These vibrations are periodic so have translational symmetry and the primitive lattice cell is used in the following calculations.
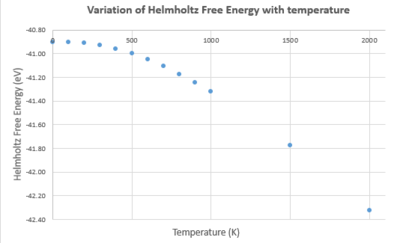
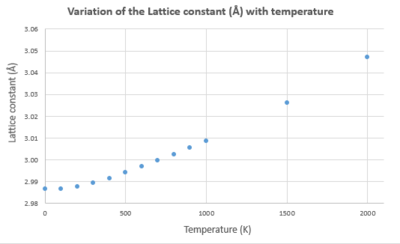
| Temperature (K) | Helmholtz Free Energy (eV) | Lattice constant (Å) | Cell volume (ų) |
|---|---|---|---|
| 0 | -40.90190629 | 2.986563 | 18.836496 |
| 100 | -40.90241981 | 2.986657 | 18.838266 |
| 200 | -40.90937745 | 2.987604 | 18.856201 |
| 300 | -40.92812483 | 2.989390 | 18.890024 |
| 400 | -40.95859432 | 2.991629 | 18.932507 |
| 500 | -40.99943614 | 2.994134 | 18.98011 |
| 600 | -41.04931565 | 2.996820 | 19.031221 |
| 700 | -41.10711950 | 2.999643 | 19.085057 |
| 800 | -41.17189216 | 3.002587 | 19.141316 |
| 900 | -41.24301846 | 3.005634 | 19.199638 |
| 1000 | -41.31984872 | 3.008783 | 19.260042 |
| 1500 | -41.77489284 | 3.026135 | 19.595182 |
| 2000 | -42.32367283 | 3.046983 | 20.00297 |
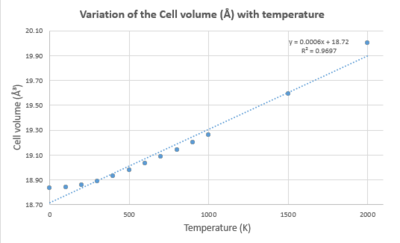
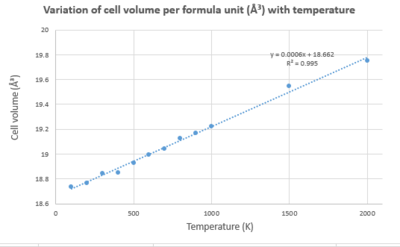
The gradient from the graph of cell volume versus temperature can be used to find a value for . Substituting this value into the equation for gives the value for the thermal expansion coefficient. This is equal to 3.096x10⁻⁵ K-1, which is extremely close to the literature value of 3.706x10⁻⁵ K-1[7] which was calculated over 300 - 2000 K.
NOTE: if the gradient given from the calculated data over the shorter range of 0-1000 K is used, then is calculated as 2.249x10⁻⁵ K-1. This value is further from the literature value - probably because the temperature range used here is smaller than that for literature.
In these calculations, the main approximations are that:
1- The interatomic relationship can be modelled by a morse potential
2- The Mg2+ and O2- are represented as charged hard spheres with no consideration of electrons
3- The crystal has a non-defective, perfect structure
4- The crystal vibrations behave as harmonic oscillations
5- The bonds within the crystal cannot dissociate
The physical origin of thermal expansion arises from the fact that upon heating, the crystal gains thermal energy so the magnitude and frequency of atomic vibrations increase. As a result, the internuclear separation between atoms may be reduced. This is energetically unfavourable and leads to a repulsive interaction between the atoms so the equilibrium bond distances, along with the lattice constants, differ to those at standard temperature. Thus the lattice structure changes.
For a diatomic molecule with an exactly harmonic potential, the internuclear separation is dependent on a second-order, quadratic function. Due to the symmetry of this function, on average, there would be no increase in bond length with increasing temperature. If the quasi-harmonic model is used the internuclear separations would increase with temperature due to the repulsive force the atoms feel when their internuclear separation is smaller than the equilibrium value.
Application of the Molecular Dynamic Approximation for the thermal expansion of MgO and comparison with LD
As the MD model relies on classical mechanics, it requires that the supercell representation of MgO is used. This allows the wavelength fluctuations from the random motion of the atoms to be accurately observed. The generated results were divided by 32 to allow for comparison between those produced using the LD (where the primitive representation was used).
The origin of this factor of 32 is density, an intrinsic crystal property. The density of the primitive cell: , the conventional cell , and the supercell, are equal. This is because the volume of the conventional cell is 4 times that of the primitive cell. The supercell has a volume 8 times that of the conventional cell and 32 times greater than the primitive cell.
The variation in data points generated from the LD and MD models can be attributed to the differing dependences of the models.
Conclusion
Both the quasi-harmonic (LD) and molecular dynamics (MD) produced values for of the same order as in literature. The best match used data from the quasi-harmonic model over a temperature range of 0 - 2000 K. This is probably due to this temperature range being similar to that used to obtain the literature value.
Results from the quasi-harmonic model were as expected - upon increasing temperature the lattice constant and cell volume also increased. This is because the crystal is gaining thermal energy so electrons in the bonds are promoted to excited states. These states may be anti-bonding in nature so bond lengths increase. A lowering of the Helmholtz free energy was also recorded.
Results from the molecular dynamics model reproduced the trend that increasing temperature increases the cell volume.
Both models trend lines for cell volume vs temperature have similar gradients. The values plotted differ most in the low temperature (0-400 K) and the high temperature (1500 - 2000 K) regions.
At high temperatures, the quasi-harmonic model breaks down as it fails to consider anharmonic motion, implying bond dissociation cannot occur. In comparison, the MD model can consider bond breaking processes. At high temperatures, classical behaviour - which the MD model is based on - dominates the system, so the MD model is more suitable for this range. However, above the melting point of MgO neither model is a good fit as in molten/liquid form, the unit cell is not an accurate representation of the lattice structure as it is no longer periodic.
In the low temperature limit quantum behaviour dominations. Thus, the LD model is more appropriate here as it considers the zero-point energy which is a quantum phenomenon.
Overall, over the temperature range sampled, both methods appear to be a good fit for predicting how MgO expands when heated and finding the subsequent thermal expansion coefficient.
- ↑ C. Ronchi, M. Sheindlin, J. Appl. Phys, 2001, 90 (7), 3325-3331
- ↑ J.M. Ziman, Electrons and phonons, Clarendon Press, Oxford, 1st edn., 2001, ch.1, pp. 37-39.
- ↑ O. Madelung, U. Rossler, M. Schulz, II-VI and I-VII Compounds; Semimagnetic Compounds, Springer Berlin Heidelberg, Berlin, Heidelberg, 1999
- ↑ D.N. Stamires, Clays Clay Miner, 1973, 21, 379-389
- ↑ A. Cimino, P. Porta, M. Valigi, J. Am. Ceram. Soc., 1966, 49, 152-156
- ↑ Hermann, Bulk Crystals: Three-Dimensional Lattices, Wiley-VCH Verlag GmbH & Co. KGaA, Weinheim, Germany, 2011
- ↑ O. L. Anderson and K. Zou, J. Phys. Chem. Ref. Data, 1990, 19, 69.

