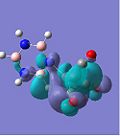
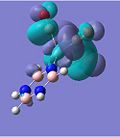
Rep:Mod:vogue0000
Bonding: Ab Initio and Density Functional Orbitals
In the following module, some useful computational techniques will be explored and examined. Computational chemistry can be very informative, as it provides one with an insight into the structure and bonding of systems. This is particularly useful for the complicated bonding within inorganic complexes. It is no wonder why computational methods are being exploited in order to design better and cheaper catalysts. One is able to discover the lowest energy conformation, as well as locate transition states and activated complexes that may be difficult to distinguish experimentally. Not only are thermodynamic and kinetic data obtainable, but as are a number of properties, such as IR and Raman spectra, dipole moments, and electronic density, which in turn provides imperative information on the bonding and local interactions between atoms. The experiments in this module will show ways to extract and analyse some of the computer generated information obtained.
The following errors will be assumed henceforth:
- Energies will have an error of ≈ 10 kJ/mol ~ 3.8 x10⁻³ a.u.
- The dipole moment will be accurate to ~ 2 decimal places ~ 0.01 Debye.
- Frequencies (cm-1) are accurate to 0 decimal places due to a systematic error of around 10%.
- Intensities are approximated to the nearest integer, although the accuracy is much less that this.
- Bond distances are accurate to ≈ 0.01 Å .
- Bond angles are accurate to ≈ 0.1°.
Analysis of BH3
Optimisation of BH3
In order to gain familiarity with the calculations and procedures required in this module, an initial analysis of BH3 was carried out. The borane molecule was first drawn in Gaussview, where the B-H bond was set to an arbitrary bond length of 1.5 Å. This molecule was then optimised using a BLYP method and a 3-21G basis set.
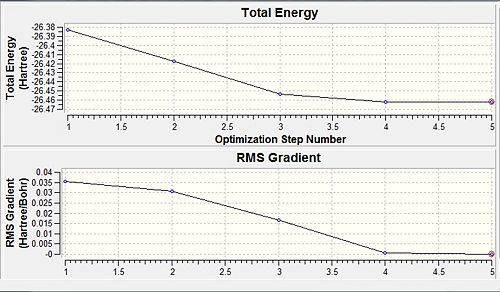
After optimisation, the B-H bond length decreased to 1.19 Å, whilst the H-B-H angle remained at 120o, which is predicted by VSEPR theory. These findings are reinforced by the data provided by Schuurman et al[1]. The optimisation produced two graphs, the RMS gradient and the total energy respectively as a function of the optimisation step number. The RMS gradient is the derivative of the energy with respect to the spatial separation of atoms, which tends to zero as the optimisation proceeds. The final points on each graph represent the energy and RMS gradient of the final geometry, which is zero in both cases implying that this is actually the lowest energy geometry of BH3.
Molecular Orbitals of BH3
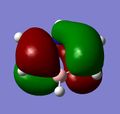
The molecular orbitals of BH3 were calculated using Gaussian, Ref:http://hdl.handle.net/10042/to-5711
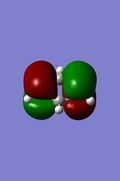
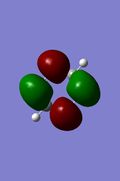
The computed MOs were then used to compare alongside a qualitative MO diagram, which was constructed using the linear combination of atomic orbitals (LCAO) approach.
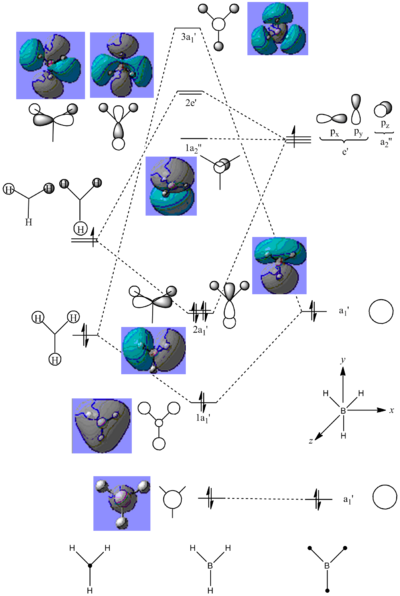
The qualitative and quantitative MO counterparts correspond very well pictorially, as evident by the similar phase distributions. However, the computer generated model can predict quantified MO energies, whereas the LCAO method can only assume the relative energies of each MO, so at times it is difficult to predict how stabilised or destabilised a bonding or anti-bonding molecular orbital actually is. This can be illustrated by the ordering of the 2e' and 3a1' orbitals. It is difficult to assign which of the two molecular orbitals is higher in energy by the LCAO approach; the computer generated orbitals, on the other hand, can predict that the 3a1' is the higher energy orbital. Examples like this show the advantages in computational chemistry. This is not to say qualitative MO theory is not useful, since it is, especially in forecasting molecular orbital shapes, atomic orbital contributions and MO mixing.
Vibrational Frequencies of BH3
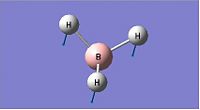
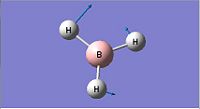
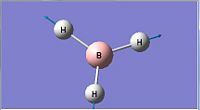
Frequency analysis of BH3 was carried out in order to verify that the optimised structure was indeed that of minimum potential energy. The vibrational frequencies were calculated, which correspond to the predicted IR spectrum of the molecule.
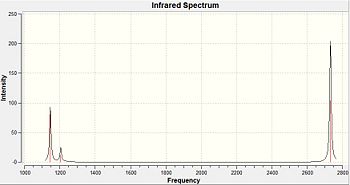
When comparing the generated vibrational frequencies to the literature IR values, the first notable difference is that there are only 5 IR peaks reported in the experimental data, whereas there are 6 computer generated vibrational modes. This can be explained since the missing IR peak has an intensity of zero, since it shows the symmetric stretch. The IR spectrum measures changes in dipole moments as a result of vibration. Since BH3 has D3h symmetry, there is no change in dipole moment observed from the symmetric stretching of all the B-H bonds, thus, this particular vibrational mode is non-IR active.
The computed values corresponding to wagging and rocking are similar to those in the literature, however, the higher frequency IR stretches are a poor prediction. This could be due to the anharmonicity terms, which are not taken into account by Gaussian.
Analysis of TlBr3
http://hdl.handle.net/10042/to-5942
| File Type | .log |
| Calculation Type | FOPT |
| Calculation Method | RB3LYP |
| Basis Set | LANL2DZ |
| Final Energy / a.u. | -91.2181 |
| RMS Gradient Norm / a.u. | 0.00001703 |
| Dipole Moment / Debye | 0.00 |
| Point Group | D3h |
| Job Time / s | 39.0 |
| Tl-Br Bond Length / Å | 1.87 |
| Br-Tl-Br Bond Angle / o | 120.0 |
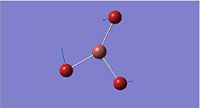
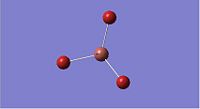
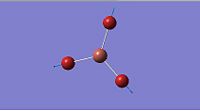
A similar optimisation process to that of BH3, will be used to carry out the optimisation for a molecule of TlBr3. The primary difference being that a medium-level basis set of LanL2DZ will be used (which employs pseudo potentials on the heavier elements) and as well as this, the symmetry of the molecule will be restrained to D3h.
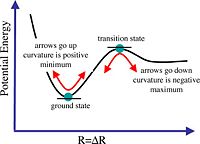
Optimisation provides a means to find the ground state conformation of the molecule, hence, the conformation with the lowest energy. During the optimisation process, the parameters of the molecule are continuously adjusted until the first derivative of the potential energy is zero. However, this point may either be a maximum, which represents a transition state, or a minimum, indicating the ground state.
Frequency analysis calculates the second derivative of potential energy. When all the vibrational frequencies of the molecule are positive, this indicates that the potential energy is at a minimum, and hence the optimised structure is the ground state of the molecule. If one of the frequencies is negative, the potential energy is at a maximum, and a transition state is found. If more than one frequency is negative, then the optimisation has failed to find a turning point. Thus, frequency analysis is necessary to determine that the optimised structure is indeed the ground state structure of the molecule (ie. the lowest energy conformation).
Both frequency analysis and optimisation calculations must be conducted employing the same method and basis set. This is because the frequency analysis must be computed in the same manner as optimisation for it to be an accurate representation of the second derivative of potential energy. The use of a different method would render the frequency analysis incompatible with the optimisation, since the two different methods may produce two different potential energy curves, which cannot be compared to one another.
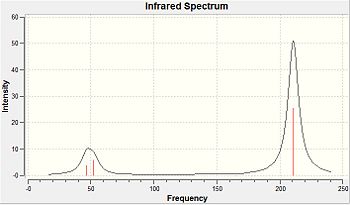
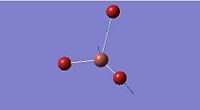
Due to programming restraints in Gaussview, at times, particularly post-optimisation, the programme omits bonds within a structure. This is because Gaussview has a database of bond lengths, which alert the program to when bonds should be drawn. When the calculated distance between atoms exceeds the specified bond length in the database, Gaussview does not draw in the bonds since it is unrecognisable. This is a particular problem for inorganic compounds, since the Gaussview database is greatly based on organic compounds.
A chemical bond can be defined as a force of attraction between two or more atoms that confers stability to the overall di- or poly- atomic species.[2] The strength of the bond can vary. Strong bonds are formed from: the electrostatic interaction between a positive cation and a negative anion (ionic bonding); the electromagnetic interactions between positively charged nuclei and negatively charged shared electrons (covalent bonding); ion-dipole bonding [3]; the electrostatic interactions between cations and electrons (metallic bonding). The electrostatic attraction between dipoles (as seen by hydrogen bonding) can result in weak bonds.
Isomers of Mo(CO)4(PCl3)
Using the LANL2DZ basis set with tight convergence, the relative thermal stability and spectral characteristics of the cis- and trans- isomers of Mo(CO)4(PCl3) will be predicted.
| Property |
|
| ||||||
|---|---|---|---|---|---|---|---|---|
| File Type | .log | .log | ||||||
| Calculation Type | FOPT | FOPT | ||||||
| Calculation Method | RB3LYP | RB3LYP | ||||||
| Basis Set | LANL2DZ | LANL2DZ | ||||||
| Final Energy / a.u. | -623.5771 | -623.5760 | ||||||
| Final Energy / kJ mol-1 | -1637202 | -1637199 | ||||||
| RMS Gradient Norm / a.u. | 0.00000827 | 0.0000151 | ||||||
| Dipole Moment / Debye | 1.31 | 0.3047 | ||||||
| Point Group | C1 | C1 | ||||||
| Job Time / mins | 46 | 70 |
From the above results, it is evident that the cis- isomer is lower in energy than the trans- isomer, by 3 kJ mol-1. The difference in energy is so minute that in reality, both isomers can in fact be isolated. Nonetheless, the cis-Mo(CO)4(PCl3) is more thermally stable. This can be explained by the trans effect, since the CO ligands are strong π-acceptors, so the favoured orientation is achieved when fewer CO ligands are opposite each other, hence, the cis- isomer. I.e. The cis-isomer only has one pair of CO ligands trans to each other, whereas the trans-isomer has both of its CO pairs trans.
Carbonyl Stretching Frequencies of Mo(CO)4(PCl3)2 Isomers
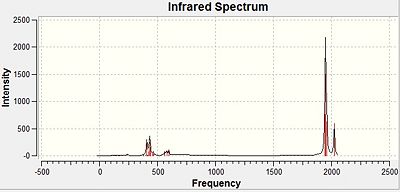
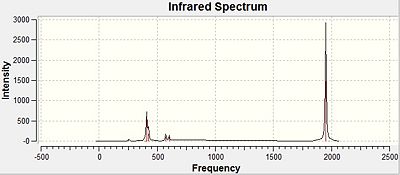
The highest vibrational frequencies generated for both cis- and trans- Mo(CO)4(PCl3)2 correspond to the carbonyl stretching frequencies, which are recorded below. The CO stretching frequencies are an indication to the relative CO bond strengths, which are slightly different in the two isomers. This is due to the positioning of the two PCl3 π-acceptor ligands,[4] which affect the strength of the CO bond, and hence, their stretching frequencies. As the position of these ligands also determines the symmetry of the molecule, the IR spectra generated for each isomer will differ too.
| CO stretch | Literature Frequency[5] / cm-1 | Calculated Frequency / cm-1 | Calculated Intensity | Point Group (C2v Symmetry) |
|---|---|---|---|---|
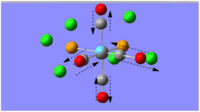 |
1986 | 1945 | 763 | B2 |
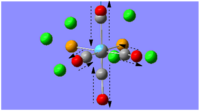 |
1994 | 1949 | 1498 | B1 |
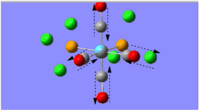 |
2004 | 1958 | 633 | A1 |
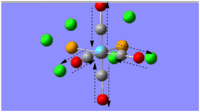 |
2072 | 2023 | 598 | A1 |
There is no symmetric CO stretch for the cis- -isomer, since the CO ligands are not arranged symmetrically about the Mo centre, therefore, all the CO stretches are IR active. This explains why both the computed frequencies and the literature data show the same number of detected vibrational modes.
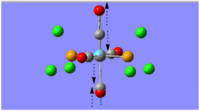
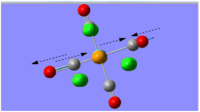
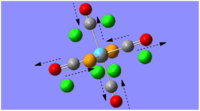
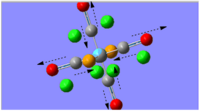
| CO Stretch | Experimental Frequency[5] / cm-1 | Calculated Frequency / cm-1 | Calculated Intensity | Point Group (D4h Symmetry)[5] |
|---|---|---|---|---|
 |
1896 | 1950 | 1475 | Eu |
 |
1896 | 1951 | 1467 | Eu |
 |
- | 1977 | 1 | B1g |
 |
- | 2031 | 4 | A1g |
The primary difference between the computed frequencies and the literature values for the trans-isomer is the number of vibrational modes detected. The computer generated frequencies show the observation of two more CO stretches, however, since both the stretches have relatively small intensities this can explain why they are not observed in the literature IR spectra. Unlike the cis-isomer, the trans-isomer does show symmetric CO stretches, which do not result in a change in net dipole moment, hence, they are non-IR active vibrational modes.
The computed frequencies for the cis- and trans- isomers show a rough similarity to the literature IR data, however, disappointingly they are not a very accurate match. This could be accounted for since Gaussian fails to treat the anharmonicity terms when calculating the vibrations; as well as this, the π-backbonding character shown by CO ligands seems to be ignored in the calculations too.
Mini Project
Kang's studies of main-group metal borazine sandwich complexes DOI:10.1021/jp046279d , has provided me with a great starting point for this project. Borazine, which was first produced by Alfred Stock in 1926, is a planar ring compound that is better known as "inorganic benzene". Even though borazine is isoelectronic and almost isostructural to benzene, it undergoes some differences in its chemistry, which is best illustrated by its addition reactions as oppose to benzene's aromatic substitutions. The project will entail extending Kang's examination of the calcium sandwich complexes, since calcium was concluded to be the best mediator in the formation of borazine sandwiches from the main-group metals tested. To branch away from Kang's studies of main-group metal complexes, I will explore transition metal centred sandwiches by examining chromium complexes and how the substitution of one atom in the borazine ring to a heavier atom affects the properties of the overall complex.
Optimisation and Frequency Analysis
Each of the structures produced in this project were constructed using Gaussview and then optimised using the DFT/B3LYP method, where a pseudo potential (LanL2DZ) was employed for the heavier metal centre and a 6-311G(d,p) basis set used for all other atoms.
Ca Borazine Sandwich Complex Analysis
The optimal bonding of the borazine rings to the calcium ion was that so where a boron atom from one borazine ring would bond to the Ca atom, which would then bond to the nitrogen atom of the second borazine ring. The first optimisation produced a transition state, which was only indicated after conducting the frequency analysis calculations. The critical point found was evidently a transition state as one of the vibrational frequencies was negative, showing that the second derivative potential energy surface has reached a maximum.
As evident by the Jmol image, the transition state was detected when the two borazine rings were orthogonal to each other. The favoured conformation (/lower energy conformation) is that where the two borazine rings and the Ca atom are planar, as shown in the image to the left. The planarity of the complex is suggestive of the delocalised π-electrons above and below the rings.
| Transition state | |||
|---|---|---|---|
|
| Lowest energy Conformation | |||
|---|---|---|---|
|
| File Type | .log |
| Calculation Type | FOPT |
| Calculation Method | RB3LYP |
| Basis Set | Gen |
| Final Energy / a.u. | -520.8183 |
| RMS Gradient Norm / a.u. | 0.00001053 |
| Dipole Moment / Debye | 1.3979 |
| Point Group | C1 |
| Job Time / mins | 44 |
| N-Ca Bond Length / Å | 2.34 |
| B-Ca Bond Length / Å | 2.76 |
| N-Ca-B Bond Angle / o | 176.37 |

The Ca borazine sandwich complex produced 63 different vibrational modes, ranging from contraction of the borazine rings, to displacement of the calcium ion. Therefore only a few of the most interesting frequencies are noted below, however, the actual computed file can be found here [2].
Ca Benzene-Borazine Sandwich Complex
Kang observed a 2:1 formation of calcium benzene-borazine sandwich complexes to calcium borazine sandwich complexes, which is why the stability of the former will be examined. It will be interesting to see the effects of changing one of the ring systems of the sandwich complex, especially by replacing borazine with benzene which is known to be more aromatic.
The molecule was optimised and a frequency analysis was conducted to ensure that the conformation formed did in fact have the lowest energy. The data obtained is shown. Gaussview has failed to show the Ca-B bond in the complex, owing to the limited inorganic bond lengths in its database. This was not a problem in the previous example since that conformation showed the aromatic systems planar, whereas in this example, the borazine is slightly puckered and as evident by the B-Ca bond length it is slightly further away.
| Lowest energy conformation | |||
|---|---|---|---|
|
| File Type | .log |
| Calculation Type | FOPT |
| Calculation Method | RB3LYP |
| Basis Set | Gen |
| Final Energy / a.u. | -510.3450 |
| RMS Gradient Norm / a.u. | 0.00000251 |
| Dipole Moment / Debye | 1.5400 |
| Point Group | C1 |
| Job Time / hours | 2 |
| B-Ca Bond Length / Å | 2.78 |
| C-Ca Bond Length / Å | 2.53 |
| N-Ca-B Bond Angle / o | 179.97 |
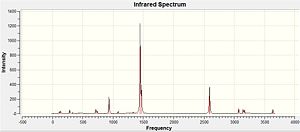
Like the borazine-Ca-borazine sandwich complex, the benzene-borazine analogue generated many vibrational modes, which is why there are only a few shown above. For comparative reasons, the same vibrational modes were chosen for this complex. Considering that one borazine ring was replaced by a benzene ring, the vibrational frequencies correspond relatively well to each other. This is particularly highlighted by the symmetric stretching, which is only localised to the borazine system in both complexes.
Cr Borazine Sandwich Complex
The next complex explored will show the effects of substituting the main-group metal ion for a transition metal ion, as seen by the chromium borazine sandwich. The primary difference between the two metals obviously being that the calcium ion lacks the available d-orbitals the chromium ion has for bonding. With this being said, the chromium complex will be predicted to have stronger bonding than the calcium ion analogue.
| Lowest energy conformation | |||
|---|---|---|---|
|
| File Type | .log |
| Calculation Type | FOPT |
| Calculation Method | RB3LYP |
| Basis Set | Gen |
| Final Energy / a.u. | -570.4521 |
| RMS Gradient Norm / a.u. | 0.00000570 |
| Dipole Moment / Debye | 2.3273 |
| Point Group | C1 |
| Job Time / hours | 10 |
| B-Cr Bond Length / Å | 2.13 |
| N-Cr Bond Length / Å | 1.88 |
| N-Cr-B Bond Angle / o | 116.01 |
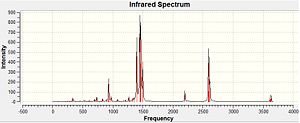
Cr(CO)3 Borazine Complex
By replacing one of the aromatic rings with carbonyl ligands, an exploration of how these ligands stabilise the complex can be conducted. It is evident from the results obtained that the borazine-Cr(CO)2 complex is more stable than any other examined thus far in this project.
| Lowest energy conformation | |||
|---|---|---|---|
|
| File Type | .log |
| Calculation Type | FOPT |
| Calculation Method | UB3LYP |
| Basis Set | Gen |
| Final Energy / a.u. | -668.5431 |
| RMS Gradient Norm / a.u. | 0.00000780 |
| Dipole Moment / Debye | 3.0027 |
| Point Group | C1 |
| Job Time / hours | 15 |
| N-Cr Bond Length / Å | 1.90 |
| C-Cr Bond Length / Å | 1.87 |
| C'-Cr Bond Length / Å | 1.91 |
| C-Cr Bond Length / Å | 1.89 |
| N-Cr-C Bond Angle / o | 96.77 |
| N-Cr-C Bond Angle / o | 128.54 |
| N-Cr-C Bond Angle / o | 135.56 |

The carbonyl stretches are in accordance to the literature values for complexed terminal CO ligands.[3]
Charge Distribution Analysis


The images to the left expose the charge distributions for the atoms in the named complexes, using a colour key (furthest to the left) and using numerical data. A bright red atom indicates an extremely negative charge and a fluorescent green shows a very positive charge; the darker atoms lie in the region of the two extremes, i.e. in the neutral region.
The common factor in all of the charge distributions is the extremely positive central metal ion, which is clear since it is the brightest shade of green. The highly positive cation affects the bounded nitrogen atoms the most, since this atom is undoubtedly the most negative atom in the complexes. The bound boron atom to the metal centre is not as negative since boron is relatively electropositive, so it should really be depicted as a green atom; however, the effects of being bound to an even more positive species (such as the metal ion) encourage boron to contain more of the electron density.
Looking at both of the calcium complexes in more detail, it is apparent that the ring atoms are relatively neutral. This is most shown by benzene in the second image, which appears to be more neutral than the borazine counterpart. This is clear since there is a large eletronegativity difference between the nitrogen and boron atoms, which is absent in the benzene ring as it consists solely of a carbon framework.
The chromium complexes show less neutral atoms and a larger separation of charge. This can be explained by the higher charge density of the Cr metal centre, in comparison to that of Ca. The higher charge density of the chromium ion ensures the atoms directly bound to it are more negative. I.e. The boron atom bound to the Cr ion is more negative than the boron atom bound to the Ca ion. The same could be said for the N atom bound to Cr, instead of Ca. This in turn encourages the other ring atoms to adopt more localised charges, which explains why the atoms in the borazine rings of both complexes are less neutral. The final image of the borazine-Cr(CO)3 complex shows the carbon atoms here to be rather positive, especially when one compares these carbon atoms to that of the benzene ring in the benzene-borazine calcium complex. This is primarily due to the electronegative oxygens bound to the carbons in the carbonyl complex, rendering the carbonyl carbons electrophilic.
A vast amount of organic and inorganic chemistry is based upon the carbonyl groups, owing to the electrophilic nature of the carbon, as it is readily susceptible to attack by nucleophiles. The charge distribution analysis of these complexes shows how borazine is able to undergo both nucleophilic attack at the nitrogen atoms and also electrophilic attack at the boron atoms. If the cation-bound nitrogen was not sp2 hybridised, it would make a very strong nucleophile.
MO Analysis
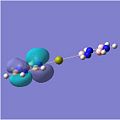
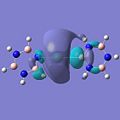
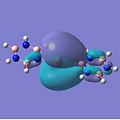
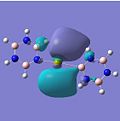
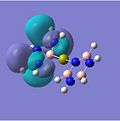
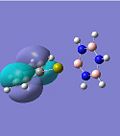
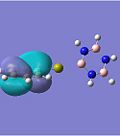
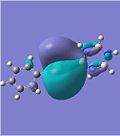
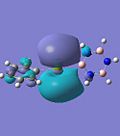
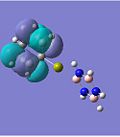
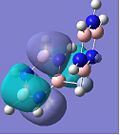
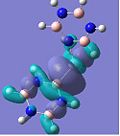
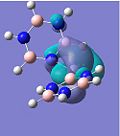
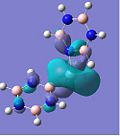
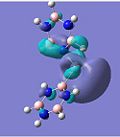
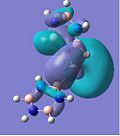
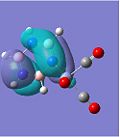
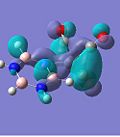
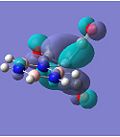
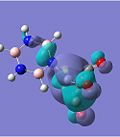
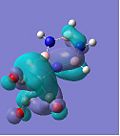
The molecular orbitals for the studied complexes provide arguably the most interesting information about them. One would expect to observe clouds of delocalised electrons above and below the planes of each of the aromatic systems to hint at the presence of π-bonding. This is exactly what can be seen in the images above. The HOMO-3 shows the 1e' ' occupied π-orbitals of borazine (D3h) in all of the complexes, except for the calcium benzene-borazine sandwich, where the 1e1g occupied π-orbital of benzene (D6h) is shown instead. By examining these two π-orbitals, they appear very similar in shape and phase distribution. However, the borazine orbital looks slightly elongated in relation to the symmetric benzene π-orbital. This can be accounted for by the differing electronegativities within the borazine system, as well as the different sized orbital lobes.
If one only considers the two calcium complexes for the moment, one can see that the HOMO-2 images show a similar bonding to that in the HOMO-3, except that a different degenerate 1e" π-orbital is used for bonding in borazine (borazine sandwich). The overall shape of the molecular orbitals of the borazine and benzene-borazine calcium complexes are rather alike, which is expected since the pair are isoelectronic. However due to the electronegativity difference between the nitrogen and boron atoms in borazine, the π-electron density is unequally distributed. This is clearly depicted in LUMO+3 of the Ca borazine sandwich, which shows the boron atoms in the ring to have a larger anti-bonding character, compared to the nitrogen atoms. This can be explained using Hückel's theory, since the less electronegative boron atoms have a larger anti-bonding coefficient, whilst the more electronegative nitrogen atoms have larger coefficients in the bonding orbitals. This point is particularly highlighted by looking at the LUMO+3 benzene-borazine complex directly below it, which shows the symmetrical anti-bonding orbitals of the benzene ring. Since the borazine π-electron density is asymmetric, the ring π-bonding is reduced, rendering borazine less aromatic than benzene. This clarifies why borazine can give up its relatively weak aromaticity in order to undergo addition reactions, whereas benzene's aromaticity confers much more stability to the molecule, so substitution reactions are only allowed.
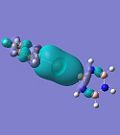
Another difference is shown by the bonding of the aromatic systems to the central calcium ion. In HOMO-1, the benzene-borazine complex, shows a large orbital spanning between the two rings. This complexation appears stronger than the borazine sandwich, thus, supporting why on formation, Kang observes a 2:1 ratio of benzene-borazine:borazine calcium sandwiches.
The molecular oribitals for the Cr complexes look remarkably different to that of the Ca complexes, which can be accounted for by the presence of the d-orbitals of the transition metal ion. Cr has 5 valent d-electrons and 1 s-electron, whereas Ca only has 2s-electrons available for bonding. The shape of the d-orbitals differs vastly from the spherical s-orbitals, which explains why the chromium MOs look different to the calcium ones. For example, the HOMO of the Cr borazine sandwich shows the large 3dz2 orbital in the centre bonded to the two aromatic systems.
The second chromium complex generated very interesting MOs due to the π-acceptor nature of the carbonyl ligands. Important features to note are how the metal's dxz and dyz e orbitals are orientated in a way that overlaps well with the σ-orbitals of the ligands, which results in Cr-CO σ-bonding and anti-bonding orbitals, which are primarily d in character. The metal's dx2-y2 and dxy orbitals are orientated so that it can donate electron density to the low-lying carbonyl π* anti-bonding orbital. This π-backbonding character therefore stabilises the electron rich complex.
Conclusion
To conclude, the computational techniques established earlier in this module have greatly assisted in exploring Kang's examination of metal-borazine sandwich complexes. The results obtained reinforce those found by in the literature in 2005. Computational chemistry provides one with the ability to predict properties and structural bonding of complexes that may not be experimentally feasible.
References
- ↑ M.S. Schuurman, W.D. Allen, H.F. Schaefer III, J. Comput. Chem., 2005, 26, 1106: DOI:10.1002/jcc.20238
- ↑ L. Pauling, The Nature of the Chemical Bond, 3rd Ed, Cornell University Press, New York, 1960, p. 6
- ↑ I. Langmuir, J. Am. Chem. Soc., 1919, 41, 868: DOI:10.1021/ja02227a002
- ↑ E.C. Alyea, S. Song, Inorg. Chem., 1995, 34, 3864: DOI:10.1021/ic00119a006
- ↑ 5.0 5.1 5.2 F.A. Cotton, Inorg. Chem., 1964, 3, 702: DOI:10.1021/ic50015a024
D-Space References
- BH3 Molecular Orbital Analysis [4]
- TlBr3 Frequency Analysis [5]
- cis-Mo(CO)4(PCl3)2 Final Optimal Energy [6]
- cis-Mo(CO)4(PCl3)2 Frequency Analysis [7]
- trans-Mo(CO)4(PCl3)2 Final Optimal Energy [8]
- trans-Mo(CO)4(PCl3)2 Frequency Analysis [9]
- Ca Borazine Sandwich Complex Optimisation[10]
- Ca Borazine Sandwich Complex Frequency [11]
- Ca Borazine Sandwich Complex MO Analysis [12]
- Ca Borazine-Benzene Sandwich Complex Optimisation [13]
- Ca Borazine-Benzene Sandwich Complex Frequency [14]
- Ca Borazine-Benzene Sandwich Complex MO Analysis [15]
- Cr Borazine Sandwich Complex Optimisation [16]
- Cr Borazine Sandwich Complex Frequency [17]
- Cr Borazine Sandwich Complex MO Analysis [18]
- Cr Borazine-Carbonyl Complex Optimisation [19]
- Cr Borazine-Carbonyl Complex Frequency [20]
- Cr Borazine-Carbonyl Complex MO Analysis [21]


