Rep:Mod:velociraptor
Name: Genco Devrim Barikan, CID:00610085, Computational Lab: Module 2
Introduction: A Quantum Computational Approach to Inorganic Systems
Inorganic systems can often prove difficult to deal with in terms of their system parameters. In this study, Gaussian software is used to predict geometries and such parameters, as well as structural properties such as certain spectroscopic measurements. An outline of each structure is obtained in terms of overall energy, dipole moment, bond length bonding etc. Isomeric structures are studied and compared using energy values obtained from optimisations, also discussed in depth.
Exercises
Borane: Symmetry in Vibrational Analysis and MO Theory
Overview
Borane molecule has been studied using Gaussian for calculations. The basis set and the calculation methods have been specified where needed. Analysis of results have been given and comments made upon for molecular orbitals and vibrational calculations. All calculations have been explained and most of the extracts from the .log files included as an introduction template. The .log files have not been included for all calculations, instead the DSpace links have been provided.
Molecular Orbital Theory and Diagram
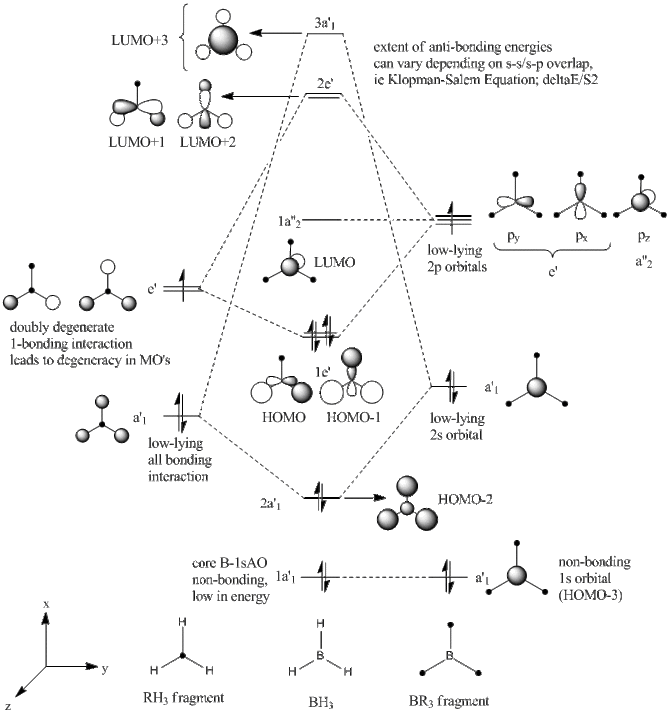
Molecular orbitals of BH3 have been predicted and drawn using an ab initio approach of LCAO theory, starting from the two fragments, BR3 and H3R. Reference. http://www.huntresearchgroup.org.uk/teaching/teaching_comp_lab_year3/Tut_MO_diagram_BH3.pdf. Extent of mixing is shown on the MO diagram, and confirmed in table blabal alogn with the degeneracies of the mixed MO's.
| Orbital | Description | Relative energy | Degeneracy |
|---|---|---|---|
| LUMO+3 | Anti-bonding out-of-phase interaction between 2sAO and H3 FO's. Boron 2sAO has larger contribution due to unequal FO energies. | +0.081 | 1 |
| LUMO+2 | Anti-bonding out-of-phase interaction between e'-symmetric H3 FO and Boron 2px-2py. Contribution from Boron-AO larger. | +0.077 | 2 |
| LUMO+1 | +0.077 | ||
| LUMO | Boron 2pz orbital non-bonding due to unmatched a"2 symmetry. Negative energy indicates slight stability despite being vacant, further discussed in NBO Analysis. | -0.198 | 1 |
| HOMO | In-phase mixing of e'-symmetric single-nodal H3 FO's with Boron 2px and 2py orbitals, resulting in single-nodal MO's that are degenerate in energy. | -0.428 | 2 |
| HOMO-1 | -0.428 | ||
| HOMO-2 | Mixing of all-bonding H3 fragment orbital and 2sAO or Boron, both showing a'1 symmetry. The orbital contribution from the H3 fragment is larger due to a slight difference in energies of 2sAO and the H3FO, resulting in unequal splitting and hence larger Hydrogen s-orbitals in HOMO-2. | -0.578 | 1 |
| HOMO-3 | The core-1sAO of Boron does not mix with the H3 fragment despite having a'1 symmetry, due to
it's low-lying nature arising from the large energy gap between the succeeding molecular orbital (~6 Hartrees). |
-6.544 | 1 |
The negative (-) energy LUMO level indicates that this orbital is slightly stabilised, however this is confirmed neither by intuition nor emirical data. Moreover, this could essentially be an inherent fault in the Gaussian program as the NBO analysis gives secondary orbital interactions (mainly Rydberg* ones) that are not realistic, hence this slight stabilisation of the LUMO will be considered as a small discrepancy. Therefore LUMO is considered to have a relatively stabilisation energy of zero (non-bonding).
Gaussian ab inito DFT calculations have been run on an pre-optimised geometry of the D3h symmetric BH3 molecule in order to obtain the Molecular Orbital and Natural Bond Orbital Analysis for the compound. The details of the optimisation are given further below in this section. The relevant MO's obtained from the Gaussian software are given below along with their LCAO equivalents.
| Approach | HOMO-3 | HOMO-2 | HOMO-1/HOMO | LUMO | LUMO+1/LUMO+2 | LUMO+3 |
|---|---|---|---|---|---|---|
| LCAO |  |
 |
  |
 |
  |
 |
| MO |  |
 |
  |
 |
  |
 |
The LCAO method gave orbitals that have been displayed on the MO Diagram of BH3. Hence, 8 MO's have been selected from the Gaussian operation that correspond to said orbitals. It can be seen from the comparison table above that the MO approach gave close to identical results to the LCAO approach, with all the orbitals exhibiting D3h symmetry. Hence, computational ab inito DFT calculations are reliable and definitive conclusions can be drawn from such calculations.
An important note to include in the discusion of the MO's is the diffuse nature of the LUMO, which is intrinsic to all BR3 compounds that are considered to be Lewis acidic at such an orbital. This is further discussed in the mini project, however it should be noted here as well.
Optimisation
An optimisation operation is considered to be an attempt at localising a molecule at a global minima on a potential graph, or essentially the Morse Potential Model for an n-atomic system (n=1,2,3,..etc). Such an attempt involves the finding of steady state/stationary state derivative (gradient) of the energy value, given by the Schrodinger equation, or simply;
E(PE,KE) = V(R) + KE where [R(x);{x1,x2,x3,etc.},x:nuclear positions]
The computational approach takes on this issue by solving this time-independent Schrodinger equation, and traversing the potential energy surface where -dV/dx=F and F=0, via finding an energy value for each possible arrangement of the atoms given in the system. The data obtained from the optimisation of a BH3 molecule is given below.
---

 Item               Value     Threshold  Converged?
 Maximum Force            0.000413     0.000450     YES
 RMS     Force            0.000271     0.000300     YES
 Maximum Displacement     0.001610     0.001800     YES
 RMS     Displacement     0.001054     0.001200     YES
 Predicted change in Energy=-1.071764D-06
 Optimization completed.
    -- Stationary point found.

--- |
bh3 optimisation File Name = BH3_NBO_LOG File Type = .log Calculation Type = SP Calculation Method = RB3LYP Basis Set = 3-21G Charge = 0 Spin = Singlet E(RB3LYP) = -26.46226338 a.u. RMS Gradient Norm = a.u. Imaginary Freq = Dipole Moment = 0.0000 Debye Point Group = D3H Job cpu time: 0 days 0 hours 2 minutes 3.5 seconds. |
Shown above, is the text file obtained from the .log file of the optimised BH3 molecule, confirming that the optimisation indeed was successful, and the -dV/dx values have converged to 0. This is further confirmed below;
----------------------------
                           !   Optimized Parameters   !
                           ! (Angstroms and Degrees)  !
 --------------------------                            --------------------------
 ! Name  Definition              Value          Derivative Info.                !
 --------------------------------------------------------------------------------
 ! R1    R(1,2)                  1.1945         -DE/DX =   -0.0001              !
 ! R2    R(1,3)                  1.1945         -DE/DX =   -0.0001              !
 ! R3    R(1,4)                  1.1945         -DE/DX =   -0.0001              !
 ! A1    A(2,1,3)              120.0            -DE/DX =    0.0                 !
 ! A2    A(2,1,4)              120.0            -DE/DX =    0.0                 !
 ! A3    A(3,1,4)              120.0            -DE/DX =    0.0                 !
 ! D1    D(2,1,4,3)            180.0            -DE/DX =    0.0                 !
 --------------------------------------------------------------------------------
 GradGradGradGradGradGradGradGradGradGradGradGradGradGradGradGradGradGrad
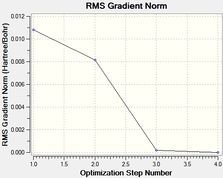
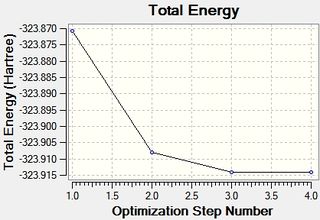
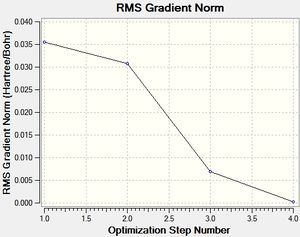
Two plots obtained from the same optimisation procedure gives further insight into the nature of the optimisation. The software optimised the molecule in 4 iterations, as shown in the optimisation/RMS plots, with the bonds shown only in the last iteration. However, it should be noted that the formation of this bond does not have a significant effect on the energy of the overall molecule, given that the optimisation and the RMS plots don't show further change from iteration 3 to iteration 4.
 |
 |
|---|
|
The optimised BH3 structure is given on the right with the ideal B-H bond distance and H-B-H bond angle shown on the molecule. This gives B-H the bond angle as 1.193 nm, which should be noted with the accuracy taken into account, so this value is Following this argument, the idealH-B-H bond angle is 120, however this value is untuitive as the optimum geometry is expected to exhibit a sp2 trigonal pyramidal structure with the bond angles as 120.
This structure is the most stable of all the possible arrangements of the system, and is expected to be observed in a solid-state phase determined by x-ray crystallography, or essentially in the gaseous phase.
Natural Bond Orbital Analysis
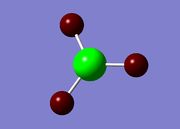
Natural Bond Orbital Analysis of a molecule can give considerable insight into the type of bonding present in a system and the extent of contributions from each atom to this bond can be discussed. Such discussions have been made in this section with respect to the hybridisation of the B-H bond and comments have been made on the nature of the bonds (whether ionic or covalent). However, the initial and the most simplest observation is the charge distribution in the molecule, arising from such bonding interactions that are going to be discussed. The charge distribution in the system is given, along with the color charge distribution, with green indicating a build-up of positive(+) charge and the red negative(-).
 |
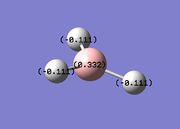 |
In BH3, B is electron deficient which is intuitive as it is a Lewis acid, which is accounted in the figure by a positive (+) value for Boron (+0.332), and incidentally a negative (-) build-up of charge on the hydrogen. These are effectively the NBO charges for the system, distinguished from Mulliken charges and discussed below. The NBO charges obtained from the .log[1] file are given;
Summary of Natural Population Analysis:

                                       Natural Population
                Natural  -----------------------------------------------
    Atom  No    Charge         Core      Valence    Rydberg      Total
 -----------------------------------------------------------------------
      B    1    0.33161      1.99903     2.66935    0.00000     4.66839
      H    2   -0.11054      0.00000     1.11021    0.00032     1.11054
      H    3   -0.11054      0.00000     1.11021    0.00032     1.11054
      H    4   -0.11054      0.00000     1.11021    0.00032     1.11054
 =======================================================================
The reason why NBO charges are preferred over Mulliken in this case can be discussed. Mulliken population analysis in contrast to natural bond population analysis is the calculation of partial atomic charges in a given system by evaluating the overlap of the atomic orbital via the LCAO approach. NBO approach takes up the MO's as default energies, and since the MO approach is under investigation in this particular study, NBO method is preferred.
The NBO population analysis of BH3 is given below;
(Occupancy)   Bond orbital/ Coefficients/ Hybrids
 ---------------------------------------------------------------------------------
     1. (1.99853) BD ( 1) B   1 - H   2
                ( 44.48%)   0.6669* B   1 s( 33.33%)p 2.00( 66.67%)
                                            0.0000  0.5774  0.0000  0.0000  0.0000
                                            0.8165  0.0000  0.0000  0.0000
                ( 55.52%)   0.7451* H   2 s(100.00%)
                                            1.0000  0.0000
     2. (1.99853) BD ( 1) B   1 - H   3
                ( 44.48%)   0.6669* B   1 s( 33.33%)p 2.00( 66.67%)
                                            0.0000  0.5774  0.0000  0.7071  0.0000
                                           -0.4082  0.0000  0.0000  0.0000
                ( 55.52%)   0.7451* H   3 s(100.00%)
                                            1.0000  0.0000
     3. (1.99853) BD ( 1) B   1 - H   4
                ( 44.48%)   0.6669* B   1 s( 33.33%)p 2.00( 66.67%)
                                            0.0000  0.5774  0.0000 -0.7071  0.0000
                                           -0.4082  0.0000  0.0000  0.0000
                ( 55.52%)   0.7451* H   4 s(100.00%)
                                            1.0000  0.0000
     4. (1.99903) CR ( 1) B   1           s(100.00%)
                                            1.0000  0.0000  0.0000  0.0000  0.0000
                                            0.0000  0.0000  0.0000  0.0000
     5. (0.00000) LP*( 1) B   1           s(100.00%)
     6. (0.00000) RY*( 1) B   1           s(  0.00%)p 1.00(100.00%)
The NBO analysis gives 4 notable features that are relevent for discussion. However, it should be noted priorly that such features should not be taken as a basis for a definitive conclusion, as it is best to make use of other methods. This is seen in the analysis of the file, and a full explanation for some features can not be given.
The first 3 bonds are given as the B-H bonds(between B and H2, B and H3, and B and H4 respectively for 1, 2, 3), with each bonds displaying sp2 hybridisation, {"s( 33.33%)p 2.00( 66.67%)"}. Moreover, the contributions of each atom is given, indicating 44% of the sp2 comes from the boron atom, and 55% comes from the hydrogen atom, proving the covalency of the bond. Number 4 is the core Boron 1sAO which was shown as non-bonding in the MO diagram, which leads to no mixing of the orbital, hence giving the hybrid character as 100% s.
Number 4 can not be explained, which is the basis for the aforementioned argument that some of these features are not realistic. It indicates the location of a possible lone pair in the system (LP*), if it were to exist. Since it doesn't, this datum has no foundation. However, it is possible that it refers to the sigma antibonding LUMO+3, which is explained further in the summary segment of NBO analysis.
Number 6 defines the non-bonding LUMO in the MO diagram. The unoccupied out-of-plane 2pz is confirmed by the expression ["s( 0.00%)p 1.00(100.00%)"].
Below is the perturbation analysis for the molecule, which represents the secondary orbital interactions that may be present, such as a lone pair donation into an antibonding orbital, ie resonance. A secondary orbital interaction worth analysing would preferrably have a stabilising energy of ~10 a.u.. This is not observed here, as the hydrogen fragment orbitals can only contribute an s orbital. However, this phenomena has been observed in BR3 systems with the R groups having readily-donatable lone pairs, such as halides. This is discussed in depth in the mini project.
None exceeding thresholds


 Second Order Perturbation Theory Analysis of Fock Matrix in NBO Basis
     Threshold for printing:   0.50 kcal/mol
                                                                              E(2)  E(j)-E(i) F(i,j)
         Donor NBO (i)                     Acceptor NBO (j)                 kcal/mol   a.u.    a.u.


---
The summary segment in the NBO .log file completes the analysis by giving the occupancies and energies of the bond. The combined data from the whole NBO analysis effectively gives enough parameters to build an MO diagram and explain it. Moreover, the energy for the unexplained LP* in the hybridisation section definitively gives it as the LUMO+3 as it is higher than the LUMO (2pz). However, this still doesn't account for the 100%s character, so overall this gives an unexplained parameter. The populations of the 3 bonds are all given as ~2(1.99), confirming the MO diagram and giving 6 electrons in total (3 from H3, 3 from B).
Natural Bond Orbitals (Summary):

                                                            Principal Delocalizations
           NBO                        Occupancy    Energy   (geminal,vicinal,remote)
 ====================================================================================
 Molecular unit  1  (H3B)
     1. BD (   1) B   1 - H   2          1.99853    -0.43712
     2. BD (   1) B   1 - H   3          1.99853    -0.43712
     3. BD (   1) B   1 - H   4          1.99853    -0.43712
     4. CR (   1) B   1                  1.99903    -6.64476  10(v),11(v),12(v)
     5. LP*(   1) B   1                  0.00000     0.67666
     6. RY*(   1) B   1                  0.00000     0.37177
           -------------------------------
              Total Lewis    7.99463  ( 99.9329%)
        Valence non-Lewis    0.00441  (  0.0551%)
        Rydberg non-Lewis    0.00097  (  0.0121%)
       -------------------------------
            Total unit  1    8.00000  (100.0000%)
           Charge unit  1    0.00000
Vibrational Analysis
BH3_optimisation_frequency File Name = BH3_OPTIMISATION_FREQUENCY File Type = .log Calculation Type = FREQ Calculation Method = RB3LYP Basis Set = 3-21G Charge = 0 Spin = Singlet E(RB3LYP) = -26.46226433 a.u. RMS Gradient Norm = 0.00004507 a.u. Imaginary Freq = 0 Dipole Moment = 0.0000 Debye Point Group = D3H Job cpu time: 0 days 0 hours 0 minutes 4.0 seconds. |
Step 1 is confirming whether the frequency procedure changed the optimisation or not. If the energy value differs from the post-optimisation value, this indeed means that the optimisation was not done properly and the minima achieved was only local. The summary of the frequecy .out file is given on the right;
The enery E(RB3LYP) = -26 a.u. gives an identical value to the BH3_optimisation_summary, hence the minima achieved earlier is global and is also a vibrational minima.
The frequency analysis is analogous to second derivative of V(r), and it can distinguish between stationary points, ie whether the point is a minima or a maxima. If the frequencies and incidentally d2V/dx2 show positive(+), this indicates a minima and a ground state, as this means the slope is increasing after this point. Vice versa for (-) values which indicate a tansition state.
A summary of the frequency analysis is given below. The low frequencies refer to the normal modes of the vibrations, viewing -6 vibrations out of 3N-6 degrees of freedom. These need to be close to zero as possible, aka zero frequencies, as they are the motions of the center of mass of the system and are symmetry forbidden. Such motions also have to be very small compared to symmetry allowed vibrations, which is observed.
Low frequencies ---   -0.3716   -0.0098   -0.0018   37.2444   37.9574   37.9592
Low frequencies --- 1146.0292 1204.8631 1204.8641
All large frequencies are (+), shown in table bla, hence a minimum has been achieved and this indicates the molecule is in its ground state.
| Bend-Stretch/Motion | Display | Frequency (cm-1) | Intensity | Symmetry | |
|---|---|---|---|---|---|
| Vibration 1 | Umbrella deformation | View | 1144 | 92.86 | A"2 |
| Vibration 2 | Symmetric scissoring | View | 1203 | 12.31 | E' |
| Vibration 3 | Asymmetric rocking | View | 1203 | 12.31 | E' |
| Vibration 4 | Symmetric Stretch | View | 2598 | 0.00 | A'1 |
| Vibration 5 | Asymmetric Stretch | View | 2737 | 103.74 | E' |
| Vibration 6 | Asymmetric Stretch | View | 2737 | 103.73 | E' |
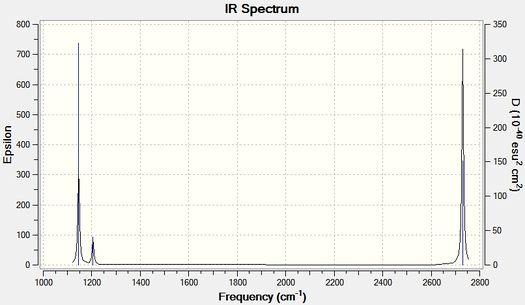
The frequencies and the intensities of the vibrational modes are obtained from Gaussview=>Results=>Vibrations. However, both of those data as well as the symmetries of the modes can be obtained from the .log file, given below.
Harmonic frequencies (cm**-1), IR intensities (KM/Mole), Raman scattering
 activities (A**4/AMU), depolarization ratios for plane and unpolarized
 incident light, reduced masses (AMU), force constants (mDyne/A),
 and normal coordinates:
                     1                      2                      3
                    A2"                    E'                     E'
 Frequencies --  1146.0292              1204.8631              1204.8641
 Red. masses --     1.2531                 1.1085                 1.1085
 Frc consts  --     0.9697                 0.9481                 0.9481
 IR Inten    --    92.6653                12.3919                12.3944
  Atom  AN      X      Y      Z        X      Y      Z        X      Y      Z
     1   5     0.00   0.00   0.16     0.00   0.10   0.00    -0.10   0.00   0.00
     2   1     0.00   0.00  -0.57     0.00   0.08   0.00     0.81   0.00   0.00
     3   1     0.00   0.00  -0.57    -0.38  -0.59   0.00     0.14   0.38   0.00
     4   1     0.00   0.00  -0.57     0.38  -0.59   0.00     0.14  -0.38   0.00
                     4                      5                      6
                    A1'                    E'                     E'
 Frequencies --  2591.6540              2730.0723              2730.0730
 Red. masses --     1.0078                 1.1260                 1.1260
 Frc consts  --     3.9883                 4.9447                 4.9447
 IR Inten    --     0.0000               103.8565               103.8497
  Atom  AN      X      Y      Z        X      Y      Z        X      Y      Z
     1   5     0.00   0.00   0.00     0.11   0.00   0.00     0.00   0.11   0.00
     2   1     0.00   0.58   0.00     0.02   0.00   0.00     0.00  -0.81   0.00
     3   1     0.50  -0.29   0.00    -0.60   0.36   0.00     0.36  -0.19   0.00
     4   1    -0.50  -0.29   0.00    -0.60  -0.36   0.00    -0.36  -0.19   0.00
Thallium Tribromide: Optimisation of a Many-Electron System
An Introduction to Pseudo-Potentials
This exercise effectively gives an introduction to pseudo-potentials, using TlBr3 which is a complex system given the many-numbered electrons and the heavy elements thallium and bromine. A pseudo-potential may be defined as an approximation made in order to simplify a complex system into a more manageable one[2]. The pseudo potentials used are as given in the exercise introduction, which is D95V on the 1st row elements and Los Alamos ECP (pseudo-potential) on heavier atoms.
Optimisation
The TlBr3 has been optimised using the pseudo-potential basis set LANL2DZ which has been described in the previous section. Point group of the compound has been set to D3h, diverging from the additional keyword "opt=loose" on the initial BH3 molecule. The point group has been constrained via setting a tight tolerance value of 0.0001, which effectively means the optimisaton procedure will alter the energy without breaking symmetry. This was observed in the optimisation of BH3, as the point group after optimisation was different than the starting point group of D3h.
|
The optimisation gives 5 iteration, which is similar and can be compared to BH3. The optimised Tl-Br angle is 2.69 A, and the Br-Tl-Br angle is given as 120.
Vibrational Analysis
The purpose of carrying out a vibrational analysis have been discussed in the BH3 section, hence no in depth reasoning will be given here. However, it can be noted again that a positive value on the vibrational modes of the compound would indicate a minimum, which would be confused with a maximum if the calculation is base purely on the first derivation of V(x)(~optimisation). Hence, the attempt is to confirm the achievement of a minimum, and to obtain reliable data on the bond strengths and the 3N-6 degrees of freedom.
Both calculations (optimisation, frequency) were run using the same Calculation Method and Basis Set, RB3LYP and LANL2DZ respectively. This is crucial since the assumptions made on the optimisation section also have to govern the frequency calculations, if not, this means one of the calculations are going to be taking into accounts some parameters that the other has not, which ultimately means different calculation methods for two operations. This can not be the case as the data will be impossible to correlate.
Hence, the consistency in the optimisation and frequency calculations were preserved, and are given below;
TlBr3 optimisation File Name = TLBR3_OPTIMISATION File Type = .log Calculation Type = FOPT Calculation Method = RB3LYP Basis Set = LANL2DZ Charge = 0 Spin = Singlet E(RB3LYP) = -91.21812851 a.u. RMS Gradient Norm = 0.00000213 a.u. Imaginary Freq = Dipole Moment = 0.0000 Debye Point Group = D3H Job cpu time: 0 days 0 hours 0 minutes 18.0 seconds. |
tlbr3 frequency File Name = tlbr3_frquency_edit File Type = .log Calculation Type = FREQ Calculation Method = RB3LYP Basis Set = LANL2DZ Charge = 0 Spin = Singlet E(RB3LYP) = -91.21812851 a.u. RMS Gradient Norm = 0.00000214 a.u. Imaginary Freq = 0 Dipole Moment = 0.0000 Debye Point Group = D3H Job cpu time: 0 days 0 hours 0 minutes 15.0 seconds. |
No energy change indicates that the frequency operation did not change the geometry, and the initial geometry is the ground state.
The normal modes of the molecule are given below;
Low frequencies ---   -3.3625   -0.0026   -0.0004    0.0016    3.9880    3.9880
Low frequencies ---   46.4331   46.4334   52.1513
These show small values compared to symmetry allowed vibaritons, which is ideal, as discussed earlier in the BH3 section. Moreover, however negative, they are close to zero, since they are the motion of the CoM. The 6 vibrational modes displayed in the spectrum have been tabulated and are given below;
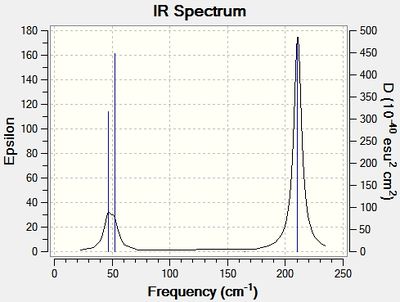
| bond-stretch/motion | display | frequency (cm-1) | intensity | symmetry | |
|---|---|---|---|---|---|
| Vibration 1 | Symmetric scissoring | View | 46 | 3.68 | E' |
| Vibration 2 | Asymmetric rocking | View | 46 | 3.68 | E' |
| Vibration 3 | Umbrella deformation | View | 52 | 5.84 | A"2 |
| Vibration 4 | Symmetric stretch | View | 165 | 0.00 | A'1 |
| Vibration 5 | Asymmetric stretch | View | 210 | 25.48 | E' |
| Vibration 6 | Asymmetric stretch | View | 210 | 25.48 | E' |
What is a bond? How does Gaussview view bonds?
A bond can be defined as an extent of interaction between two or more atoms that is non-varying/constant when the atoms lie at the bottom of a potential well. It effectively shows a zero-force scenario where neither atom is experiencing a pull or push arising from a positive or negative potential energy. The concept of a bond is merely visual, as it really only is electron density merging the orbitals together and bringing close the nuclei, if not a simple Coulombic attraction.
In Gaussview, a bond is mainly a pre-defined scenario where the bond lengths have been set from empirical data, hence they are only shown when the distance between given atoms meets this pre-set length requirement. However, this does not necessarily account for the existence of an interaction, as this implicitly means if a bond is elongated or compressed Gaussview will not recognize it and it will not be acknowledged in the display.
Isomerism in Molybdenum: [Mo(CO)4L2]
1st Optimisation
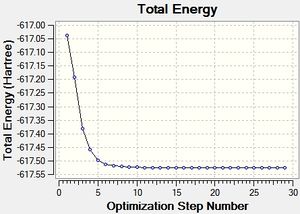
Several optimisations were carried out on the two isomers. The first optimisation follows the usage of the LANL2MB basis set, taking into account pre-set definitions of the geometry without having made any specific modicitaions to the structure. Hence this is an "as is" type of optimisation, where the molecule has just been drawn and optimised straight after.
| cis [3] | trans [4] |
|---|---|
Item               Value     Threshold  Converged?
 Maximum Force            0.000051     0.002500     YES
 RMS     Force            0.000012     0.001667     YES
 Maximum Displacement     0.007680     0.010000     YES
 RMS     Displacement     0.001493     0.006667     YES
 Predicted change in Energy=-5.688377D-08
 Optimization completed.
    -- Stationary point found.
|
Item               Value     Threshold  Converged?
 Maximum Force            0.000187     0.002500     YES
 RMS     Force            0.000056     0.001667     YES
 Maximum Displacement     0.003593     0.010000     YES
 RMS     Displacement     0.001019     0.006667     YES
 Predicted change in Energy=-6.645310D-07
 Optimization completed.
    -- Stationary point found.
|
 |
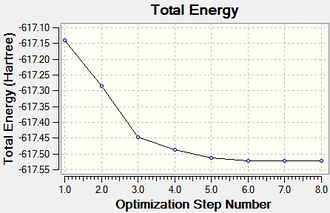 |
MOcisoptimisation File Name = MO_cis_optimised File Type = .log Calculation Type = FOPT Calculation Method = RB3LYP Basis Set = LANL2MB Charge = 0 Spin = Singlet E(RB3LYP) = -617.52510206 a.u. RMS Gradient Norm = 0.00001202 a.u. Imaginary Freq = Dipole Moment = 8.6299 Debye Point Group = C1 Job cpu time: 0 days 0 hours 26 minutes 10.8 seconds. |
MOtransoptimisation File Name = MO_trans_optimised File Type = .log Calculation Type = FOPT Calculation Method = RB3LYP Basis Set = LANL2MB Charge = 0 Spin = Singlet E(RB3LYP) = -617.52204987 a.u. RMS Gradient Norm = 0.00006186 a.u. Imaginary Freq = Dipole Moment = 0.0000 Debye Point Group = C1 Job cpu time: 0 days 0 hours 7 minutes 53.7 seconds. |
Dihedral Optimisation
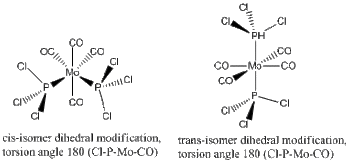
The second optimisation has been run using a LAN2DZ basis set, putting focus into the dihedral angles between the neighbouring ligands, mainly those surrounding each PCl3 ligand in the metal complex. This is assuming that the first optimisation has failed to take the dihedral angle/torsion parameter into account, and instead of a global minima, gave a local one that is not necessarily a vibrational minima. This observation was confirmed again and again as the final frequency analysis gave vibrational modes that were large in magnitude and negative (-).
The dihedral modification made on each isomer is given on the diagram, showing a dihedral Cl-P-Mo-CO angle of 0 for both isomers. These modified dihedral values have been shown on the View -cis/-trans links given below;
| cis[5] | trans[6] |
|---|---|
Item               Value     Threshold  Converged?
 Maximum Force            0.000011     0.000450     YES
 RMS     Force            0.000004     0.000300     YES
 Maximum Displacement     0.001794     0.001800     YES
 RMS     Displacement     0.000452     0.001200     YES
 Predicted change in Energy=-4.446618D-09
 Optimization completed.
    -- Stationary point found.
|
Item               Value     Threshold  Converged?
 Maximum Force            0.000075     0.000450     YES
 RMS     Force            0.000022     0.000300     YES
 Maximum Displacement     0.001323     0.001800     YES
 RMS     Displacement     0.000220     0.001200     YES
 Predicted change in Energy=-9.553179D-08
 Optimization completed.
    -- Stationary point found.
|
MOcisdihedraloptimisation File Name = MO_cis_dihedral_optimisation File Type = .log Calculation Type = FOPT Calculation Method = RB3LYP Basis Set = LANL2DZ Charge = 0 Spin = Singlet E(RB3LYP) = -623.57707195 a.u. RMS Gradient Norm = 0.00000423 a.u. Imaginary Freq = Dipole Moment = 1.3099 Debye Point Group = C1 Job cpu time: 0 days 1 hours 3 minutes 46.5 seconds. |
MOtransdihedraloptimisation File Name = MO_trans_dihedral_optimisation File Type = .log Calculation Type = FOPT Calculation Method = RB3LYP Basis Set = LANL2DZ Charge = 0 Spin = Singlet E(RB3LYP) = -623.57603096 a.u. RMS Gradient Norm = 0.00003482 a.u. Imaginary Freq = Dipole Moment = 0.3055 Debye Point Group = C1 Job cpu time: 0 days 0 hours 44 minutes 30.3 seconds. |
Extrabasis Set: 3rd Optimisation
The optional optimisation includes an extrabasis set that accounts for the d,p orbitals and their interactions in the metal complex. It is optional, however it is crucial since such d,p orbital interactions are vital when analysing metal-ligand complexes given they play an important role in many aspects of the molecule i.e crystal field theory, Jahn-Teller distortions, spin, ...etc.
CIS_OPTIONAL_OPTIMISATION[7]
Item               Value     Threshold  Converged?
 Maximum Force            0.000140     0.000450     YES
 RMS     Force            0.000045     0.000300     YES
 Maximum Displacement     0.001256     0.001800     YES
 RMS     Displacement     0.000424     0.001200     YES
 Predicted change in Energy=-2.413017D-07
 Optimization completed.
    -- Stationary point found.
                           ----------------------------
                           !   Optimized Parameters   !
                           ! (Angstroms and Degrees)  !
 --------------------------                            --------------------------
 ! Name  Definition              Value          Derivative Info.                !
 --------------------------------------------------------------------------------
 ! R1    R(1,2)                  2.0547         -DE/DX =    0.0                 !
 ! R2    R(1,3)                  2.0207         -DE/DX =    0.0                 !
 ! R3    R(1,4)                  2.0547         -DE/DX =    0.0                 !
 ! R4    R(1,8)                  2.4761         -DE/DX =    0.0                 !
 ! R5    R(1,12)                 2.4761         -DE/DX =    0.0                 !
TRANS_OPTIONAL_OPTIMISATION[8]
Item               Value     Threshold  Converged?
 Maximum Force            0.000023     0.000450     YES
 RMS     Force            0.000008     0.000300     YES
 Maximum Displacement     0.001700     0.001800     YES
 RMS     Displacement     0.000381     0.001200     YES
 Predicted change in Energy=-2.697133D-08
 Optimization completed.
    -- Stationary point found.
                           ----------------------------
                           !   Optimized Parameters   !
                           ! (Angstroms and Degrees)  !
 --------------------------                            --------------------------
 ! Name  Definition              Value          Derivative Info.                !
 --------------------------------------------------------------------------------
 ! R1    R(1,2)                  2.057          -DE/DX =    0.0                 !
 ! R2    R(1,3)                  2.0574         -DE/DX =    0.0                 !
 ! R3    R(1,4)                  2.0559         -DE/DX =    0.0                 !
 ! R4    R(1,5)                  2.057          -DE/DX =    0.0                 !
 ! R5    R(1,10)                 2.4222         -DE/DX =    0.0                 !
Optimisation Analysis
An overall analysis of the 3 optimisations in terms of the calculation parameters have been tabulated and given below. Each optimisation output value ratio shows consistency within the isomers, given that the inputs ie. calculation method/basis set/point group have been pre-set to be the same.
| 1st optimisation | 2nd Optimisation
(Dihedral Modification) |
3rd Optimisation
(Extrabasis set) | ||||
|---|---|---|---|---|---|---|
| cis | trans | cis | trans | cis | trans | |
| Calculation Type | FOPT | |||||
| Calculation Method | RB3LYP | |||||
| Point Group | C1 | |||||
| Basis Set | LANL2MB | LANL2DZ | Gen | |||
| E(RB3LYP) (in a.u.) | -617.5251 | -617.5220 | -623.5770 | -623.5760 | -623.6929 | -623.6941 |
| RMS Gradient Norm (in a.u.) | 0.000 | 0.000 | 0.000 | 0.000 | 0.000 | 0.000 |
| Dipole Moment (in debye) | 8.62 | 0.000 | 1.30 | 0.30 | 0.07 | 0.22 |
| Mo-P bond length (in Angstroms) | 2.53 | 2.48 | 2.51 | 2.44 | 2.48 | 2.42 |
| P-Cl Bond length (in Angstroms) | 2.41 | 2.40 | 2.24 | 2.24 | 2.11 | 2.12 |
| Dihedral angle (Cl-P-Mo-CO) | given in dihedral table | |||||
| displat parameters/geometry | ||||||
The pronounced effect of further optimising the complex can be seen on the table. Upon analysis, it is important to put focus on the bond parameters that change from optimisaiton 1 to 3 {P-Mo, Cl-P} and how these affect the overall energy value, E(RB3LYP) ina.u./Hartrees. It should be noted that the computed energy value is no basis for a comparison between the computational and empirical data. These energies will only be used to compare to two isomers in a given set of optimisation. However, bond lengths and angles and dipoles can indeed be related to one another, as these parameters will form the basis of any comparison between geometries obtained from different optimisations.
The computational bond lengths will be compared with literature. The Mo-P literature bond length[9] for the cis isomer is given as 2.58 A, which is a significant discrepancy, which might or might not correspond to a fault in the system. The values are reliable, given the three successful optimisations done on the geometry. Hence, Gaussian might very well be giving a more accurate result, indicating the possible strength of the Mo-P bond in the complex. A similar discrepancy is also seen in the P-Cl bond, where the literature value gives a bond length of 1.83, which is shorter than the Gaussian result, which is 2.11 Angstrom. The two discrepancies show evidently opposite differences, with Gaussian impying a stronger(shorter) Mo-P bond and a weaker(longer) P-Cl bond. Intuitively, this indicates back-bonding from the Mo d orbitals into the P-Cl sigma antibonding, which would effectively confirm the weaker P-cl and stronger Mo-P bond. The extrabasis optimisation highlights this effect in the geometry, and thus it can be said that the existence of d-orbitals play an important role in this discrepancy, confirming the back-bonding hypothesis. A similar effect is observed for the literature and Gaussian Mo-P bond lengths for the trans complex, in which literature[10] states 2.37 A, and Gaussian gave a value of 2.42, a weaker bond length, which indicates the Mo d-overlap of the P bonds are on the same d-orbital and back-bonding is not focused on one P-Cl sigma antibonding orbital.
The extrabasis energy difference of the isomers have been calculated, using
1 Hartree (a.u.) = 2625.5 kJ/mol
The difference in Hartrees trans-cis is given as -0.0012 a.u., which upon conversion gives 3.1506 kJ/mol. This is a small energy difference, nevertheless it gives the stable isomer as the trans one. Hence, interconversion can be expected to happen at room temperature. This is further discussed in the frequency analysis
Frequency Analysis
Frequency analysis was carried out for both the optional extrabasis set and the dihedral modified and optimised geometry of -cis and -trans complexes. The Dspace links have been provided, however only the extrabasis data will be analysed.
The vibrational analysis gave negative (-) vibrational modes several times before the geometries of the isomers were optimised. Once done, the following zero-frequencies have been obtained;
cis
Low frequencies --- -1.3165 -0.0005 -0.0004 -0.0003 0.7729 1.9347
trans
Low frequencies --- -2.2459 -1.6466 -0.0002 0.0003 0.0006 2.8863
They are close to zero, and comparably smaller in magnitude than the symmetry allowed vibrations. Moreover, the summary file shows no difference in energy compared to the summary of the extrabasis optimisation, which is -623 a.u.. These indicate that the frequency analysis was done correctly, and the data given are reliable within the limits of computational method, which is mainly accounted for by the anharmonic discrepancy.
The results are given below;
| Bond Motion/Bond | cis-Isomer | trans-Isomer | ||||||||
|---|---|---|---|---|---|---|---|---|---|---|
| Non-extrabasis[11] | extrabasis[12] | Display Motion for Extrabasis | Non-extrabasis[13] | extrabasis[14] | Display Motion for Extrabasis | |||||
| Frequency (cm-1) | Intensity | Frequency (cm-1) | Intensity | Frequency (cm-1) | Intensity | Frequency (cm-1) | Intensity | |||
| Vibration 1 | - | - | *11, 20 | 0.00 | View | - | - | *4 | 0.09 | View |
| Vibration 2 | - | - | 269 | 30.41 | View | - | - | *6 | 0.00 | View |
| Vibration 3 | - | - | 443 | 335.25 | View | - | - | 251 | 37.59 | View |
| Vibration 4 | - | - | 567 | 114.45 | View | - | - | 408 | 727.70 | View |
| Vibration 5 | - | - | 1938 | 1605.02 | View | - | - | 603 | 138.36 | View |
| Vibration 6 | - | - | 2019 | 544.65 | View | - | - | 1950 | 1475.40 | View |
| IR Spectrum
(for extrabasis) |
 |
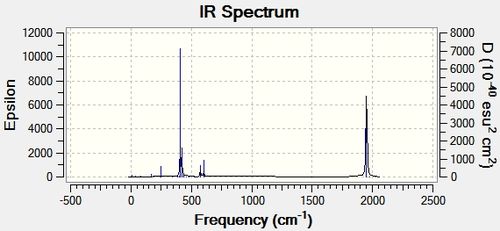 | ||||||||
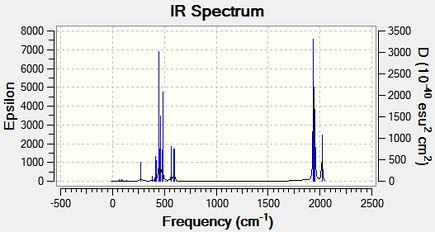
The vibrational modes have been selected based on their intensities, and they have been commented on. For distinguishing between the isomers it is probably preferrable to focus on the CO stretches in the complex, since group theory predicts different splitting in vibrational -C=O modes of the isomers, which arises from the different positions of the ligands therefore affecting a parameter in the system analogous to the J-coupling in NMR analysis. However, this splitting can be observed in the spectra also given in the table, hence not all the -CO stretches have been tabulated.
The -cis IR spectrum shows multiple peaks around the region >1500 cm-1, whereas the -trans spectrum shows only a single peak associated with a CO stretch. This is expected, and is due to the aforementioned splitting of the stretches based on the positions of the heteroligands PR3.
The selected stretches from the spectra have been tabulated and the animations displayed, however the analysis will put more focus on the zero-frequency modes of the system, as it is believed that these modes will be the first to get excited upon the input of energy, mainly thermal. The * signed frequencies in the table correspond mainly to the rotational movement of the PCl3 groups, as do most of the negative frequencies obtained via a failed optimisation. This shows that the zero-frequencies, ie the lowest vibrational modes, belong to these ligands, and can eaily be thermally excited, even at room temperature. Even though the energies of the isomers gives no significant difference, this is believed to be the reason why both isomers are found at low temperature. The interconversion is made easy via the low-frequency modes of the PCl3 groups.
This interconversion can essentially be limited via putting strain in the low-frequency vibrational modes, such as changing the PR3 ligand from R=Cl into a strained group, such as triphenyl phoshphine derivative, or even TOP (trioctylphosphine).
Miniproject: Effect of Halide-Substituents (R) on the Lewis Aciditiy of BR3 Systems
"A Computational Analysis of the Bonding in Boron Trifluoride and Boron Trichloride and Their Complexes with Ammonia"
Outline: Lewis Acidity of Boron Trihalides: BF3
The substituent effect of halides on the Lewis acidity was studied[15]. This effect is long-known to be counter-intuitive, as the Lewis acidity of the boron LUMO increases going down Group 7, which opposes the electronegativity trend. The Lewis acidity of the boron trihalide system increases as BF3<BCl3<BBr3.[16][17][18][19][20][21]. It was found that the biggest difference of Lewis acidity is between BF3 and BCl3, hence this is studied. Several explanations have been proposed including an effective lone pair donation from Fluorine compared to other halogen due to a better orbital overlap. This effect is also studied using second order perturbation analysis, discussed more in depth in the analysis.
Another explanation is given as the compatibility of the planar sp2 stucture to the conversion from a planar to a pyramidal geometry. This explanation was not tested, as an accurate correlation diagram is beyond the reach of this analysis. Most focsu was put on NBO and second order perturabtion analysis, giving an alternative explanation for the trend.
MO's have been calculated and displayed, and frequency analysis given.
MO Analysis of BF3
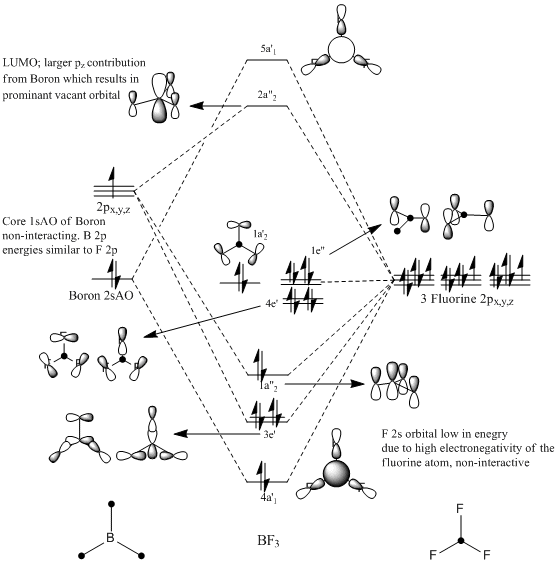
An Mo diagram of BF3 has been drawn from LCAO first principles, acounting for the BR3 and F3 fragments. The diagram can be compared to the initial BH3 diagram given in the first section, however similarities are vague since the F3 fragment has non-bonding 2sAO and uses the 2p orbitals to bond. This results in an inherently complex diagram, and literature was found[22]. The diagram is given on the right.
Special attention should be drawn to the LUMO of the molecule, as compare and contrast will be made with respect to the energies and the MO's of the adducts BF3.NH3 and BCl3.NH3. The LUMO arises from an out-of-phase anti-bonding interaction between the out-of-plane Bo2on 2pz and the in-phase F3 sigma bonding fragment. This gives a large contibution from the B p orbital, due to untuition from splitting energies. Moreover, this orbital was calculated and shown to be more diffuse than the rest of the MO's. This is an important feature to point out, as this is the orbital that is the pair-acceptor in the formation of a Lewis adduct.
The rest of the mixing orbitals are given on the diagram and their symmetries checked with the reduction formulae and compared with literature. The LCAO approach has been compared with the ab inito Gaussian approach, and is given further below.
Prior to the MP2 ab initio calculations, the BF3 molecule has been optimised using the method and basis set taken from the literature paper.
Calculation Method = RMP2-FC Basis Set = 6-31+G(2d,p) |
All calculations have been run using these parameters, also given in the summary files. The relevant optimisation files for the optimisation of the BF3 molecule have been given below;
Optimisation of BF3
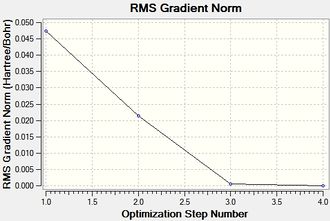
The convergence, optimisation and RMS gradient plots have been tabulated below.
|
The similarities between the optimisations of BF3 and BH3 are evident. This was somewhat expected, as only the atom type has changed. However the point groups are the same, D3h, and incidentally the dipole moment along with the spin,charge etc.
The summary file is given below, and the energy should be noted, as this energy will be compared with the optimisation energy of the BCl3 molecule. Moreover, the bond length and angles have been displayed on the jmol, which is given on the right.
BF3 optimisation File Name = BF3_optimisation File Type = .log Calculation Type = FOPT Calculation Method = RMP2-FC Basis Set = 6-31+G(2d,p) Charge = 0 Spin = Singlet E(MP2) = -323.87073494 a.u. RMS Gradient Norm = 0.04744280 a.u. Imaginary Freq = Dipole Moment = 0.0000 Debye Point Group = D3H Job cpu time: 0 days 0 hours 1 minutes 13.5 seconds. |
Gaussian MO/NBO Analysis
MO/NBO calculations have been run on the molecule in the same fashion as the BH3 calculations using the MP2/6-31+g(2d,p) method and basis set. The MO's shown on the LCAO MO diagram have been displayed below as Gaussian MO's. The energies have been given in the comparison table BF3 vs. BCl3, which is given further below in the analysis.
| homo-8 | homo-7/homo-6 | homo-5 | homo-4/homo-3 | homo-2/homo-1 | homo | lumo | lumo+1 |
|---|---|---|---|---|---|---|---|
 |
  |
 |
  |
  |
 |
 |
 |
| 4a'1 | 3e' | 1a"2 | 4e' | 1e" | 1a'2 | 2a"2 | 5a'1 |
As it was in the analysis of the MO diagram, most focus will be put on the LUMO and LUMO+1 orbitals. It is seen that these orbitals are considerably more diffuse than the HOMO's, especially the LUMO+1 orbital with the anti-bonding 2sAO spreading over the entire molecule leaving the out-of-phase F3 2p orbitals as only node "gaps" within the MO. This is due to the significant energy difference between the F3 and the LUMO+1, which basically means most of the contribution comes from the Boron sAO. This is also shown in the literature MO diagram, linked in the previous section. The LUMO shows a similarly diffusive orbital, which again causes the Lewis acidity of the boron trihalide. However, this diffuse nature is greater in magnitude compared to the BH3 LUMO, which can be stated as the substitution effect of the halides due to a higher electronegativity giving FO's that are lower down in energy and further away from the LUMO.
NBO Analysis
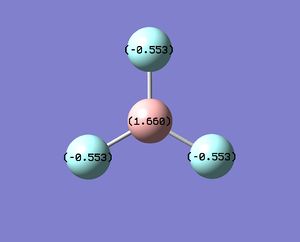
The charge distribution of the molecule has been displayed. This gives an intuitive result, as the B is expected to have much more positive(+) charge build-up due to the electronegative fluorine atoms. Morover, this bond is possibly ionic, which is given in the occupancy/hybrid file below.
-----
(Occupancy)   Bond orbital/ Coefficients/ Hybrids
 ---------------------------------------------------------------------------------
     1. (1.99701) BD ( 1) B   1 - F   2
                ( 16.30%)   0.4037* B   1 s( 33.25%)p 1.98( 65.87%)d 0.03(  0.88%)
                                            0.0000 -0.5766 -0.0038  0.0000  0.0000
                                            0.0000  0.0000  0.0000  0.0000 -0.8110
                                           -0.0294  0.0052  0.0000  0.0000  0.0000
                                            0.0000  0.0000  0.0000  0.0000  0.0000
                                            0.0000  0.0893  0.0013  0.0180 -0.0232
                ( 83.70%)   0.9149* F   2 s( 38.74%)p 1.58( 61.09%)d 0.00(  0.17%)
                                            0.0000 -0.6223 -0.0151 -0.0017 -0.0006
                                            0.0000  0.0000  0.0000  0.0000  0.7816
                                           -0.0081  0.0029  0.0000  0.0000  0.0000
                                            0.0000  0.0000  0.0000  0.0000  0.0000
                                            0.0000  0.0347  0.0091  0.0183  0.0058
The first three 1-3 features give the three bonding B-F modes and as expected, they are identical. It is confirmed that the bond is essentialy ionic, as 83.70% of the bond contribution (electron density) is on the fluorine atom, and only 16.30% is on boron. Moreover, the Boron is sp2 hybridised, with only a slight deviation as the inclusion of the d orbita in the hybridisation leaves the s-p characters out of proportion. This can be neglected, as it is likely to be caused by the (2d,p) value in the basis set. This is shown again in the fluorine atom, as it is ideally sp2 hybridised taking into account the 2 pairs and the 1 bonding electron shown in the MO diagram.
Features 4 and 5,6,7 give the core non-bonding orbitals of Boron 1sAO and three F 2sAO's respectively.
4. (1.99996) CR ( 1) B   1           s(100.00%)
                                            1.0000  0.0000  0.0000  0.0000  0.0000
                                            0.0000  0.0000  0.0000  0.0000  0.0000
                                            0.0000  0.0000  0.0000  0.0000  0.0000
                                            0.0000  0.0000  0.0000  0.0000  0.0000
                                            0.0000  0.0000  0.0000  0.0000  0.0000
     5. (1.99995) CR ( 1) F   2           s(100.00%)
                                            1.0000  0.0001  0.0000  0.0000  0.0000
                                            0.0000  0.0000  0.0000  0.0000  0.0001
                                            0.0000  0.0000  0.0000  0.0000  0.0000
                                            0.0000  0.0000  0.0000  0.0000  0.0000
                                            0.0000  0.0000  0.0000  0.0000  0.0000
Feature 8 highlights the Boron LUMO, as a p hybrid which is again expected.
8. (0.23800) LP*( 1) B   1           s(  0.00%)p 1.00(100.00%)
                                            0.0000  0.0000  0.0000  0.0000  0.0000
                                            0.0000  0.0000  0.0000  0.0000  0.0000
                                            0.0000  0.0000  0.9990 -0.0420  0.0160
                                            0.0000  0.0000  0.0000  0.0000  0.0000
                                            0.0000  0.0000  0.0000  0.0000  0.0000
The second order perturbation will be analysed, as it is believed that the halide effect comes into the picture as an interaction between a lone pair and a non-bonding yet mixed orbital. Hence, the hypothesis stating the reason for the halide effect is caused by lone pair donation into non-bonding Boron p orbital is studied.
 Second Order Perturbation Theory Analysis of Fock Matrix in NBO Basis

     Threshold for printing:   0.50 kcal/mol
                                                                              E(2)  E(j)-E(i) F(i,j)
         Donor NBO (i)                     Acceptor NBO (j)                 kcal/mol   a.u.    a.u.
 ===================================================================================================

 within unit  1
   9. LP (   1) F   2                / 18. RY*(   1) B   1                    6.15    2.58    0.113
  10. LP (   2) F   2                / 99. BD*(   1) B   1 - F   3           14.10    1.39    0.125
  10. LP (   2) F   2                /100. BD*(   1) B   1 - F   4           14.10    1.39    0.125
  11. LP (   3) F   2                /  8. LP*(   1) B   1                   51.39    0.80    0.188
  13. LP (   2) F   3                / 98. BD*(   1) B   1 - F   2           14.10    1.39    0.125
  13. LP (   2) F   3                /100. BD*(   1) B   1 - F   4           14.10    1.39    0.125
  14. LP (   3) F   3                /  8. LP*(   1) B   1                   51.39    0.80    0.188
  16. LP (   2) F   4                / 98. BD*(   1) B   1 - F   2           14.10    1.39    0.125
  16. LP (   2) F   4                / 99. BD*(   1) B   1 - F   3           14.10    1.39    0.125
  17. LP (   3) F   4                /  8. LP*(   1) B   1                   51.39    0.80    0.188
Interactions with stabilisation energies >5kcal/mol have been displayed. Two type of interactions can be isolated, a lone pair donation from a fluorine atom into the other two anti-bonding B-F bonds (stabilisation energy of 14 kcal/mol), and another lone pair donation into the vacant Boron p, LUMO (stabilisation energy, 51 kcal/mol). This proves that the halides indeed stabilise the non-bonding Boron orbital, however the trend can only be explained by comparing this stabilisation with other halides.
Comparing BF3 and BCl3
Optimisation BCl3
|
Optimisation of BCL3 has been carried out using the same basis sets, the convergence files checked to confirm optimisation. DSpace links have been provided.[24]
The summary file for the optimisation is given below. The significant energy difference compared to BH3 and BF3 is noted. An attempt to explain this extra stabilisation energy is made, as it is believed that this is a promising first step in explaining the unusual trend in Lewis acidity of the boron trihalides.
BCl3 optimisation
File Name = BCl3_optimisation
File Type = .log
Calculation Type = FOPT
Calculation Method = RMP2-FC
Basis Set = 6-31+G(2d,p)
Charge = 0
Spin = Singlet
E(MP2) = -1403.79028530 a.u.
RMS Gradient Norm = 0.00007316 a.u.
Imaginary Freq =
Dipole Moment = 0.0000 Debye
Point Group = D3H
Job cpu time:  0 days  0 hours  1 minutes 21.2 seconds.
BCl3 NBO Analysis
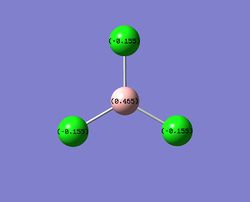
The NBO gave a charge distribution that is intuitive, which goes against the trend that is trying to be explained. The BCl3 molecule is supposed to give a better Lewis acid, which would be expected to have the boron as a more electron-deficient center. However the charge differences between the molecular only gives what is expected from the electronegativities of the halide substituents. Hence, the B-Cl bond is predicted to have more covalent character than B-F. However, the NBO analysis does not give similar features to that of the BF3 molecule, hence this will be analysed. The NBO analysis is given below[25];
------

 (Occupancy)   Bond orbital/ Coefficients/ Hybrids
 ---------------------------------------------------------------------------------
     1. (1.99549) BD ( 1) B   1 -Cl   2
                ( 32.65%)   0.5714* B   1 s( 33.27%)p 2.00( 66.39%)d 0.01(  0.34%)
                                            0.0000 -0.5768  0.0035  0.0000  0.0000
                                            0.0000  0.0000  0.0000  0.0000 -0.8128
                                           -0.0565  0.0087  0.0000  0.0000  0.0000
                                            0.0000  0.0000  0.0000  0.0000  0.0000
                                            0.0000  0.0528  0.0042  0.0242  0.0062
                ( 67.35%)   0.8206*Cl   2 s( 27.03%)p 2.66( 71.97%)d 0.04(  1.00%)
                                            0.0000  0.0000 -0.5198  0.0071 -0.0069
                                           -0.0001  0.0002  0.0000  0.0000  0.0000
                                            0.0000  0.0000  0.8483 -0.0102 -0.0032
                                            0.0000  0.0000  0.0000  0.0000  0.0000
                                            0.0000  0.0000  0.0000  0.0000  0.0000
                                            0.0888  0.0010  0.0459  0.0012
     2. (1.99958) BD ( 1) B   1 -Cl   3
                (  7.67%)   0.2769* B   1 s(  0.00%)p 1.00( 98.37%)d 0.02(  1.63%)
                                            0.0000  0.0000  0.0000  0.0000  0.0000
                                            0.0000  0.0000  0.0000  0.0000  0.0000
                                            0.0000  0.0000  0.9862 -0.1029  0.0232
                                            0.0000  0.0000 -0.1104  0.0059 -0.0637
                                            0.0034  0.0000  0.0000  0.0000  0.0000
                ( 92.33%)   0.9609*Cl   3 s(  0.00%)p 1.00( 99.76%)d 0.00(  0.24%)
                                            0.0000  0.0000  0.0000  0.0000  0.0000
                                            0.0000  0.0000  0.0000  0.0000  0.0000
                                            0.0000  0.0000  0.0000  0.0000  0.0000
                                            0.0000  0.9988  0.0050  0.0006  0.0000
                                            0.0000  0.0421 -0.0017  0.0243 -0.0010
                                            0.0000  0.0000  0.0000  0.0000
     3. (1.99549) BD ( 2) B   1 -Cl   3
                ( 32.65%)   0.5714* B   1 s( 33.27%)p 2.00( 66.39%)d 0.01(  0.34%)
                                            0.0000  0.5768 -0.0035  0.0000  0.0000
                                            0.0000 -0.7039 -0.0489  0.0075 -0.4064
                                           -0.0282  0.0043  0.0000  0.0000  0.0000
                                            0.0457  0.0037  0.0000  0.0000  0.0000
                                            0.0000  0.0264  0.0021 -0.0242 -0.0062
                ( 67.35%)   0.8206*Cl   3 s( 27.03%)p 2.66( 71.97%)d 0.04(  1.00%)
                                            0.0000  0.0000  0.5198 -0.0071  0.0069
                                            0.0001 -0.0002  0.0000  0.7346 -0.0088
                                           -0.0027  0.0000  0.4241 -0.0051 -0.0016
                                            0.0000  0.0000  0.0000  0.0000  0.0769
                                            0.0008  0.0000  0.0000  0.0000  0.0000
                                            0.0444  0.0005 -0.0459 -0.0012
     4. (1.99549) BD ( 1) B   1 -Cl   4
                ( 32.65%)   0.5714* B   1 s( 33.27%)p 2.00( 66.39%)d 0.01(  0.34%)
                                            0.0000  0.5768 -0.0035  0.0000  0.0000
                                            0.0000  0.7039  0.0489 -0.0075 -0.4064
                                           -0.0282  0.0043  0.0000  0.0000  0.0000
                                           -0.0457 -0.0037  0.0000  0.0000  0.0000
                                            0.0000  0.0264  0.0021 -0.0242 -0.0062
                ( 67.35%)   0.8206*Cl   4 s( 27.03%)p 2.66( 71.97%)d 0.04(  1.00%)
                                            0.0000  0.0000  0.5198 -0.0071  0.0069
                                            0.0001 -0.0002  0.0000 -0.7346  0.0088
                                            0.0027  0.0000  0.4241 -0.0051 -0.0016
                                            0.0000  0.0000  0.0000  0.0000 -0.0769
                                           -0.0008  0.0000  0.0000  0.0000  0.0000
                                            0.0444  0.0005 -0.0459 -0.0012
The text file for the bond summaries and their hybridisation gives an interesting feature. Bonds 1,3 and 4 are expected, and are also found in the BF3 and BH3 molecules as 3 identical sp2 bonding B-R bonds. However, the 2nd bond feature gives a novel interaction that is not found in neither BH3 nor BF3.
2. (1.99958) BD ( 1) B   1 -Cl   3
                (  7.67%)   0.2769* B   1 s(  0.00%)p 1.00( 98.37%)d 0.02(  1.63%)
                                            0.0000  0.0000  0.0000  0.0000  0.0000
                                            0.0000  0.0000  0.0000  0.0000  0.0000
                                            0.0000  0.0000  0.9862 -0.1029  0.0232
                                            0.0000  0.0000 -0.1104  0.0059 -0.0637
                                            0.0034  0.0000  0.0000  0.0000  0.0000
                ( 92.33%)   0.9609*Cl   3 s(  0.00%)p 1.00( 99.76%)d 0.00(  0.24%)
                                            0.0000  0.0000  0.0000  0.0000  0.0000
                                            0.0000  0.0000  0.0000  0.0000  0.0000
                                            0.0000  0.0000  0.0000  0.0000  0.0000
                                            0.0000  0.9988  0.0050  0.0006  0.0000
                                            0.0000  0.0421 -0.0017  0.0243 -0.0010
                                            0.0000  0.0000  0.0000  0.0000

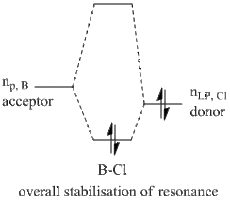
This effectively desribes the presence of an additional bond, and given that more than 90% of this bond is due to contribution from a Cl atom (number 3), this implies that the stabilisation effect from the halide lone pair into the non-bonding B p-orbital takes form in a greater magnitude then previously thought, namely resonance. The hybridisation of the bond shows only p-character, hence this is an p-p overlap, which indicates it is a pi bond. This new feature implies a scenario where the Cl-B-Cl system can be seen as a 3c-4e bond, similar to that of a XeF2 system. The extent of this resonance is shown in the MO diagram and is further investigated below using second order perturbation analysis.
----

Threshold for printing:   0.50 kcal/mol
                                                                              E(2)  E(j)-E(i) F(i,j)
         Donor NBO (i)                     Acceptor NBO (j)                 kcal/mol   a.u.    a.u.
 ===================================================================================================

 within unit  1
  21. LP (   1)Cl   2                / 30. RY*(   2) B   1                   17.90    1.90    0.165
  22. LP (   2)Cl   2                /111. BD*(   2) B   1 -Cl   3           13.30    0.87    0.096
  22. LP (   2)Cl   2                /112. BD*(   1) B   1 -Cl   4           13.30    0.87    0.096
  23. LP (   3)Cl   2                /110. BD*(   1) B   1 -Cl   3           50.26    0.52    0.149
  24. LP (   1)Cl   3                / 29. RY*(   1) B   1                   13.43    1.90    0.143
  25. LP (   2)Cl   3                /109. BD*(   1) B   1 -Cl   2           13.30    0.87    0.096
  25. LP (   2)Cl   3                /112. BD*(   1) B   1 -Cl   4           13.30    0.87    0.096
  26. LP (   1)Cl   4                / 29. RY*(   1) B   1                   13.43    1.90    0.143
  27. LP (   2)Cl   4                /109. BD*(   1) B   1 -Cl   2           13.30    0.87    0.096
  27. LP (   2)Cl   4                /111. BD*(   2) B   1 -Cl   3           13.30    0.87    0.096
  28. LP (   3)Cl   4                /110. BD*(   1) B   1 -Cl   3           50.26    0.52    0.149
Before commenting upon specific interactions, it should be noted that the BCl3 molecule exhibits many more stabilising interactions that are >10 kcal/mol as well as between 0-10 kcal/mol. These are additive values, hence this explains the significant energy difference between the optimisation energies of the two boron trihalides.
Furthermore, the BF3 molecule was found to have 3 stabilising interactions that were of the magniude of ~50 kcal/mol, and these values implied a lone pair donatin into a LP* non-bonding Boron p-orbital. However, it can be seen in the table above that the BCl3 molecule shows only 2 interactions of such magnitude, and these interactions involve the stabilisation of the anti-bonding B=Cl bond that was found and commented on earlier. Moreover, missing 50 kcal/mol interaction belongs to the Cl 3 atom, which was again the one found to have the B=Cl pi bond in the hybridisation analysis, which explains the absence of lone pair donation from this Cl since it is already donated to the resonance pi bond. This interaction is given on the diagram below;

Numbers 23 and 28 on the perturbation table summarise the situation described and show the stabilisation of the anti-bonding B=Cl(3) bond by lone pairs on Cl(2) and Cl(4) atoms.
Explaining the trend that boron trihalides give better electron acceptors going down Group 7 using these parameters might be farfetched. However the new found sets of data give self consistent data, so they can be used as a basis for an argument. It is well-known that resonance reduces the overall stability of the molecule, and incidentally its molecular orbitals. This might imply a LUMO that is lower down in energy, however it should be noted that upon the formation of a resonance structure, this LUMO loses its Lewis acidic character and the pi antibonding B=Cl orbital essentially becomes the electron pair acceptor.
Reasons to why this resonance is observed in BCl3 and not BF3 can indeed be explained by their electronegativites. Fluorine, a more electronegative species, would require more energy to donate an electron pair, as these pairs are more tightly bound in fluorine than they are in chlorine. Furthermore, the nearly ionic character of the B-F bond is another limitation to such a donation. This limitation is non-existing in a B-Cl, as the bond was found to have significant covalent character earlier in this section.
BF3&BCl3: MO Comparison
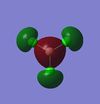
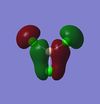
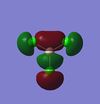
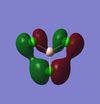
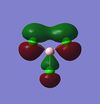
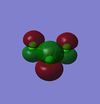
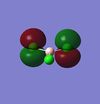
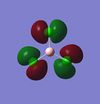
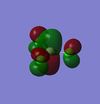
A conclusion has been reached using the NBO and second order perturbation analysis, however the MO's of BCl3 have been calculated and are given below for reference.
| homo-8 | homo-7/homo-6 | homo-5 | homo-4/homo-3 | homo-2/homo-1 | homo | lumo | lumo+1 |
|---|---|---|---|---|---|---|---|
 |
  |
 |
  |
  |
 |
 |
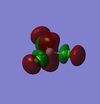 |
The energetic positioning of the MO's are similar with BF3, the only difference being the magnitude of contribution from the fragments to the MO's. This is expected and follows the trend of the electronegativities, with the Boron contribution to the LUMOs decreasing due to the RCl3 having higher energy FO's that are closer to the LUMOs.
The energies of the displayed MO's of BF3 and BCl3 have been tabulated.
| Orbital | Energy (in a.u.) | The BCl3 compound shows a more stabilised LUMO level compared to BF3 by ~0.03 a.u.. This is explained by the possible resonance formation in the BCl3. | |
|---|---|---|---|
| BF3 | BCl3 | ||
| LUMO+1 | 0.025 | 0.024 | |
| LUMO | -0.041 | -0.075 | |
| HOMO | -0.432 | -0.291 | |
| HOMO-1 | -0.453 | -0.314 | |
| HOMO-2 | |||
| HOMO-3 | -0.468 | -0.320 | |
| HOMO-4 | |||
| HOMO-5 | -0.525 | -0.372 | |
| HOMO-6 | -0.566 | -0.415 | |
| HOMO-7 | |||
| HOMO-8 | -0.596 | -0.473 | |
Comparing the Lewis Adducts of Boron Trihalides
| adduct | display | mo | |||
|---|---|---|---|---|---|
| bf3nh3 |
|
 | |||
| bcl3nh3 |
|
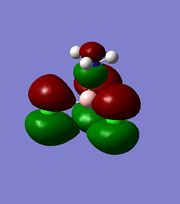 |
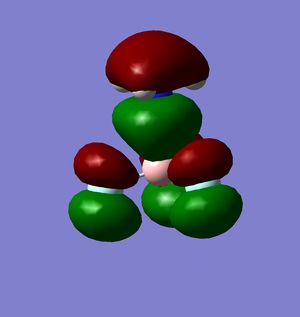
Bonding in the Lewis adducts arising from the interaction of the trihalides under study with ammonia have been investigated, via optimisation of the BH3.NH3 and BCl3.NH3 molecules and MO/NBO analysis[27][28][29][30]. The bonding MO involving electron density around the NH3 electron donor has been selected and displayed for both adducts along with the jmols showing the different B-N bond lengths.
The NBO analysis of the two adducts did not give anything beyond what was expected;
- 5 sp3 hybrdidised bonds;
- 3 B-F bonds
- 1 B-N bond
- 3 N-H bonds
It should be noted that the possible pi bond that existed between Cl(3) and B was absent in this analysis, and it can be seen that the incipient B-N bond in the BCl3.NH3 adduct lies in a lower-lying and hence more stable orbital than the B-N bond in the BF3.NH3 adduct. This describes a situation where the mixing between the Lewis acceptor bond and the lone pair donor gives a more stable bonding MO, either from better overlap of orbitals/energies or overall more stable starting fragment orbitals. This could very well be the resonance effect described earlier, which would decrease the eneergy of the LUMO.
The second order perturbation analysis also gave intuitive results, with the NBO stabilisations only arising from donations of fluorine/chlorine lone pairs into antibonding B-F and B-N orbitals. All these donations give a stabilisation of approximately ~13 kcal/mol, and the 50 kcal/mol stabilisation is absent due to the new sp3 hybrid geometry.
The jmols of the adducts show different bond lengths, and at this point it should already be expected for the BCl3.NH3 adduct to have a shorter and stronger B-N bond. This is indeed what is observed, however an additional feature can be pointed out in the MO's to explain the stability of the trichloride adduct.
The literature paper gives charge capacity as an alternative explanation to the counter-intuitive difference in the stability of the adducts. The electron density around the NH3 donor is evidently different for the two adducts, and even though this could be and most likely is caused by straightforward mixing of orbitals, it could also be seen as the ability of the chlorine atoms to suppport additional electron density due to their d-orbitals. It is seen that the electron density in the HOMO of the BF3 adduct is built-up on the NH3, whereas the opposite is observed for the HOMO-3 of the BCl3 adduct.
Vibrational Analysis
The summary files for the frequency analysis of both trihalide is given below, as well as links to their DSpace.
BF3 frequency File Name = log_54290(1) File Type = .log Calculation Type = FREQ Calculation Method = RMP2-FC Basis Set = 6-31+G(2d,p) Charge = 0 Spin = Singlet E(MP2) = -323.91398371 a.u. RMS Gradient Norm = 0.00000087 a.u. Imaginary Freq = 0 Dipole Moment = 0.0000 Debye Point Group = D3H Job cpu time: 0 days 0 hours 7 minutes 35.9 seconds. |
BCl3 frequency File Name = log_54291 File Type = .log Calculation Type = FREQ Calculation Method = RMP2-FC Basis Set = 6-31+G(2d,p) Charge = 0 Spin = Singlet E(MP2) = -1403.79028530 a.u. RMS Gradient Norm = 0.00007311 a.u. Imaginary Freq = 0 Dipole Moment = 0.0000 Debye Point Group = D3H Job cpu time: 0 days 0 hours 13 minutes 17.9 seconds. |
The low frequencies have been obtained. The bcl3 molecule shows values greater in magnitude than bf3, however these values are the true zero-frequency modes for the molecules as the enegy values of the frequency summary files are the same as the optimisation summary E(RB3LYP) energies.
bf3 http://hdl.handle.net/10042/to-11968 confirm summary same enegry value BF3
Low frequencies --- 0.0012 0.0013 0.0020 0.9851 0.9882 0.9882
bcl3 http://hdl.handle.net/10042/to-11969 confirm summary same energy value bcl3
Low frequencies --- -5.7817 -5.7809 -5.7809 0.0037 0.0041 0.0070
The 6 vibrational modes have been tabulated and displayed. Compare and contrast on the initial BH3 vibrational modes have been made.
| Bend-Stretch/Motion | BF3 [31] | BCl3[32] | |||||||
|---|---|---|---|---|---|---|---|---|---|
| Display | Frequency (cm-1) | Intensity | Symmetry | Display | Frequency (cm-1) | Intensity | Symmetry | ||
| Vibration 1 | Symmetric Scissoring | view | 481 | 17.91 | E' | view | 255 | 31.05 | E' |
| Vibration 2 | Asymmetric Rocking | view | 481 | 17.91 | E' | view | 255 | 31.05 | E' |
| Vibration 3 | Umbrella Deformation | view | 721 | 11.81 | A"2 | view | 461 | 11.77 | A"2 |
| Vibration 4 | Symmetric Stretch | view | 868 | 18.99 | A'1 | view | 476 | 34.96 | A'1 |
| Vibration 5 | Asymmetric Stretch | view | 1426 | 18.99 | E' | view | 966 | 11.29 | E' |
| Vibration 6 | Asymmetric Stretch | view | 1426 | 12.27 | E' | view | 966 | 11.29 | E' |
Both 6 modes of vibrations are analogous to the tabulated BH3 vibrational modes, as all three molecules exhibit the same symmetry of D3h. Hence, compare and contrast is fairly straightforward. BH3 stretches show the highest frequency despite the fact that B-F bond distance is the shortest. The frequency analysis does not play an important role in the answering of the mini-project question, hence in depth analysis of the spectra will not be given as it is similar to BH3.
Conclusion
4 systems have been studied. Borane structure was investigated using primitive basis sets, and thallium bromide using pseudo-potentials. An isomeric structure was studied and isomers distinguished using computational frequency analysis. A mini project on boron trifluorides analysed and results displayed.
References
- ↑ http://hdl.handle.net/10042/to-11867
- ↑ Schwerdtfeger, P. (August 2011), "The Pseudopotential Approximation in Electronic Structure Theory", ChemPhysChem, doi:10.1002/cphc.201100387
- ↑ http://hdl.handle.net/10042/to-11887
- ↑ http://hdl.handle.net/10042/to-11888
- ↑ http://hdl.handle.net/10042/to-11889
- ↑ http://hdl.handle.net/10042/to-11886
- ↑ http://hdl.handle.net/10042/to-11890
- ↑ http://hdl.handle.net/10042/to-11891
- ↑ F. A. Cotton, Inorg. Chem., 21, 1982, pp 294 - 299
- ↑ D. W. Bennett, J. Chem. Cryst., 34(6), 2004, pp 353 - 359
- ↑ http://hdl.handle.net/10042/to-11903
- ↑ http://hdl.handle.net/10042/to-11900
- ↑ http://hdl.handle.net/10042/to-11902
- ↑ http://hdl.handle.net/10042/to-11899
- ↑ "A Computational Analysis of the bonding in Boron Trifluoride and Boron Trichloride and their complexes in ammonia", Inorg. Chem. 1993, 32, 2622-2625
- ↑ Shriver, D. F.; Swanson, B. Inorg. Chem. 1971, 10, 1354.
- ↑ Cotton, F. A.; Wilkinson, G. Aduancedhorganic Chemistry; John Wiley
- ↑ Sreekanth,C.S.;Mok,L.Y.;Huang,H.H.;Tan,K.L.J.Elect.Specrrosc.
- ↑ Liebman, J. F. Srrucr. Chem. 1990, 1, 395.
- ↑ Pearson, R. G. Inorg. Chem. 1988, 27, 734.
- ↑ Frisch, M. J.; Trucks, G. W.; Head-Gordon, M.; Gill, P. M. W.; Wong, M. W.; Forseman, J. B.; Johnson, B. G.; Schlegel, H. B.; Robb, M. A,; Replogle, E. S.; Gomperts, R.; Andres, J. L.;Raghavachari, K.; Binkley, J. S.; Gonzalez, C.; Martin, R. L.; Fox, D. J.; Defrees, D. J.; Baker, J.; Stewart, J. J. P.; Pople, J. A. GAUSSIAN 92, Revision C; Gaussian, Inc.: Pittsburgh, PA, 1992.
- ↑ http://www.brynmawr.edu/chemistry/Chem/sburgmay/chem231/MOpics/BF3mos.jpg
- ↑ http://hdl.handle.net/10042/to-11938
- ↑ http://hdl.handle.net/10042/to-11936
- ↑ http://hdl.handle.net/10042/to-11937
- ↑ http://hdl.handle.net/10042/to-11936
- ↑ http://hdl.handle.net/10042/to-12196
- ↑ http://hdl.handle.net/10042/to-12199
- ↑ http://hdl.handle.net/10042/to-12197
- ↑ http://hdl.handle.net/10042/to-12198
- ↑ http://hdl.handle.net/10042/to-11968
- ↑ http://hdl.handle.net/10042/to-11969

