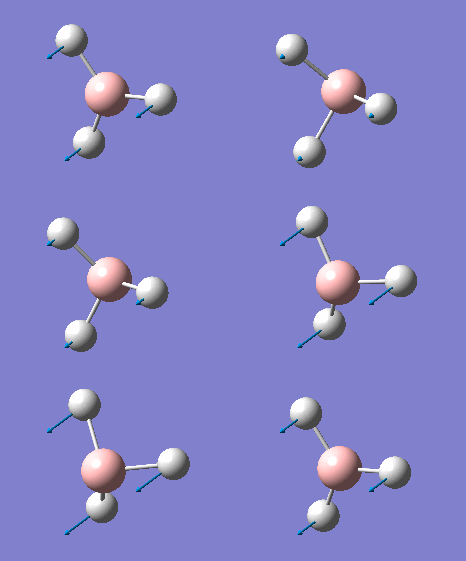
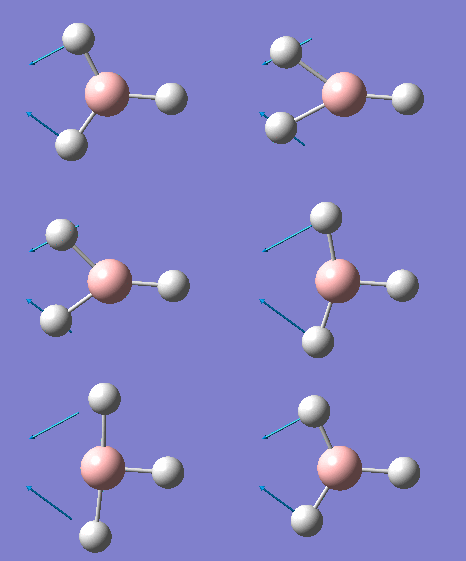
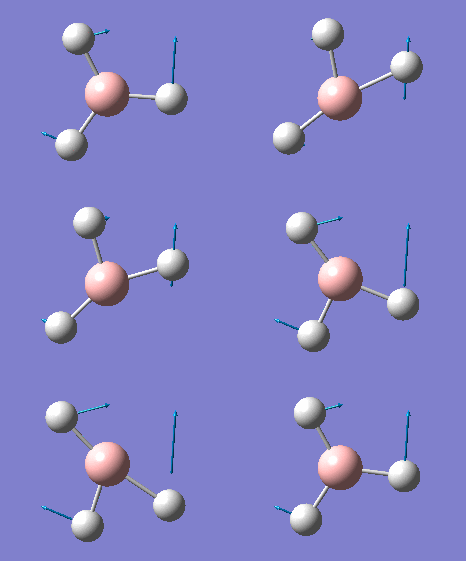
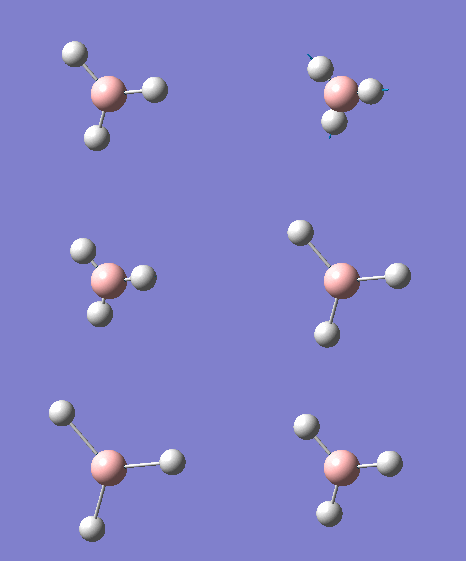
Rep:Mod:underhill911
BH3 Optimization for 3-21G Basis Set
A very small basis set was used for the initial optimization of the BH3 molecule. The B-H bond lengths to 1.53, 1.54 and 1.55 Å in order to break the symmetry of the molecule. This is important in obtaining a true optimization. It is possible that when optimization is carried out with a symmetry group already attached to the molecule, the Gaussian programme will find a local minimum rather than a global minimum.
The .log file can be found here [BH3 3-21G]
| Property | Value |
|---|---|
| File Name | JG_bh3_opt |
| File Type | .log |
| Calculation Type | FOPT |
| Calculation Method | RB3LYP |
| Basis Set | 3-21G |
| Energy | -26.46226429 a.u. |
| RMS Gradient Norm | 0.00008851 a.u. |
| Dipole Moment | 0.00 D |
| Point Group | CS |
| Time Taken | 39.0 seconds |
The item table below indicated that the optimization was successful.
         Item               Value     Threshold  Converged?
 Maximum Force            0.000220     0.000450     YES
 RMS     Force            0.000106     0.000300     YES
 Maximum Displacement     0.000940     0.001800     YES
 RMS     Displacement     0.000447     0.001200     YES
 Predicted change in Energy=-1.672479D-07
 Optimization completed.
    -- Stationary point found.
| Property | Value |
|---|---|
| Bond Length (Å) | 1.19, 1.19, 1.19 |
| Bond Angle (°) | 120.0, 120.0 |
| Dihedral Angle (°) | 180 |
| Energy (a.u.) | -26.46226429 |
The bond lengths are in the correct order of magnitude. Further optimization with a larger basis set will increase the accuracy of these values which is shown in the following section.
BH3 6-31G(d,p) OPT
The previous log file for the 3-21G was used as the input file for the 6-31G optimization in order to improve the accuracy of optimization. The difference between these two basis sets is that the latter uses more atomic orbitals that are combined linearly to create molecular orbitals. The more atomic orbitals available to use in creating molecular orbitals, the more realistic these molecular orbitals become.
There is a trade-off however between accuracy and computational power required. It is common to work up to higher basis sets in stages as this creates stages and result in faster acquisition of the results that going direct to the higher basis sets.
The log file can be found here [631G optimization]
| Property | Value |
|---|---|
| File Name | JG_bh3_opt_631g_dp |
| File Type | .log |
| Calculation Type | FOPT |
| Calculation Method | RB3LYP |
| Basis Set | 6-31G(d,p) |
| Charge | 0 |
| Spin | Singlet |
| Energy | -26.61532358 a.u. |
| RMS Gradient Norm | 0.00008206 a.u. |
| Dipole Moment | 0.00 D |
| Point Group | CS |
| Time Taken | 37 seconds |
The item table below shows that the optimization was successful in converging to a value.
         Item               Value     Threshold  Converged?
 Maximum Force            0.000204     0.000450     YES
 RMS     Force            0.000099     0.000300     YES
 Maximum Displacement     0.000875     0.001800     YES
 RMS     Displacement     0.000418     0.001200     YES
 Predicted change in Energy=-1.452109D-07
 Optimization completed.
    -- Stationary point found.
| Property | Value |
|---|---|
| Bond Lengths (Å) | 1.19, 1.19, 1.19 |
| Bond Angles (°) | 120.0 , 120.0 |
| Dihedral Angle (°) | 180 |
| Energy (a.u.) | -26.61532358 |
A literature value for the bond length was found to be 1.190 Å[1]. This value was obtained from FTIR spectroscopy using the ground state rotational constant B0. As can be seen, both the computational value and the literature value are in good agreement with each other. Using a larger basis set should have the effect of narrowing the difference between these two values.
BH3 6-31G(d,p) Optimization With Enforced Symmetry
D3h symmetry
I have enforced symmetry constraints on the molecule (C3v) to see how this may affect the energy of the molecule. The input file from the 6-31G(d,p) was used and symmetry tolerance was set to 0.01. Upon bending the molecule out of plane, it may become apparent that there is possible mixing which may stabilise the C3v geometry rather than that of the D3h. The log file can be found [.log file]
| Property | Value |
|---|---|
| File Name | JG_bh3_opt_631g_dp_D3HSYMFORCED |
| File Type | .log |
| Calculation Type | FOPT |
| Calculation Method | RB3LYP |
| Basis Set | 6-31G(d,p) |
| Charge | 0 |
| Spin | Singlet |
| Energy | -26.61532363 a.u. |
| RMS Gradient Norm | 0.00000215 a.u. |
| Dipole Moment | 0.00 D |
| Point Group | D3H |
| Time Taken | 30 seconds |
         Item               Value     Threshold  Converged?
 Maximum Force            0.000004     0.000450     YES
 RMS     Force            0.000003     0.000300     YES
 Maximum Displacement     0.000017     0.001800     YES
 RMS     Displacement     0.000011     0.001200     YES
 Predicted change in Energy=-1.081855D-10
 Optimization completed.
    -- Stationary point found.
| Property | Value |
|---|---|
| Bond Lengths (Å) | 1.19, 1.19, 1.19 |
| Bond Angles (°) | 120.0 , 120.0 |
| Dihedral Angle (°) | 180 |
| Energy (a.u.) | -26.61532363 |
Optimization of BH3 with keywords
The log file can be found [here]
| Property | Value |
|---|---|
| File Name | JG_NH3_OPT_Keywords |
| File Type | .log |
| Calculation Type | FOPT |
| Calculation Method | RB3LYP |
| Basis Set | 6-31G(d,p) |
| Charge | 0 |
| Spin | Singlet |
| Energy | -26.61532360 a.u. |
| RMS Gradient Norm | 0.00000040 a.u. |
| Dipole Moment | 0.00 D |
| Point Group | CS |
| Time Taken | 3 minutes and 32.0 seconds |
         Item               Value     Threshold  Converged?
 Maximum Force            0.000001     0.000015     YES
 RMS     Force            0.000000     0.000010     YES
 Maximum Displacement     0.000005     0.000060     YES
 RMS     Displacement     0.000003     0.000040     YES
 Predicted change in Energy=-3.721826D-12
 Optimization completed.
    -- Stationary point found.
GaBr3 Optimization with LanL2dz (D3H)
Forced D3h geometry [.log file] the repository can be found [here] Since we are dealing with two very large elements, which contain 136 electrons. If one was to calculate this considering every electron it would take vast amounts of computational resources. Instead a pseudo-potential may be used which treats the core electrons as a constant (this is still fairly accurate!) and treats the valence electrons previously i.e. when using the pure 6-31G basis set. The reason for the focus on the valence electrons is that these are the electrons that key in the bonding behaviour of the molecule.
         Item               Value     Threshold  Converged?
 Maximum Force            0.000000     0.000450     YES
 RMS     Force            0.000000     0.000300     YES
 Maximum Displacement     0.000003     0.001800     YES
 RMS     Displacement     0.000002     0.001200     YES
 Predicted change in Energy=-1.282694D-12
 Optimization completed.
    -- Stationary point found.
| Property | Value |
|---|---|
| File Name | paint |
| File Type | .log |
| Calculation Type | FOPT |
| Calculation Method | RB3LYP |
| Basis Set | LANL2DZ |
| Charge | 0 |
| Spin | Singlet |
| Energy | -41.70082783 a.u. |
| RMS Gradient Norm | 0.00000016 a.u. |
| Dipole Moment | 0.00 D |
| Point Group | D3H |
| Time Taken | 27.7 seconds |
Note: The file name was chosen randomly as this was an initial test of using the HPC system.
| Property | Value |
|---|---|
| Bond Lengths (Å) | 2.35, 2.35, 2.35 |
| Bond Angles (°) | 120.0 , 120.0 |
| Dihedral Angle (°) | 180 |
| Energy (a.u.) | -41.70082783 |
A literature value of the bond length was found to be 2.239 Å[2]. This value has some deviation from the computed value. This can be rationalized by the use of a pseudo-potential which simplifies the calculation at the expense of accuracy and also using a relatively small basis set (6-31G) with DFT.
BBr3 Optimization with LanL2dz (D3H)
A pseudo-potential was applied to the bromine atoms in order to simplify the calculation (by approximating the non-valent electrons while treating the valence electrons as we have done before). A pseudo-potential is not required for boron as there are already a small number of electrons present and may result in results of a lower accuracy. The .log file can be found here [log file] and the repository [here]
         Item               Value     Threshold  Converged?
 Maximum Force            0.000008     0.000450     YES
 RMS     Force            0.000005     0.000300     YES
 Maximum Displacement     0.000040     0.001800     YES
 RMS     Displacement     0.000026     0.001200     YES
 Predicted change in Energy=-4.625344D-10
 Optimization completed.
    -- Stationary point found.
| Property | Value |
|---|---|
| File Name | JG_BBr3_OPT_lanL2dz_d3hforce |
| File Type | .log |
| Calculation Type | FOPT |
| Calculation Method | RB3LYP |
| Basis Set | LANL2DZ |
| Charge | 0 |
| Spin | Singlet |
| Energy | -64.41639708 a.u. |
| RMS Gradient Norm | 0.00000395 a.u. |
| Dipole Moment | 0.00 D |
| Point Group | D3H |
| Time Taken | 30.1 seconds |
| Property | Value |
|---|---|
| Bond Lengths (Å) | 1.96, 1.96, 1.96 |
| Bond Angles (°) | 120.0 , 120.0 |
| Dihedral Angle (°) | 180 |
| Energy (a.u.) | -64.41639708 |
Pseudo-Potential and Basis set for BBr3
A pseudo-potential (PP) was used for the bromine atoms. This is because bromine has many electrons in lower energy levels which would require lengthy calculations if treated in the same way as hydrogen or boron. The pseudo-potential accounts for the non-valence electrons reducing the number of electrons that needs to be accounted for. The vacant electrons are treated in the same way as before. The .log file can be found here [log file] and the repository [here]
         Item               Value     Threshold  Converged?
 Maximum Force            0.000016     0.000450     YES
 RMS     Force            0.000010     0.000300     YES
 Maximum Displacement     0.000067     0.001800     YES
 RMS     Displacement     0.000040     0.001200     YES
 Predicted change in Energy=-1.574157D-09
 Optimization completed.
    -- Stationary point found.
| Property | Value |
|---|---|
| File Name | JG_BBr3_OPT_PPBr_GenB_T2 |
| File Type | .log |
| Calculation Type | FOPT |
| Calculation Method | RB3LYP |
| Basis Set | Gen |
| Charge | 0 |
| Spin | Singlet |
| Energy | -64.43645388 a.u. |
| RMS Gradient Norm | 0.00000943 a.u. |
| Dipole Moment | 0.00 D |
| Point Group | CS |
| Time Taken | 38.8 seconds |
| Property | Value |
|---|---|
| Bond Length (Å) | 1.93 |
| Bond Angles (°) | 120.0 , 120.0 |
| Dihedral Angle (°) | 180 |
| Energy (a.u.) | -64.43645388 a.u. |
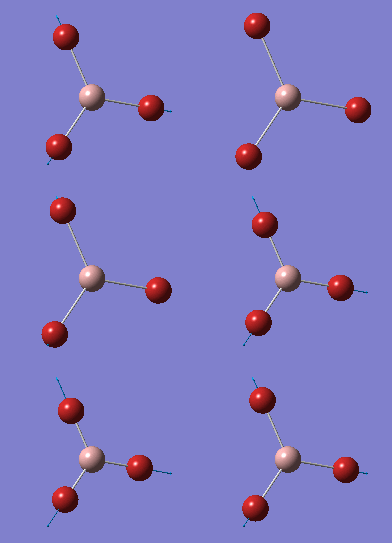
It was deemed sufficient to compare the obtained bond length to an experimental literature value rather than a computed value as this value is not dependent upon the basis set used. A value of 190.3 pm was obtained[3]. These values are in relatively good agreement to the experimental value.
Comparison Of Bond Lengths
| Property | BBr3 | BH3 | GaBr3 |
|---|---|---|---|
| Bond Length (Å) | 1.93 | 1.19 | 2.35 |
| Bond Angles (°) | 120.0 | 120.0 | 120.0 |
It is deemed appropriate to compare the different bond lengths of the optimized molecules. These molecules have been optimized with the same basis set. For the larger atoms such as Ga and Br, a pseudo-potential was used for the inner electrons in order to reduce the required computational power.
It would be inappropriate to compare the energies obtained for each of the compounds since this energy is dependent upon the compound itself. For example, Ga and B have very different atomic numbers and thus will result in drawing empty conclusions.
The effect of changing the ligand
In changing from hydrogen to bromine there is an observed lengthening of the bond. The major difference between these two ligands is the number of valence electrons present thus a difference atomic radii. Bromine has 35 electrons whereas hydrogen has just 1 electron. Bromine will thus have a larger principle quantum number to accommodate these electron resulting in greater separation between the two atoms. Hydrogen will bond using its s-orbital which has a high electron density. Bromine on the other hand will bond via a p-orbital which is naturally more diffuse than that of an s-orbital.
The key similarity between these ligands is the nature of the bond. Both hydrogen and bromine behave as x ligands and contribute one electron to the central atom. The bond order dictates the strength and thus the length of the bond. Bromine has a larger nuclear charge and a greater attraction for the shared pair of electrons resulting in a weaker bond which will be longer.
Changing the central metal ion has a similar effect as to that of changing the ligands. The larger Ga Br bond uses more diffuse orbitals which results in a weaker interaction due to poorer overlap and thus a weaker bond. Gallium us also less electropositive than boron and therefore there is lesser electrostatic interactions in this molecule than is present in that of the boron bromine compound.
Both Ga and B are group 13 elements and therefor prefer to form 3 coordinate species. Both possess an empty p-orbital which can accept a pair of electrons thus acting as a Lewis acid. The key difference between these atoms is the number of electrons and thus the principle quantum number n.
Why do some structures in Gaussview display no bonds?
If there is no visible bond shown, it does not necessarily mean that there is no bond present, Gaussview only draws bonds between atoms if the distance between atoms fall into a certain length range as dictated by a repository of known separations in which bonds occur. Only then will the programme show the presence of a bond.
What is a bond?
There are several different types of bonds. A common feature is that these almost always result in an attractive interaction that results in stabilisation of a species. This is due to electrostatic forces acting between the positively charged nuclei and negative electrons or even by dipole-dipole attractions. A covalent bond if a directional bond originating from a shared pair of electrons between atoms. This acts to satisfy electron demand contributing to an octet of electrons. An ionic bond is formed by the electrostatic attraction between two oppositely charged species (anions and cations) A metallic bond is the electrostatic attraction of positively charged ions for delocalised electrons. Hydrogen bond is the electrostatic attraction between two dipoles, specifically between hydrogen and nitrogen, oxygen, fluorine atoms. This is not a typical bond in that it involves electrons instead it uses the electronegativity difference between the elements which form dipoles.
The relative strengths are as follows; Covalent > Ionic > Metallic > Hydrogen Bonding > Dipole-Dipole > Quadrupole-Quadrupole
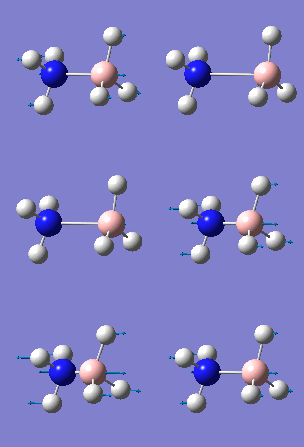
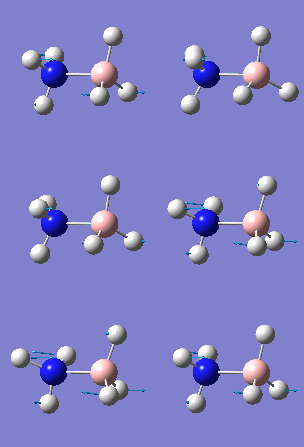
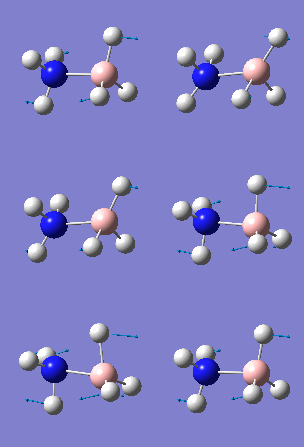
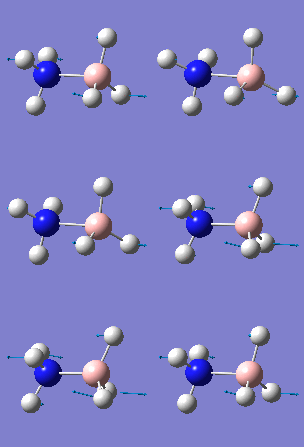
Vibrational Analysis
No symmetry constraints
The 6-31G (d,p) optimization was used for the frequency analysis of the BH3 molecule. The frequency of the BH3 molecule was determined and the log file can be found [here]
| Property | Value |
|---|---|
| File Name | JG_BH3_FREQ |
| File Type | .log |
| Calculation Type | FREQ |
| Calculation Method | RB3LYP |
| Basis Set | 6-31G(d,p) |
| Charge | 0 |
| Spin | Singlet |
| Energy | -26.61532341 a.u. |
| RMS Gradient Norm | 0.00009674 a.u. |
| Dipole Moment | 0.00 D |
| Point Group | D3H |
| Time Taken | 7 seconds |
Low frequencies ---   -0.2240   -0.1026   -0.0055   48.4902   49.5396   49.5401
 Low frequencies --- 1163.7367 1213.6810 1213.6837
The small frequencies are fairly large. In an attempt to reduce these, the BH3 will be optimized again while constraining the geometry to D3h
Optimization with D3h
In this optimization, the symmetry is now confined to the D3h point group. This is done in the hope as to increase the accuracy of the optimisation and in turn yield smaller values for the low frequency. The log file can be found [here]
| Property | Value |
|---|---|
| File Name | JG_BH3_OPT_T3 |
| File Type | .log |
| Calculation Type | FOPT |
| Calculation Method | RB3LYP |
| Basis Set | 6-31G(d,p) |
| Charge | 0 |
| Spin | Singlet |
| Energy | -26.61532363 a.u. |
| RMS Gradient Norm | 0.00000296 a.u. |
| Dipole Moment | 0.00 D |
| Point Group | D3H |
| Time Taken | 15 seconds |
It is apparent from the table below that the optimization was successful as the force and displacement converged to a value.
         Item               Value     Threshold  Converged?
 Maximum Force            0.000006     0.000450     YES
 RMS     Force            0.000004     0.000300     YES
 Maximum Displacement     0.000023     0.001800     YES
 RMS     Displacement     0.000015     0.001200     YES
 Predicted change in Energy=-2.008835D-10
 Optimization completed.
    -- Stationary point found.
Vibrational frequency of BH3
The log file can be found [here]
 Low frequencies ---   -0.9432   -0.8611   -0.0055    5.7455   11.7246   11.7625
 Low frequencies --- 1162.9963 1213.1826 1213.1853
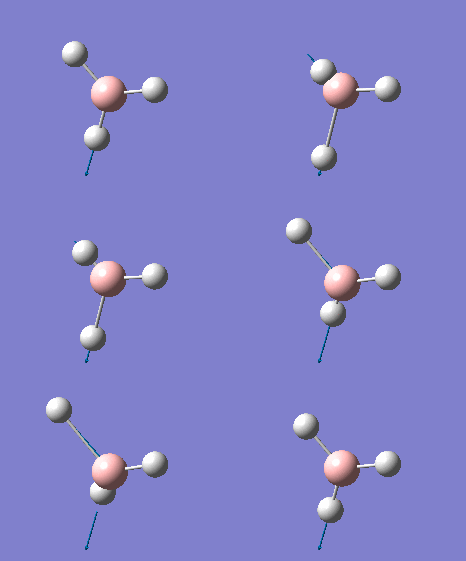
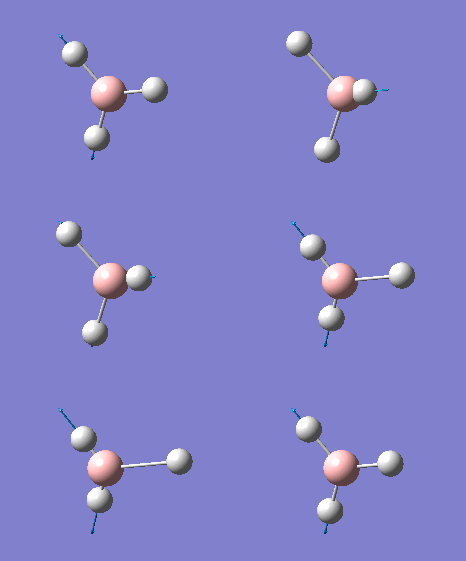
These low frequencies attributed to translation and rotation are very small and within the standard +/- 15 cm-1 range. The fact that there are no negative frequencies indicates that the optimization was successful in finding the lowest energy configuration

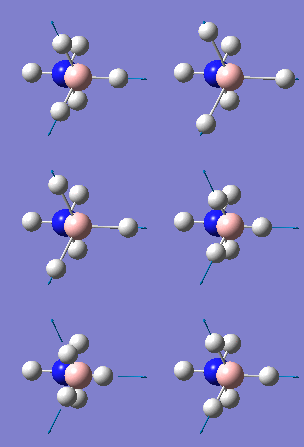
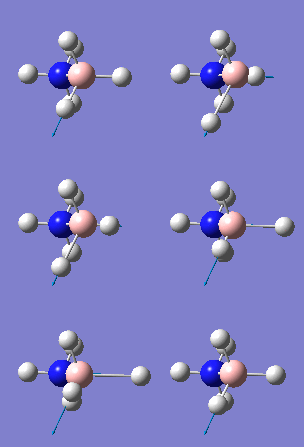
The fact that there are not six peaks present in the IR-spectrum is attributed to the presence of degenerate vibrations. These can be spotted by the similar vibrational frequencies and the symmetry labels of e. From claim we expect to see 2 peaks referring to degenerate modes of vibrations and two singly degenerate peaks at wavenumbers of 1163 and 2582 cm-1. However, only the modes that result in a change in dipole moment are visible in IR. The 4th mode is a symmetrical stretch and thus this will result in no change of dipole moment hence the absence of this peak in the IR spectrum.
It worth noting that character tables can be used to predict which modes are IR active and what modes are Raman active. Raman spectroscopy involves a change in polarisability. If a symmetry label has a Tx/y/z present in the same row under the linear rotations column, this implies that this is IR active.
Vibrational analysis of GaBr3
The log file can be found [here] and the [repository data]. The keywords "opt=tight int=ultrafine scf=conver=9" were used
| Property | Value |
|---|---|
| File Name | log_86031 |
| File Type | .log |
| Calculation Type | FREQ |
| Calculation Method | RB3LYP |
| Basis Set | LANL2DZ |
| Charge | 0 |
| Spin | Singlet |
| Energy | -41.70082783 a.u. |
| RMS Gradient Norm | 0.00000011 a.u. |
| Dipole Moment | 0.00 D |
| Point Group | D3H |
| Time Taken | 17.4 seconds |
Low frequencies ---   -0.5252   -0.5247   -0.0024   -0.0010    0.0235    1.2010
 Low frequencies ---   76.3744   76.3753   99.6982
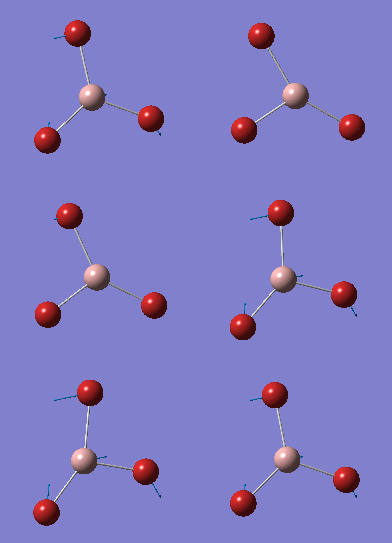
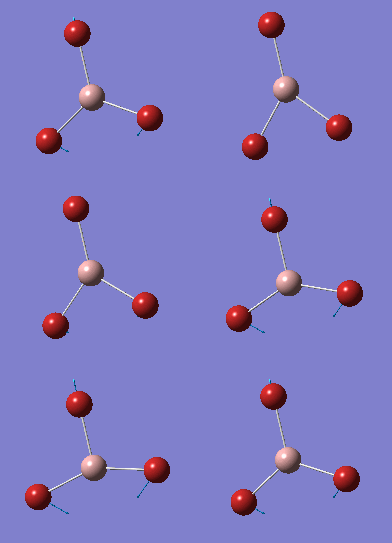
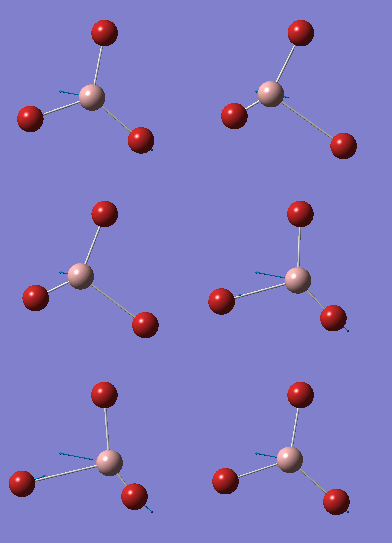
The lowest real normal mode of vibration corresponds to 76.37 which is a degenerate mode (E' ). The reason this is a real mode is due to the fact that it is positive in nature. A complex mode would have a negative sign. The six low frequencies referring to the translational and rotational motion are very small here.
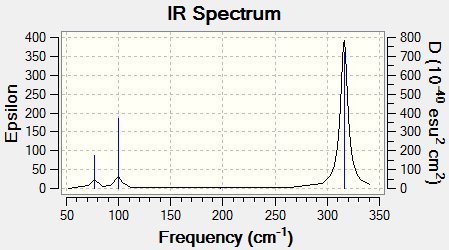
Once again degenerate modes are present as indicated by the E symmetry labels. The fact that there is also a A'1 mode means that this is not visible on the IR spectrum due to no change in dipole moment. All of the vibrations shown above have a smaller wavenumber than that of BH3. The reason for this will be discussed in a subsequent section.
Comparison of the vibrations of GaBr3 and BH3
| Mode # | BH3 (cm-1) | GaBr3 (cm-1) |
|---|---|---|
| 1 | 1163 (A"2 ) | 76 (E' ) |
| 2 | 1213 (E' ) | 76(E' ) |
| 3 | 1213 (E' ) | 100 (A"2 ) |
| 4 | 2582 (A'1 ) | 197 (A'1 ) |
| 5 | 2715 (E' ) | 316 (E' ) |
| 6 | 2712 (E' ) | 316 (E' ) |
The vibrations of a molecule can be modelled by the harmonic oscillator. This can be thought of as two masses, μ1, μ2 (the atoms) connected by a spring with spring constant k (the bond). The stronger the bond is, the larger the value of k. The energy required to bring about a transition from the ground state vibronic level to the first excited state is given by , where . The bond strength k is related to the resorting force by the equation The μ term is the reduced mass. As a direct result of this, strong bonds absorb at a higher wavenumber (requires more energy), heavy atoms are observed at lower wavenumbers.
The most obvious difference between the two molecules is the wavenumber at which the modes of vibration appear. GaBr3 occurs at a lower wavenumber, which is due to the heavier atoms present (greater reduced mass,μ) and more diffuse bonding resulting in a weaker bond (smaller k). This was previously shown where the bond lengths which exhibited the Ga-Br bond being nearly twice that of the B-H bond. It was stated that the bond was weaker due to the more diffuse orbitals being used in the covalent bond.
Both of the molecules belong to the same point group and both have the same number of vibrational modes as dictated by the equation 3n-6 where n=4. Both molecules also have the same number of visible IR modes. This is simply because the symmetry of the two molecules is essentially identical. The only difference will be the wavenumbers at which the vibrations occur.
There has also been a reordering of modes, for BH3 the A"2 mode appears at a lower wavenumber than E', where as in GaBr3 the A"2 is now at a higher wavenumber than that of the E' mode. The reason for this originates from considerations of the mass of the atoms in each molecule. In the case of BH3 the boron atom is the central atom and is the heaviest. For that of GaBr3 the central gallium atom is lighter than that of the bromine atoms. In the vibrations, the atoms that are lightest have the largest displacement. Looking at the bending vibrations of the two molecules the gallium has a much larger displacement than that of the boron.
The reason that there are two distinct regions of vibrations is due to the nature of these vibrations. The higher wavenumbers correspond to stretching modes since more energy is required to stretch a bond than to bend a bond. Hence three vibrations occurring at a lower wave number referring to the bending modes.
The same basis set has to be used when comparing data obtained for two molecules in-order to maintain the same level of accuracy. Changing the basis set and method used can result in different consideration and corrections made to the system. For example, the MP method- Møller–Plesset perturbation theory, this adds correlation effects for electrons (from Rayleigh–Schrödinger perturbation theory) thus improving upon the Hartree-fock method.
The reason for carrying out a frequency analysis is to determine that the optimization has converged to a correct stationary state. Both the ground state and transition state has a zero-gradient associated with them. By carrying out a frequency analysis the second derivative is taken to determine if this corresponds to maximum (transition state) or a minimum (ground state). If the frequencies are positive, this corresponds to a minimum and thus the ground state has been found successfully. The six low frequencies represent the degrees of freedom associated to that of the three translational modes and the three rotational modes. A small value for these frequencies is desired.
BH3 Molecular orbitals
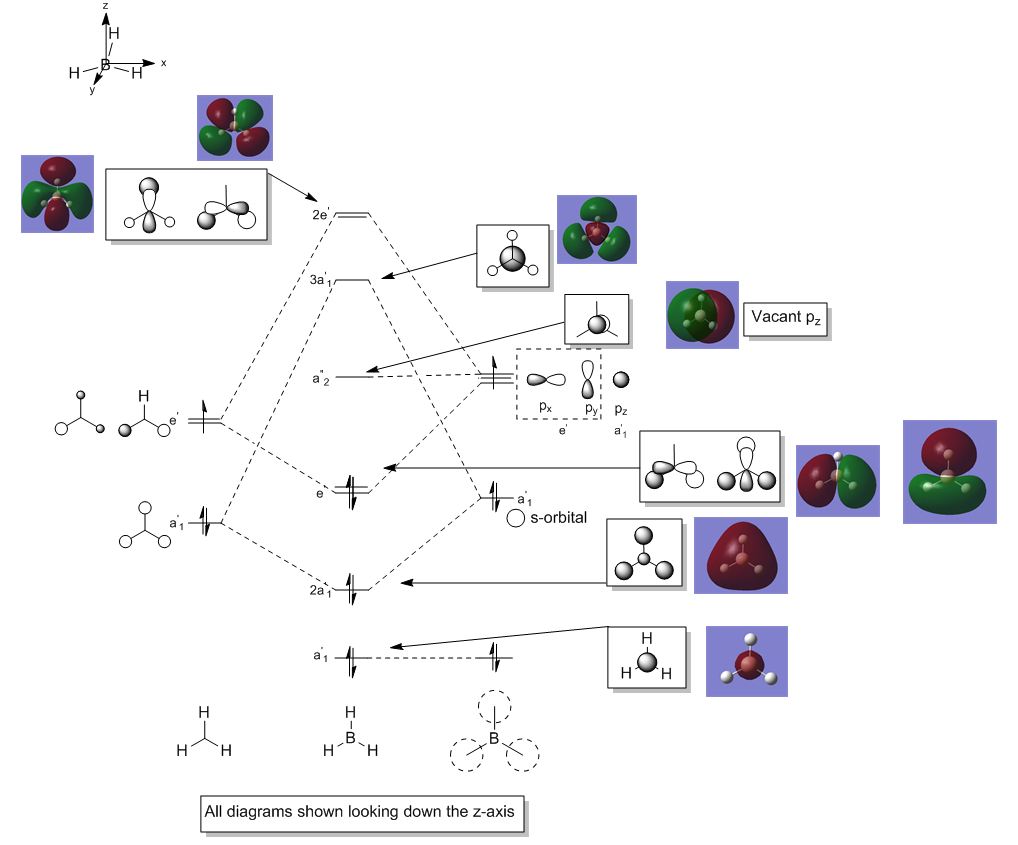
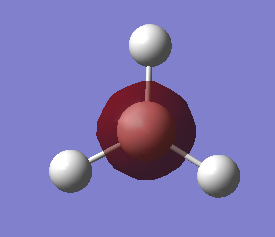
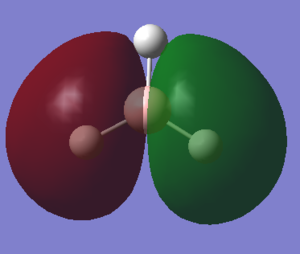
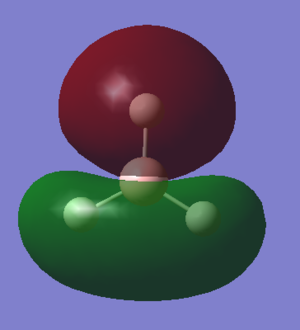
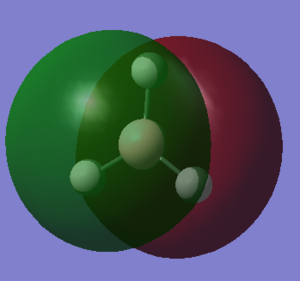
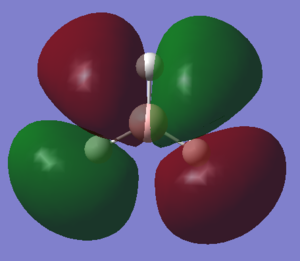
The repository data can be found [here] A keyword of "pop=full" was used in calculation of the energies. Below shows the molecular orbital diagram for BH3. The creation of the molecular orbital diagram uses linear combinations of atomic orbitals to form molecular orbitals. There is a high similarity between the molecular orbitals calculated by Gaussian and the prediction of the MOs in the diagram. This shows the power of MO theory and can be supported by Gaussian calculations.
Note: The 1a'1 orbital is much lower in energy and is not involved in the bonding at all. This can be proved by carrying out population analysis where the core orbitals will be shown isolated from the bonding orbitals
Analysis of NH3
The optimized log file can be found [here]. The keywords of "int=ultrafine opt=tight (or vtight) and scf=conver=9" which have the effect of giving a higher accuracy of optimisation.
| Property | Value |
|---|---|
| File Name | JG_NH3_631G_DP_OPT_KEYWORDS |
| File Type | .log |
| Calculation Type | FOPT |
| Calculation Method | RB3LYP |
| Basis Set | 6-31G(d,p) |
| Charge | 0 |
| Spin | Singlet |
| Energy | -56.55776872 a.u. |
| RMS Gradient Norm | 0.00000095 a.u. |
| Dipole Moment | 1.85 D |
| Point Group | C1 |
| Time Taken | 1 minutes and 9.0 seconds |
         Item               Value     Threshold  Converged?
 Maximum Force            0.000002     0.000015     YES
 RMS     Force            0.000001     0.000010     YES
 Maximum Displacement     0.000005     0.000060     YES
 RMS     Displacement     0.000003     0.000040     YES
 Predicted change in Energy=-9.688006D-12
 Optimization completed.
    -- Stationary point found.
However the point is found to be C1.
Frequency
The log file can be found [here]. The keywords "opt=tight int=ultrafine scf=conver=9" were used.
| Property | Value |
|---|---|
| File Name | JG_NH3_631g_DP_OPT_KEYBOARDS_FREQ |
| File Type | .log |
| Calculation Type | FREQ |
| Calculation Method | RB3LYP |
| Basis Set | 6-31G(d,p) |
| Charge | 0 |
| Spin | Singlet |
| Energy | -56.55776872 a.u. |
| RMS Gradient Norm | 0.00000088 a.u. |
| Dipole Moment | 1.85 D |
| Point Group | C1 |
| Time Taken | 0 minute and 17.0 seconds |
The low frequencies are given below,
 Low frequencies ---   -6.7990   -4.9561   -0.6898    0.0006    0.0011    0.0014
 Low frequencies --- 1089.3478 1693.9255 1693.9292


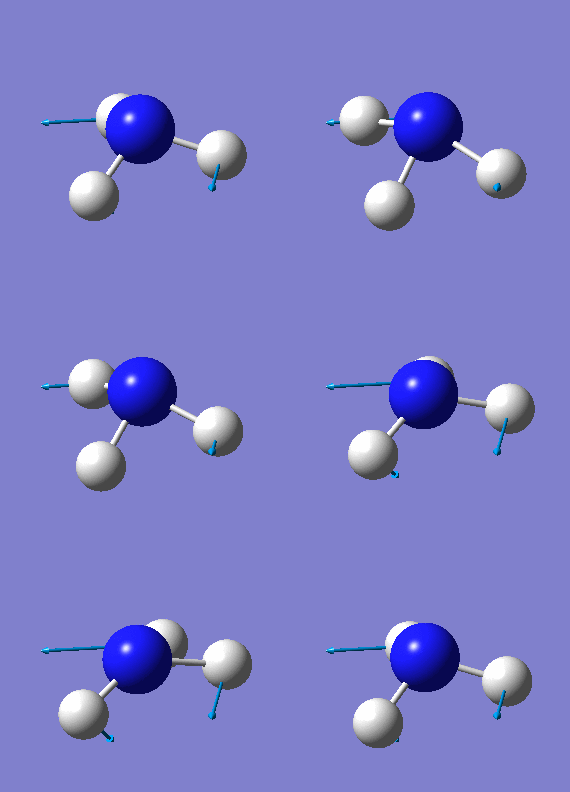
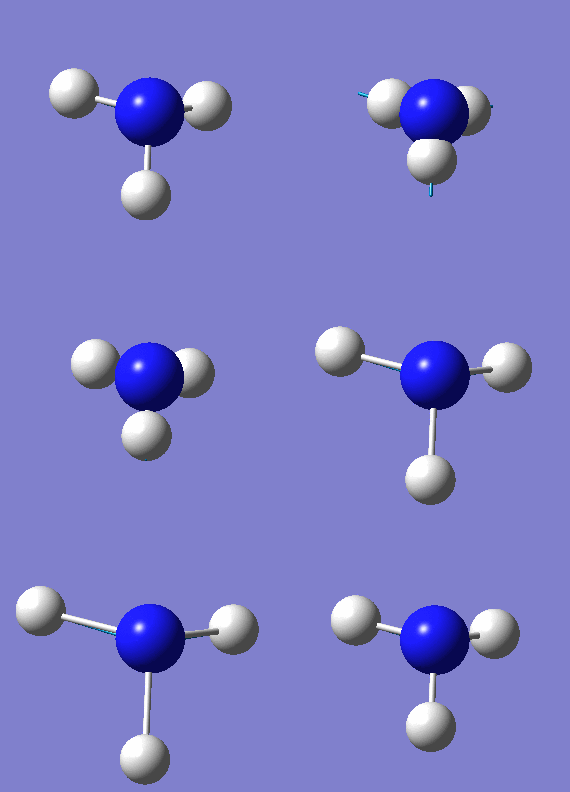
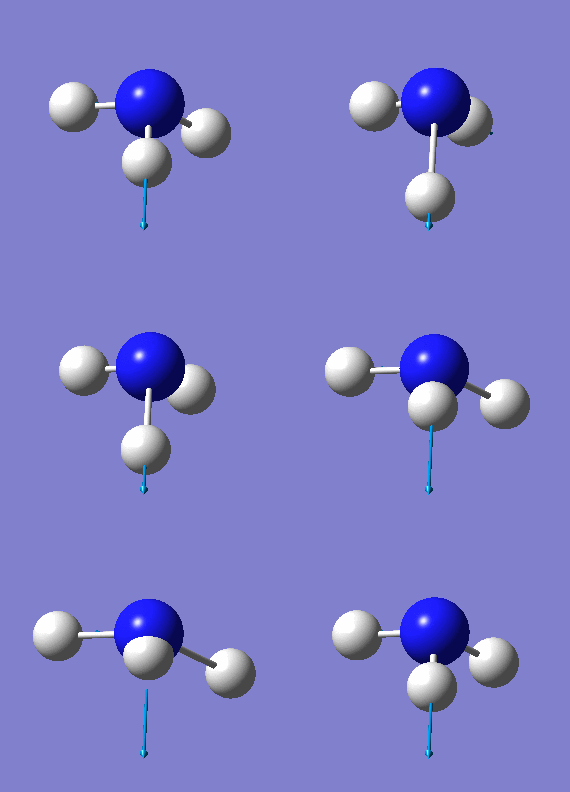
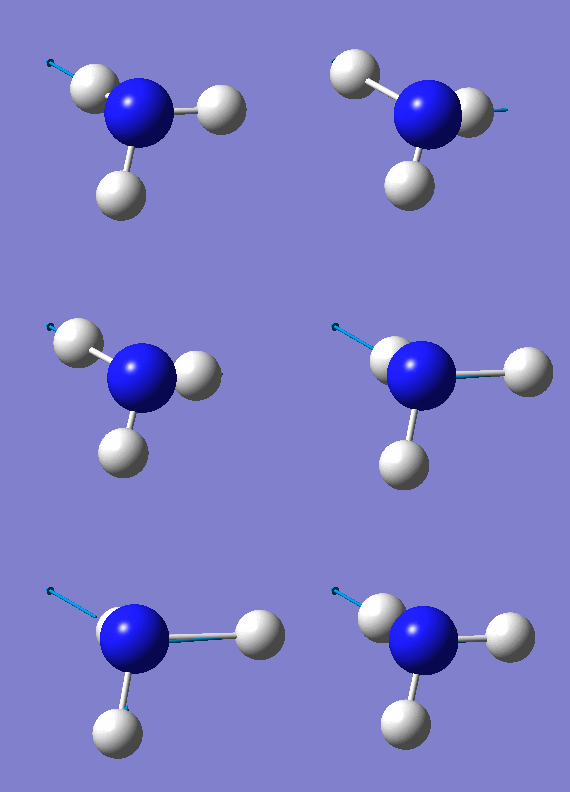
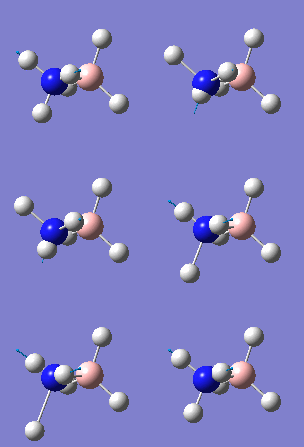
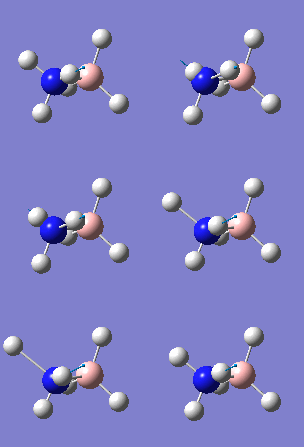
We expect the spectrum to contain 2 sets of degenerate peaks relating to the degenerate stretches and bends (symmetry label E) and two singly degenerate peaks. It is also interesting to note that all of these peaks are Raman active as well as being IR active. The IR spectrum does show all of the expected peaks, with modes 5 & 6 being of very low intensity which could easily have been mistaken for not being present.
NBO Analysis
The data repository file can be found [here] and the [log file] The images below show the charge distribution on the NH3 molecules. It is evident that most of the charge is present on the nitrogen and this is in accordance with what is expected when considering electro-negativities. The electronegative nitrogen has an inductive electron withdraw from the adjacent hydrogens resulting in each being slightly positive.
It is also important to note that the sum of this distribution equals to zero, which is mandatory for it to be a neutral molecule overall. The charge range for the image below is -1.125 to +1.125

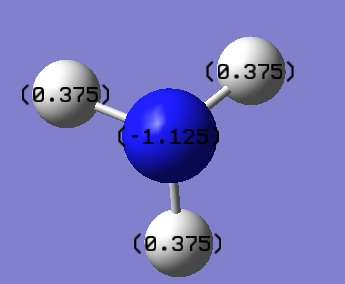
The same quantitative charges can be found in the log file as shown below,
 Summary of Natural Population Analysis:

                                       Natural Population
                Natural  -----------------------------------------------
    Atom  No    Charge         Core      Valence    Rydberg      Total
 -----------------------------------------------------------------------
      N    1   -1.12515      1.99982     6.11104    0.01429     8.12515
      H    2    0.37505      0.00000     0.62250    0.00246     0.62495
      H    3    0.37505      0.00000     0.62250    0.00246     0.62495
      H    4    0.37505      0.00000     0.62249    0.00246     0.62495
 =======================================================================
The table below accounts fully for the number of electrons in the system. Nitrogen contributes 7 electrons to the total count and each hydrogen contributes 1 electron. 2 of the electrons from nitrogen will occupy the 1s orbital and will not be involved in bonding due to lying too low in energy which is shown below. The percentage of s-character to p-character of the bonds between N-H show a (25:75) indicating sp3. This result shows that the lonepair occupies one of these hybrid orbitals. Each bond shows that most of the contribution originates from the nitrogen atom (contributing 68.83%).
(1.99982) CR ( 1) N 1 s(100.00%)
(1.99721) LP ( 1) N 1 s( 25.38%)p 2.94( 74.52%)d 0.00( 0.10%)
       (Occupancy)   Bond orbital/ Coefficients/ Hybrids
 ---------------------------------------------------------------------------------
     1. (1.99909) BD ( 1) N   1 - H   2
                ( 68.83%)   0.8297* N   1 s( 24.87%)p 3.02( 75.05%)d 0.00(  0.09%)
                                           -0.0001 -0.4986 -0.0059  0.0000 -0.2910
                                            0.0052  0.8155  0.0277  0.0000  0.0000
                                            0.0281  0.0000  0.0000  0.0032  0.0082
                ( 31.17%)   0.5583* H   2 s( 99.91%)p 0.00(  0.09%)
                                           -0.9996  0.0000  0.0072 -0.0289  0.0000
     2. (1.99909) BD ( 1) N   1 - H   3
                ( 68.83%)   0.8297* N   1 s( 24.86%)p 3.02( 75.05%)d 0.00(  0.09%)
                                            0.0001  0.4986  0.0059  0.0000  0.2910
                                           -0.0052  0.4077  0.0138  0.7062  0.0240
                                            0.0140  0.0243  0.0076  0.0033  0.0031
                ( 31.17%)   0.5583* H   3 s( 99.91%)p 0.00(  0.09%)
                                            0.9996  0.0000 -0.0072 -0.0145 -0.0250
     3. (1.99909) BD ( 1) N   1 - H   4
                ( 68.83%)   0.8297* N   1 s( 24.87%)p 3.02( 75.05%)d 0.00(  0.09%)
                                            0.0001  0.4986  0.0059  0.0000  0.2909
                                           -0.0052  0.4077  0.0138 -0.7062 -0.0239
                                            0.0140 -0.0243 -0.0076  0.0033  0.0031
                ( 31.17%)   0.5583* H   4 s( 99.91%)p 0.00(  0.09%)
                                            0.9996  0.0000 -0.0072 -0.0145  0.0250
     4. (1.99982) CR ( 1) N   1           s(100.00%)
                                            1.0000 -0.0002  0.0000  0.0000  0.0000
                                            0.0000  0.0000  0.0000  0.0000  0.0000
                                            0.0000  0.0000  0.0000  0.0000  0.0000
     5. (1.99721) LP ( 1) N   1           s( 25.38%)p 2.94( 74.52%)d 0.00(  0.10%)
                                            0.0001  0.5036 -0.0120  0.0000 -0.8618
                                            0.0505  0.0000  0.0000  0.0000  0.0000
                                            0.0000  0.0000  0.0000 -0.0269  0.0155
NH3BH3
The data repository data can be found [here]. Additional keywords of opt=tight int=ultrafine scf=conver=9 were used.
| Property | Value |
|---|---|
| File Name | JG_NH3BH3_OPT_631G_DP_KEYWORDS |
| File Type | .log |
| Calculation Type | FOPT |
| Calculation Method | RB3LYP |
| Basis Set | 6-31G(d,p) |
| Charge | 0 |
| Spin | Singlet |
| Energy | -83.22468905 a.u. |
| RMS Gradient Norm | 0.00000032 a.u. |
| Dipole Moment | 5.56 D |
| Point Group | C1 |
| Time Taken | 2 minute and 13.0 seconds |
         Item               Value     Threshold  Converged?
 Maximum Force            0.000001     0.000002     YES
 RMS     Force            0.000000     0.000001     YES
 Maximum Displacement     0.000005     0.000006     YES
 RMS     Displacement     0.000001     0.000004     YES
 Predicted change in Energy=-3.602435D-12
 Optimization completed.
    -- Stationary point found.
Frequency
The vibrational log file can be found [here]
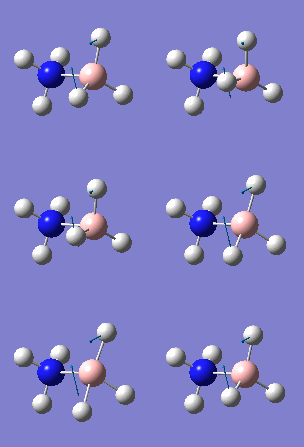
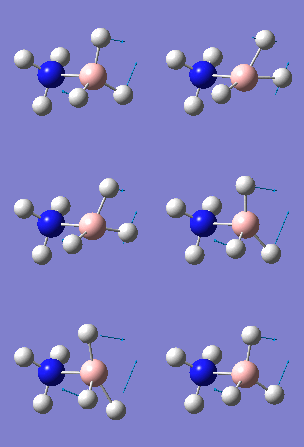
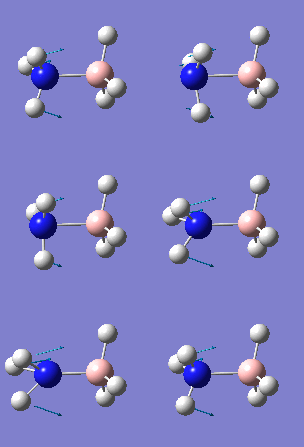
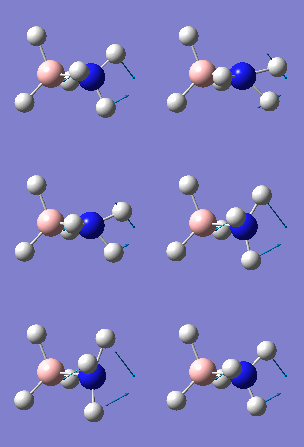
 Low frequencies ---   -3.2973   -0.8316   -0.0005    0.0006    0.0007    3.6363
 Low frequencies ---  263.3606  632.9721  638.4401
| Property | Value |
|---|---|
| File Name | JG_NH3BH3_OPT_631G_DP_keywords_FREQ |
| File Type | .log |
| Calculation Type | FREQ |
| Calculation Method | RB3LYP |
| Basis Set | 6-31G(d,p) |
| Charge | 0 |
| Spin | Singlet |
| Energy | -83.22468911 a.u. |
| RMS Gradient Norm | 0.00000025 a.u. |
| Dipole Moment | 5.56 D |
| Point Group | C1 |
| Time Taken | 1 minute and 12 seconds |
NBO Analysis
The data repository file which also contains the log file can be found [here]
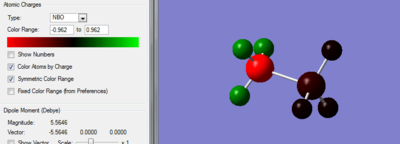
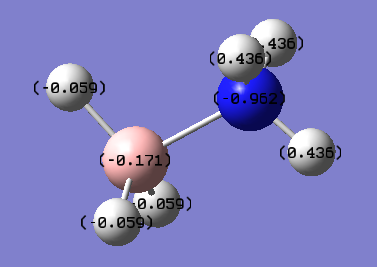
The sum of the charge distribution on the nitrogen fragment reveals an overall positive charge of 0.346 and the sum of the charges on the boron fragment adds to -0.348. The qualitative picture is what is expected since a nitrogen acting as a Lewis base donates its lone pair of electrons resulting in a loss of electron density. The Lewis acidic boron accepts a pair of electrons resulting in an increased negative character of the fragment. The hydrogen atoms on this boron fragment are also negative, indicating donation of the lone pair to a molecular orbital, i.e. the lumo.
The E2 energy values had no contributions over 20 kcal/mol. The ideal of the bond being a dative type interaction is further backed up with the contribution data shown below,
     7. (1.99380) BD ( 1) B   7 - N   8
                ( 18.12%)   0.4257* B   7 s( 15.49%)p 5.44( 84.25%)d 0.02(  0.26%)
                                            0.0001  0.3931 -0.0205  0.0003 -0.9175
                                           -0.0262  0.0000  0.0000  0.0000  0.0000
                                            0.0000  0.0000  0.0000  0.0439 -0.0253
                ( 81.88%)   0.9049* N   8 s( 35.34%)p 1.83( 64.66%)d 0.00(  0.00%)
                                            0.0001  0.5942  0.0161  0.0003  0.8030
                                           -0.0434  0.0000  0.0000  0.0000  0.0000
                                            0.0000  0.0000  0.0000 -0.0021  0.0012
It is evident that approx. 82% of the electron density is originating from the nitrogen atom. The orbital of the boron has high p-character (85%) which is in accordance of the BH3 fragment being trigonal planar with a vacant p-orbital.
Looking at the acceptor orbital, i.e. the LUMO of BH3 we see the planar vacant p-orbital

This has good overlap with the HOMO orbital of the NH3 fragment

(NOTE: log files for fragments can be found in the corresponding fragment sections of this wiki)
Association Energies
| Fragment | Energy (a.u.) |
|---|---|
| BH3 | -26.61532360 |
| NH3 | -56.55776856 |
| NH3BH3 | -83.22468905 |
Thus we have,
Converting this energy to kJ mol-1 we need to multiply the energy by Na and also by a factor of 4.3598×10⁻¹⁸ to convert into joules per mole. Finally we need to divide by 103 to convert into kilo joules.
This yields an answer of -135.47 kJ mol-1 for the association energy. This is a negative number implying that energy is released from the formation of this compound, i.e. an exothermic process. This appears to be a suitable value as normal bond energies are in the region of 100-600 kJ mol-1 (positive since energy is required to break the bond).
References
- ↑ K. Kawaguchi, J. Chem. Phys., 1992,96, 3411,[DOI:10.1063/1.461942]
- ↑ B. Reffy; M. Kolonits; M. Hargittai, J. Mol. Struct., 1998, 445 139-148, [DOI:10.1016/S0022-2860(97)00420-1]
- ↑ G. Santiso-Quiñones; I. Krossing, Z.Anorg. Allg. Chem., 2008, 634, 4, 707-707 [DOI:10.1002/zaac.200700510]

