Rep:Mod:tyuio598plm
The Cope Rearrangement
The Cope Rearrangement [1] is a thermal isomerisation involving the [3,3]-sigmatropic shift rearrangement of 1,5-dienes. Its mechanism is believed to happen in a concerted manner via a six-membered transition state that has either a "chair" or a "boat" geometry. In this section, the Cope rearrangement of 1,5-hexadiene was studied. Its energies associated with the transition states was calculated in order to make a prediction of the expected experimental results.

Optimising the reactants and products
Optimisation of 1,5-hexadiene with Hartree Fock/3-21G basis set
Anti 2
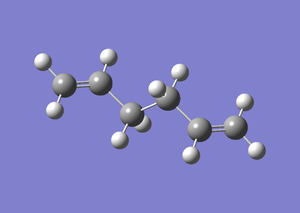
The 1,5-hexadiene molecule was generated using GaussView. The molecule was adjusted into an anti-periplananr conformation by setting the dihedral angle of the four carbon atoms in the middle to be 180°. The structure was then optimised using the low expense Hartree-Fock method with the 3-21 basis set. A summary of the calculation was shown in the table below. Optimisation was completed with RMS Gradient Norm ≈ 0. The energy and point group of the structure matched up with the anti2 molecule shown in Appendix 1.
| Property | Value |
|---|---|
| File Type | .log |
| Calculation Type | FOPT |
| Calculation Method | RHF |
| Basis Set | 3-21G |
| Final Energy / a.u. | -231.6925353 |
| RMS Gradient Norm / a.u. | 0.00001891 |
| Dipole Moment / Debye | 0.0000 |
| Point Group | Ci |
| Calculation Time / s | 17.0 |
Item Value Threshold Converged? Maximum Force 0.000060 0.000450 YES RMS Force 0.000010 0.000300 YES Maximum Displacement 0.000516 0.001800 YES RMS Displacement 0.000171 0.001200 YES Predicted change in Energy=-2.036921D-08 Optimization completed. |
|
Gaussian optimises the molecule by taking the first derivative of its potential energy surface and finding a point where this value = 0. However, mathematically, a gradient = 0 from the optimisation only suggests that the point obtained is either a turning point, maxima or minima. Frequency analysis, the second derivative of the same molecular potential surface, is therefore necessary to ensure that the optimised structure is a minima. From the mathematical perspective, a positive second derivation would suggests that a minima is obtained from the optimisation calculation and that the structure is at equilibrium. If the second derivative is negative, this would mean that a maxima is obtained from the optmisation calculation. This structure depicts the transition state of the reaction instead.
Frequency analysis was carried out to confirm that the optimised structure is indeed the minimum energy structure. The small low frequencies (within the limits of ± 15 cm-1) and the absence of imaginary frequencies indicated that a minimum has been reached.
 Low frequencies ---   -5.6598   -2.3669   -2.0888   -0.0004   -0.0002    0.0001
 Low frequencies ---   71.1989   85.6855  116.1454
Gauche 6
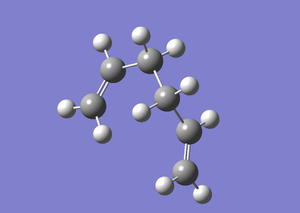
A gauche conformer of the 1,5-hexadiene molecule was then generated by adjusting the same dihedral angle to be 60°. The structure was optimised by Gaussian using the same Hartree-Fock method with 3-21G basis set. A summary of the calculation was tabulated below. Optimisation was completed with small value of RMS Gradient Norm obtained. A comparison of the energy and point group of the molecule with Appendix 1 indicated that this conformer was Gauche 6.
| Property | Value |
|---|---|
| File Type | .log |
| Calculation Type | FOPT |
| Calculation Method | RHF |
| Basis Set | 3-21G |
| Final Energy / a.u. | -231.68916020 |
| RMS Gradient Norm / a.u. | 0.00000624 |
| Dipole Moment / Debye | 0.5362 |
| Point Group | C1 |
| Calculation Time | 1 min 32.0 s |
Item Value Threshold Converged? Maximum Force 0.000014 0.000450 YES RMS Force 0.000004 0.000300 YES Maximum Displacement 0.000575 0.001800 YES RMS Displacement 0.000144 0.001200 YES Predicted change in Energy=-4.876250D-09 Optimization completed. |
|
Similarly, frequency analysis was carried out to confirm that the structure obtained was a minimum. No imaginary frequency was observed and the small low frequencies indicated that the conformer was indeed the minimum energy structure.
 Low frequencies ---   -1.2000   -0.0008   -0.0007   -0.0005    0.3524    1.6452
 Low frequencies ---   87.1916  121.7301  142.2233
Comparison of energies of all conformations
Selected conformers of the ten shown in [Appendix 1] were built using GaussView and optimised with the same HF/3-21G basis set. A summary of the calculation was presented in the table below. An anti-periplanar conformer was expected to have the lowest energy due to low steric hindrance between the alkyl groups. However, a closer look at the energies of all the conformations would show that this is not the case. Gauche 3 conformer has the lowest energy. This could perhaps be rationalised by the enhanced orbital overlap in this structural geometry, providing extra stabilisation to the molecule.
| Geometry | Energy / a.u. | Energy given in Appendix / a.u. | Jmol | Point Group |
|---|---|---|---|---|
| Anti-periplanar 2 | -231.69253528 | -231.69254 | Ci | |
| Anti-periplanar 4 | -231.69097055 | -231.69097 | C1 | |
| Gauche 2 | -231.69166700 | -231.69167 | C2 | |
| Gauche 3 | -231.69266122 | -231.69266 | C1 | |
| Gauche 6 | -231.68916020 | -231.68916 | C1 |
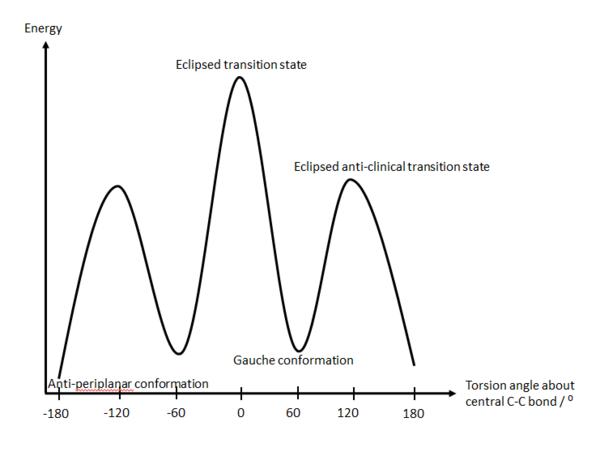
The diagram below illustrates how the energy of the conformer varies upon changing the dihedral angle. The peaks (maxima) depict the transition states whereas the troughs (minima) represent energy minima.
Optimisation and frequency analysis of 1,5-hexadiene with B3LYP/6-31G*
In order to obtain a more accurate result, the Anti 2 conformer was optimised again with the B3LYP/6-31G* basis set. A summary of the calculation was tabulated below. Optimisation was successful with low RMS Gradient Norm value obtained.
| Property | Value |
|---|---|
| File Type | .log |
| Calculation Type | FOPT |
| Calculation Method | RB3LYP |
| Basis Set | 6-31G(d) |
| Final Energy / a.u. | -234.61172164 |
| RMS Gradient Norm / a.u. | 0.00001043 |
| Dipole Moment / Debye | 0.0000 |
| Point Group | Ci |
| Calculation Time / s | 53.0 |
Item Value Threshold Converged? Maximum Force 0.000031 0.000450 YES RMS Force 0.000005 0.000300 YES Maximum Displacement 0.000550 0.001800 YES RMS Displacement 0.000196 0.001200 YES Predicted change in Energy=-8.379752D-09 Optimization completed. |
|
Once again, frequency analysis was carried out on the optimised structure. Similarly, the absence of imaginary frequency and the small low frequencies indicated that the optimised structure was indeed the minimum energy structure.
 Low frequencies ---   -6.6640   -0.0007   -0.0007    0.0007    6.8908   21.4840
 Low frequencies ---   76.6442   83.5644  122.5035
Comparison of results of using different methods and basis sets
Various bond lengths and bond angles of the optimised structures obtained above using different methods and basis sets were compared. A summary was presented in the table below.
| Bond length / Å | Bond angle / ° | Final Energy / a.u. | ||||
|---|---|---|---|---|---|---|
| C1=C2 / C5=C6 | C1-C3 / C4-C5 | C3-C4 | C2=C1-C3 / C4-C5=C6 | C1-C3-C4 / C4-C5-C6 | ||
| HF/3-21G | 1.32 | 1.51 | 1.55 | 124.8 | 111.3 | -231.6925353 |
| B3LYP/6-31G | 1.33 | 1.50 | 1.55 | 125.3 | 112.7 | -234.6117216 |
It can be observed that varying the method and basis set used in calculation does not affect the geometry of the structure much. However, it is noteworthy that there was a significant difference in energies between the optimised structures. This is because different theories are based on different assumptions. These calculations utilise different methods, i.e. HF and DFT (first degree of approximations of the Schrödinger's equation) and are based on different degree of numerical approximations, i.e. 3-21G and 6-31G (second degree of approximations of the Schrödinger's equation). It therefore does not make sense to compare energies of the molecules optimised using different theories.
Thermochemistry
The thermodynamic quantities were obtained from the frequency analysis of anti2 conformer with B3LYP/6-31G basis set. The analysis were carried out at two temperatures (i.e. 298.15 K and 0.0001 K) and a summary of the calculation was presented below.
| Energy | 298.15 K / a.u. | 0.0001 K / a.u. |
|---|---|---|
| Sum of electronic and zero-point Energies | -234.469181 | -234.469181 |
| Sum of electronic and thermal Energies | -234.461849 | -234.469181 |
| Sum of electronic and thermal Enthalpies | -234.460905 | -234.469181 |
| Sum of electronic and thermal Free Energies | -234.500697 | -234.469181 |
The first term represents the potential energy at 0 K and the zero-point energy (E = Eelec + Z.P.E.). The second term corresponds to the energy contribution from translation, vibration and rotation at 298.15 K and 1 atm (E = E + Etrans + Erot + Evib). The third term includes correction for room temperature (H = E + RT) while the last term takes into account the entropic contribution to the free energy (G = H + TS).
As expected, at 0.0001 K (close to absolute zero), the translational, rotational and vibrational energies are frozen out and all quantities are equal to their corresponding zero point energies with no energy contribution from other terms.
Optimising the "chair" and "boat" transition structures
There are two possible transition states for the Cope rearrangement of 1,5-hexadiene, the boat form and the chair form. The latter is expected to have lower activation energy. Three different methods were used to optimise and investigate these transition states, the Hessian method, the frozen coordinate method as well as the QST2 method.

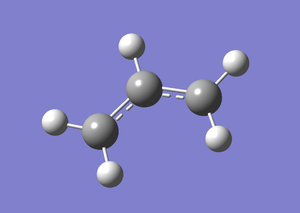
An allyl fragment was generated with GaussView and optimised using HF/3-21G basis set. This optimised fragment was used in the transition states analysis. A summary of the calculation was shown in the table below. Optimisation was successful with small RMS Gradient Norm obtained.
| Property | Value |
|---|---|
| File Type | .log |
| Calculation Type | FOPT |
| Calculation Method | UHF |
| Basis Set | 3-21G |
| Final Energy / a.u. | -115.82304004 |
| RMS Gradient Norm / a.u. | 0.00002872 |
| Dipole Moment / Debye | 0.0293 |
| Point Group | C1 |
| Calculation Time / s | 19.0 |
Item Value Threshold Converged? Maximum Force 0.000072 0.000450 YES RMS Force 0.000028 0.000300 YES Maximum Displacement 0.000859 0.001800 YES RMS Displacement 0.000347 0.001200 YES Predicted change in Energy=-9.020296D-08 Optimization completed. |
|
Optimising the "chair" transition state
Two methods were used to optimise the "chair" transition state. The first Hessian method involves predicting the transition structure directly and computing its force constant matrix. This method, however, is unreliable if the guess structure differs a lot from the actual structure. A more accurate structure of transition state can be generated from the frozen coordinate method. This involves initially "freezing" the terminal carbons of the allyl fragments directly involved in the transition state and minimising the rest of the molecule, which is then followed by optimisation of the "unfrozen" the reaction coordinates (derivative of the previous step).
Hessian method
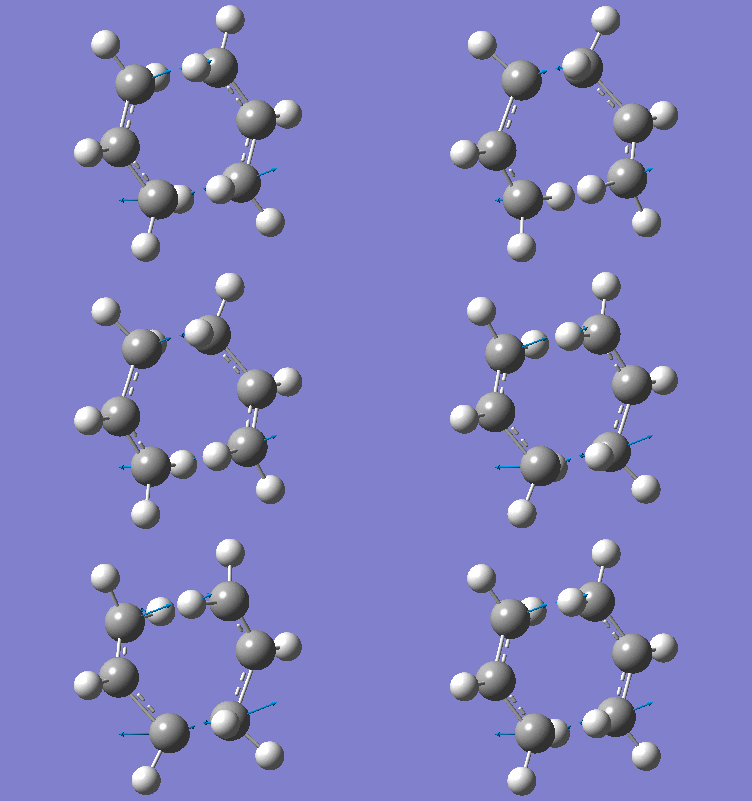
Two of the previously optimised allyl fragments were arranged into a "chair-like" structure. The terminal carbons of the two fragments were adjusted manually to be 2.20 Å apart from each other. This structure was then optimised (Opt+Freq) to a transition state (Berny) with force constants calculated once using Gaussian (HF/3-21G) along with the following keyword to prevent termination of calculation in case of imaginary frequencies.
Opt=NoEigen
A summary of the calculation was tabulated below.
| Property | Value |
|---|---|
| File Type | .log |
| Calculation Type | FREQ |
| Calculation Method | RHF |
| Basis Set | 3-21G |
| Final Energy / a.u. | -231.61932248 |
| RMS Gradient Norm / a.u. | 0.00000328 |
| Dipole Moment / Debye | 0.0001 |
| Point Group | C1 |
| Calculation Time / s | 6.0 |
Item Value Threshold Converged? Maximum Force 0.000008 0.000450 YES RMS Force 0.000002 0.000300 YES Maximum Displacement 0.000197 0.001800 YES RMS Displacement 0.000043 0.001200 YES Predicted change in Energy=-2.020369D-09 Optimization completed. |
|
The above results indicated that the calculation was successful in converging to a stationary point which denotes the transition state. An imaginary frequency at -818 cm-1 was observed and this corresponds to the transition state. Animating the vibrational mode at this frequency shows that the motion of the molecule resembles the Cope rearrangement, with one C-C bond forming and another C-C bond breaking in a concerted manner. As expected, the distance between the terminal carbons is 2.02 Å, which falls in between the bond length of a single C-C bond and the sum of the Van der Waals radii of two carbon atoms.
Frozen coordinate method
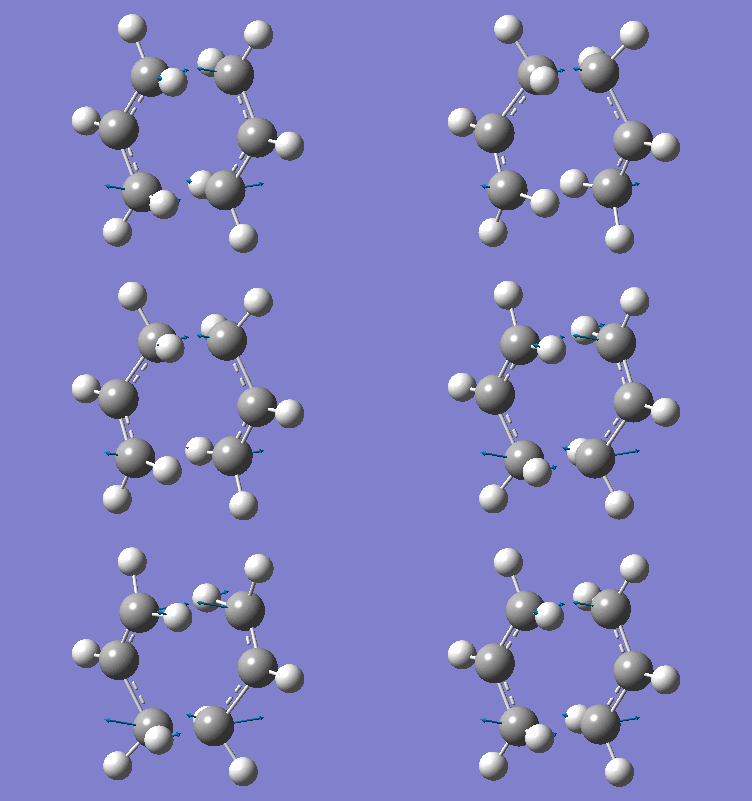
The optimised ally fragments were orientated in a similar fashion as that in the Hessian method with the terminal carbons from different fragments being 2.20 Å apart from each other. These carbon atoms which are directly involved in bond breaking and bond formation during the Cope rearrangement were "frozen" (using the redundant coordinate editor) while the rest of the molecules were optimised. This was followed by "unfreezing" the carbon atoms and optimising (Opt+Freq) the derivative from the previously frozen molecules. A summary of the calculation was tabulated below.
| Property | Value |
|---|---|
| File Type | .log |
| Calculation Type | FREQ |
| Calculation Method | RHF |
| Basis Set | 3-21G |
| Final Energy / a.u. | -231.61932228 |
| RMS Gradient Norm / a.u. | 0.00002261 |
| Dipole Moment / Debye | 0.0005 |
| Point Group | C1 |
| Calculation Time / s | 6.0 |
Item Value Threshold Converged? Maximum Force 0.000080 0.000450 YES RMS Force 0.000022 0.000300 YES Maximum Displacement 0.001552 0.001800 YES RMS Displacement 0.000396 0.001200 YES Predicted change in Energy=-1.970024D-07 Optimization completed. | |
Optimisation was successful with an imaginary frequency at -818 cm-1 indicative of the transition state. Animating the vibrational mode at this frequency shows that the motion represents the transition structure of the Cope rearrangement, with C-C bond formation and C-C bond breaking occurring in a concerted manner. The distance between the two terminal carbons of different fragments was found to be 2.02 Å. As discussed above, this is expected as it falls in between a C-C single bond length and the sum of the Van der Waals radii of two carbon atoms.
Optimising the "boat" transition state
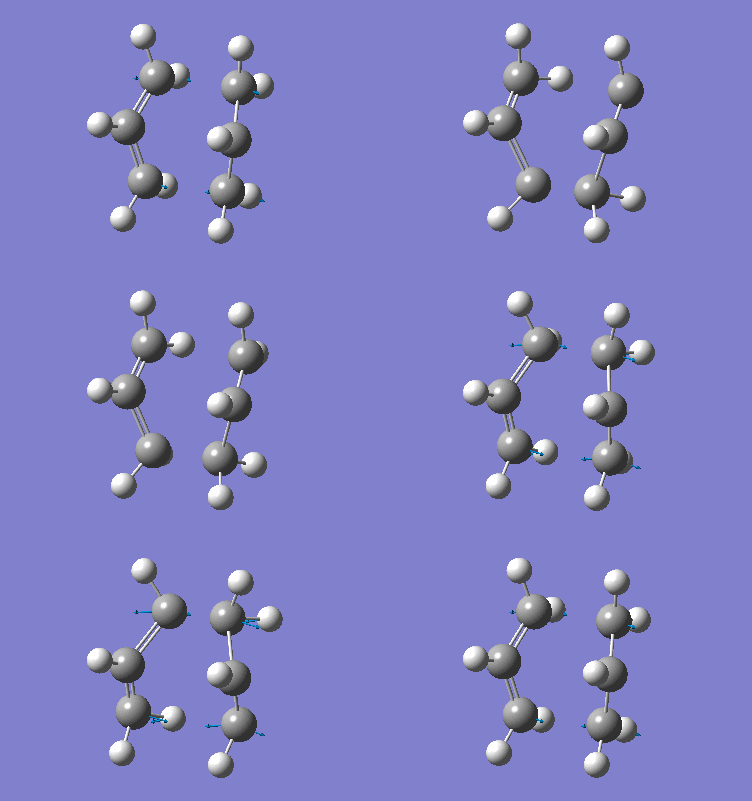
The "boat" transition state was optimised using the QST2 method, in which the reactants and products of a reaction are specified and Gaussian calculates the transition state between them. Two of the previously optimised anti2 conformers were used to resemble the reactant and product with the atoms numbered accordingly. The molecules were orientated to resemble the "boat" structure (C-C-C-C dihedral angles were set to 0° and C-C-C angles were set to 100° on both sides). This is important as the molecules need to be in a geometry close to that of the transition state in order for Gaussian to locate these structures. Optimisation (Opt+Freq) of the molecules with the B3LYP/6-31G basis set was carried out and a summary of the calculations was presented below.
| Property | Value |
|---|---|
| File Type | .log |
| Calculation Type | FREQ |
| Calculation Method | RHF |
| Basis Set | 3-21G |
| Final Energy / a.u. | -231.60280163 |
| RMS Gradient Norm / a.u. | 0.00008936 |
| Dipole Moment / Debye | 0.1578 |
| Point Group | CS |
| Calculation Time / s | 7.0 |
Item Value Threshold Converged? Maximum Force 0.000101 0.000450 YES RMS Force 0.000035 0.000300 YES Maximum Displacement 0.001327 0.001800 YES RMS Displacement 0.000391 0.001200 YES Predicted change in Energy=-6.054164D-07 Optimization completed. |
|
Convergence to a stationary point and the presence of an imaginary frequency indicated that optimisation to the transition structure was successful. Animating the vibrational mode of the imaginary frequency at -840 cm-1 showed that the motion resembles the Cope rearrangement, with one C-C bond breaking and another C-C bond forming in a concerted manner.
Intrinsic reaction coordinate (IRC) calculation
Inspection of the optimised "chair" and "boat" transition structures gives no clue to which conformer the reaction pathways will lead to. IRC method provides a more in-depth analysis on the geometry of the product by following the minimum energy reaction pathway in mass-weighted Cartesian coordinates down-hill from the transition state to the product and reactant (local minimum on a potential energy surface).
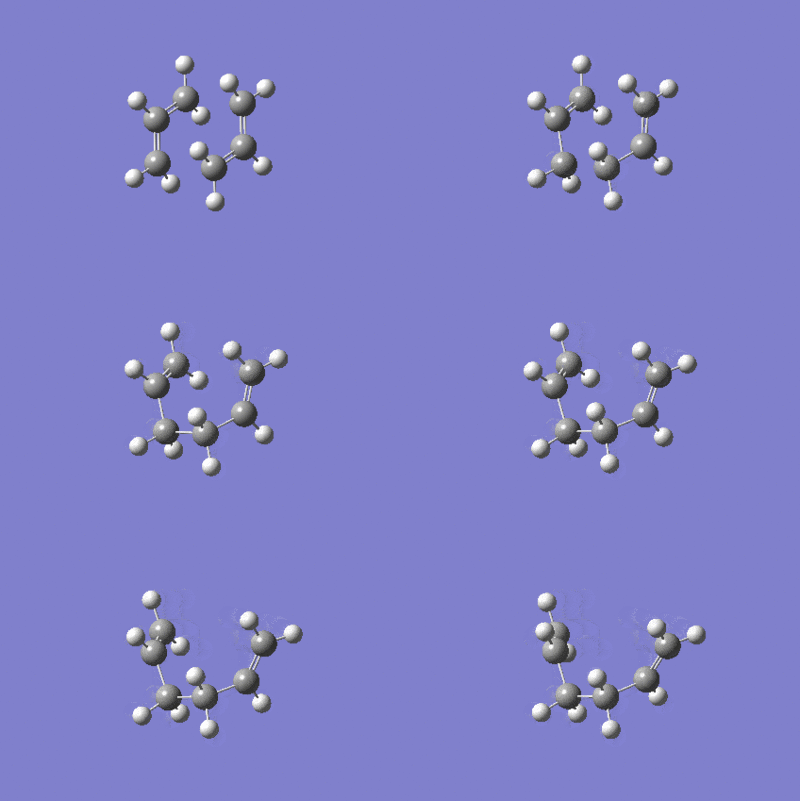
The previously optmised "chair" transition structure was used for IRC calculation with the following settings.
Follow IRC: Forward only Force Constants: Calculate always Compute more points, N = 50
| Property | Value |
|---|---|
| File Type | .log |
| Calculation Type | IRC |
| Final Energy / a.u. | -231.69160349 |
| RMS Gradient Norm / a.u. | 0.00015930 |
| Dipole Moment / Debye | 0.3662 |
| Point Group | C1 |
| Calculation Time | 3 min 22.0 s |
Observation of the results obtained from the calculation showed that after 44 points in the coordinate, the conformation reached a minimum and calculation stopped. The graph of the potential energy against reaction coordinate was shown below. The plateau at the end of the graph showed that the structure has converged to a stationary point (reactant or product).


From the table above, it can be seen that the final structure (from Step 44) has an energy of -231.69160349 a.u., this does not correspond to any of the conformational geometries shown in Appendix 1. Therefore, this final structure was optimised again with the HF/3-21G basis set and the results obtained was tabulated below.
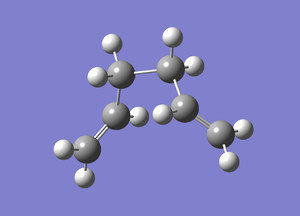
| Property | Value |
|---|---|
| File Type | .log |
| Calculation Type | FOPT |
| Calculation Method | RHF |
| Basis Set | 3-21G |
| Final Energy / a.u. | -231.69166701 |
| RMS Gradient Norm / a.u. | 0.00001318 |
| Dipole Moment / Debye | 0.3800 |
| Point Group | C2 |
| Calculation Time / s | 13.0 |
Item Value Threshold Converged? Maximum Force 0.000048 0.000450 YES RMS Force 0.000009 0.000300 YES Maximum Displacement 0.000875 0.001800 YES RMS Displacement 0.000303 0.001200 YES Predicted change in Energy=-2.165884D-08 Optimization completed. |
|
Optimisation was successful. A minimum geometry with energy = -231.69166701 a.u. was obtained, this corresponds to the gauche2 conformer from Appendix 1.
Activation energies analysis
The "chair" and "boat" transition structures were re-optimised with the B3LYP/6-31G* basis set and their activation energies were compared and tabulated below.
| HF/3-21G (Chair & Boat) | B3LYP/6-31G* (Chair & Boat) | |||||
|---|---|---|---|---|---|---|
| Electronic energy / a.u. | Sum of electronic and zero-point energies / a.u. | Sum of electronic and thermal energies / a.u. | Electronic energy / a.u. | Sum of electronic and zero-point energies / a.u. | Sum of electronic and thermal energies / a.u. | |
| at 0 K | at 298.15 K | at 0 K | at 298.15 K | |||
| "Chair" TS | -231.61932248 | -231.46670100 | -231.46134100 | -234.55698288 | -234.41493200 | -234.40901100 |
| "Boat" TS | -231.60280163 | -231.45092800 | -231.44529900 | -234.54309299 | -234.40234600 | -234.39601000 |
| Reactant (anti2) | -231.69253528 | -231.53953900 | -231.53256500 | -234.61172164 | -234.46918100 | -234.46184900 |
| HF/3-21G | B3LYP/6-31G* | Experimental | |||
|---|---|---|---|---|---|
| at 0 K | at 298.15 K | at 0 K | at 298.15 K | at 0 K | |
| ∆E ("chair" TS) / kcal mol-1 | 45.71 | 44.69 | 34.04 | 33.16 | 33.5 ± 0.5 |
| ∆E ("boat" TS) / kcal mol-1 | 55.60 | 54.76 | 41.94 | 41.31 | 44.7 ± 2.0 |
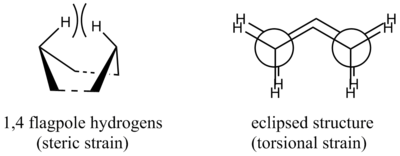
Generally, reaction via the "boat" transition structure has a higher activation energy. This is expected due to two reasons, illustrated in the figure below.
- The eclipsed conformation in "boat" structure results in torsional strain between the bonds, raising the energy of the conformer.
- The flagpole interaction between the para-hydrogens results in steric strain, increasing the energy of the structure.
It can be seen that optimisation with the B3LYP/6-31G basis set yielded results which are in closer agreement with the experimental values. This is expected as this method takes into account polarisation of atoms with improved modelling of core electrons, thereby generating better results at the expanse of longer calculation time. Another observation is that the activation energies of both the "chair" and "boat" pathways decrease with an increase in temperature.
The Diels Alder Cycloaddition
The Diels Alder reaction [2]is a [4+2] cycloaddition between an electron-rich conjugated diene and a dieneophile (substituted olefin), forming cyclohexene.In this section, two Diels Alder reactions were studied. The HOMO and LUMO of both the reactants and the transition states were computed and analysed. Thereafter, IRC calculations were carried out to investigate the exact reaction pathways.
Diels Alder reaction between cis-butadiene and ethene
The Diels Alder reaction between cis-butadiene and ethene was studied. The HOMO and LUMO responsible for the cycloaddition were investigated and the reaction pathway was examined from the IRC calculation. Activation energies at different temperatures were calculated and compared with literature.

Optimisation and HOMO-LUMO analysis of cis-butadiene
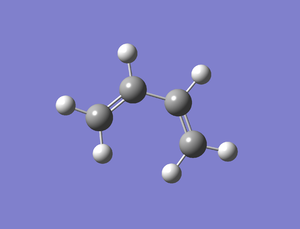
Cis-butadiene was built on GaussView from an n-butyl fragment. The C-C-C-C dihedral angle was set to be 0°. The molecules was optimised with the semi-empirical/AM1 basis set. A summary of the calculation was tabulated below.
| Property | Value |
|---|---|
| File Type | .log |
| Calculation Type | FOPT |
| Calculation Method | RAM1 |
| Basis Set | ZDO |
| Final Energy / a.u. | 0.04879719 |
| RMS Gradient Norm / a.u. | 0.00001745 |
| Dipole Moment / Debye | 0.0414 |
| Point Group | C1 |
| Calculation Time / s | 15.0 |
Item Value Threshold Converged? Maximum Force 0.000030 0.000450 YES RMS Force 0.000011 0.000300 YES Maximum Displacement 0.000378 0.001800 YES RMS Displacement 0.000162 0.001200 YES Predicted change in Energy=-9.691079D-09 Optimization completed. |
|
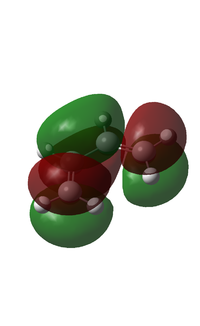
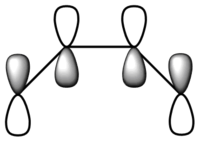
The HOMO and LUMO were computed and shown below.
| HOMO | LUMO | |
|---|---|---|
| Visualised MO |  |
|
| LCAO | 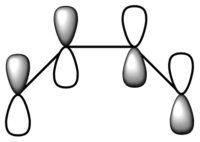 |
|
| Symmetry | Asymmetric | Symmetric |
From the figure above, it can be seen that the HOMO has one node and is asymmetric about the plane of symmetry. On the other hand, the LUMO has two nodes and is symmetric about the plane of symmetry.
Optimisation and HOMO-LUMO analysis of ethene
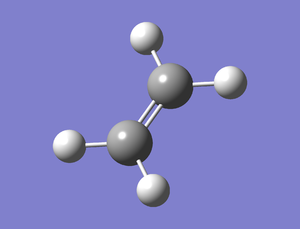
Similarly, ethene was built on GaussView from an ethyl fragment and optimised with the semi-empirical/AM1 basis set. A summary of the calculation was tabulated below.
| Property | Value |
|---|---|
| Calculation Type | FOPT |
| Calculation Method | RAM1 |
| Basis Set | ZDO |
| Final Energy / a.u. | 0.02619027 |
| RMS Gradient Norm / a.u. | 0.00003328 |
| Dipole Moment / Debye | 0.0000 |
| Point Group | C2h |
| Calculation Time / s | 11.0 |
Item Value Threshold Converged? Maximum Force 0.000162 0.000450 YES RMS Force 0.000049 0.000300 YES Maximum Displacement 0.000414 0.001800 YES RMS Displacement 0.000220 0.001200 YES Predicted change in Energy=-3.787282D-08 Optimization completed. |
|
The HOMO and LUMO were computed and shown below.
| HOMO | LUMO | |
|---|---|---|
| Visualised MO |  |

|
| LCAO |  |

|
| Symmetry | Symmetric | Asymmetric |
From the figure above, it can be seen that the HOMO has one node and is symmetric about the plane of symmetry. On the other hand, the LUMO has two nodes and is asymmetric about the plane of symmetry. Opposite to cisbutadiene???
Transition state analysis
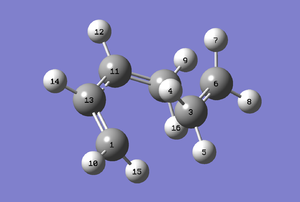
The transition structure for the reaction between cis-butadiene and ethene was constructed by first drawing the bicycle [2,2,2]-octane, then removing the -CH2-CH2- fragment. From the calculations above, it can be seen that the Hessian method and the frozen coordinate method produce similar results. As this reaction is fairly simple and the geometry of the transition structure can be easily predicted, the Hessian method was used in this computational study. The predicted transition structure is shown below, with distance between the terminal carbons adjusted to 2.20 Å. This structure was optimised (Opt+Freq) to a TS(Berny) using the B3LYP/6-31G* basis set. The results from the calculation was tabulated below.
| Property | Value |
|---|---|
| File Type | .log |
| Calculation Type | FTS |
| Calculation Method | RB3LYP |
| Basis Set | 6-31G(d) |
| Final Energy / a.u. | -234.5438965 |
| RMS Gradient Norm / a.u. | 0.00002584 |
| Dipole Moment / Debye | 0.3946 |
| Point Group | C1 |
| Calculation Time | 8 min 18.0 s |
Item Value Threshold Converged? Maximum Force 0.000098 0.000450 YES RMS Force 0.000015 0.000300 YES Maximum Displacement 0.000521 0.001800 YES RMS Displacement 0.000158 0.001200 YES Predicted change in Energy=-4.198473D-08 Optimization completed. |
|
From the results obtained, it can be seen that the terminal carbons have a separation of 2.27 Å, which is in good agreement with literature value. It is interesting to note that this distance is in between the sum of the Van der Waals radii of two carbon atoms (3.40 Å) and the lengths of typical sp2 (1.34 Å) and sp3 (1.54 Å) C-C bonds. This goes on to show that this is a transition structure for the cycloaddition reaction, i.e. a bond has not yet been formed between the terminal carbons and there is a bonding interaction between the terminal carbons. Similarly, the C-C bond in the middle of the cis-butadiene has a bond length of 1.41 Å, which is in between the length of an sp2 and an sp3 C-C bond, indicating a partially formed π-bond in the transition state.
 Low frequencies --- -524.7845   -6.8506   -0.0002    0.0001    0.0008    8.4230
 Low frequencies ---   19.2462  135.5904  203.7622
The results from frequency analysis showed that a negative frequency at -525 cm-1, i.e. an imaginary frequency, was present. This indicates that the optimised structure is at a transition state. In order to determine if this transition state corresponds to that of the cycloaddition reaction, the mode of vibration at this frequency was animated.
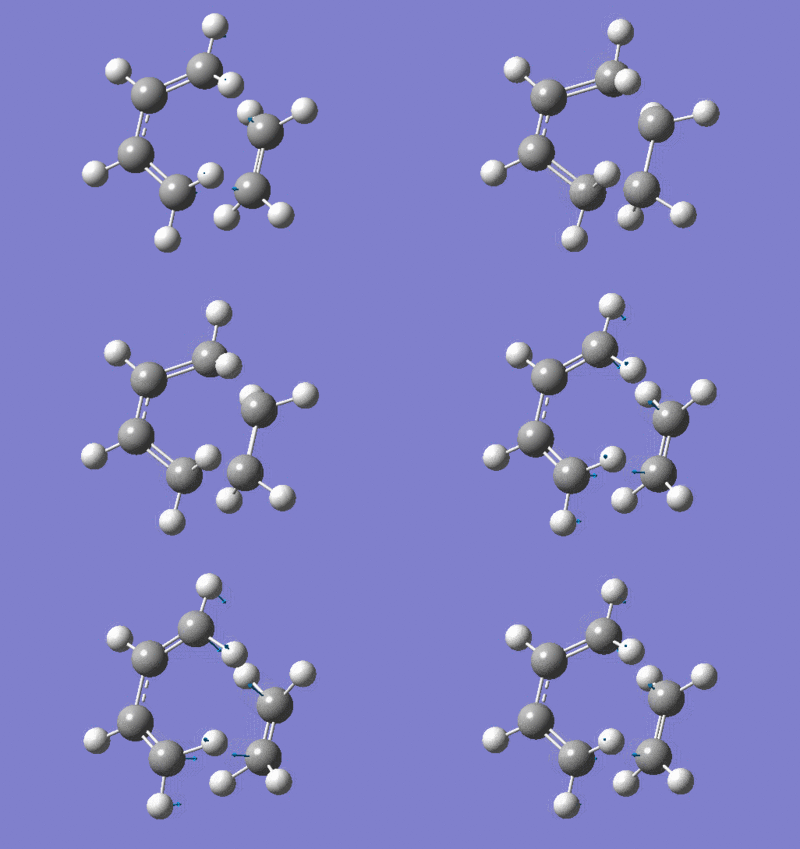
The above animation corresponds to the two symmetric and synchronous C-C σ-bond formation in the Diels Alder reaction. Therefore, it can be concluded that the optimised transition structure is the one for the cycloaddition reaction. As discussed above, optimisation is the first derivative of the potential energy surface (i.e. gradient = 0), whereas frequency analysis is the second derivative of the same surface. Mathematically, it is apparent that a negative frequency (imaginary frequency) corresponds a maximum on the energy plot, i.e. a transition state. Conversely, a positive frequency (real frequency) indicates that the stationary point is a minimum on the energy plot, i.e. the reactant or the product.

Animating the vibrational mode of the lowest positive frequency at 136 cm-1 showed the asymmetrical stretching of the partially formed σ-bond. This stretching is expected to appear on the IR spectrum.
HOMO-LUMO analysis
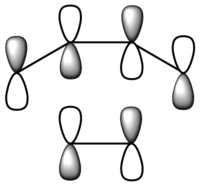
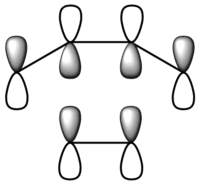
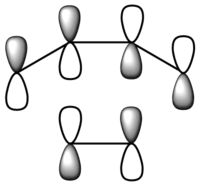
The HOMO and LUMO of the transition structures were visualised using GaussView. Some of the MOs were presented below, alongside corresponding LCAO illustrations.
| Mos | Energy / a.u. | Visualised Mos | LCAO |
|---|---|---|---|
| 25 | -0.01958 | 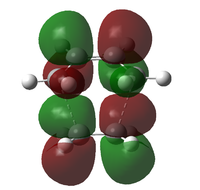 |
|
| 24 | -0.00860 | 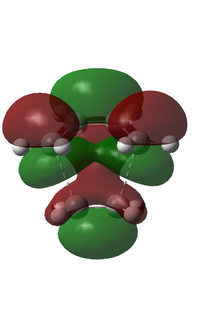 |
|
| 23 | -0.21898 | 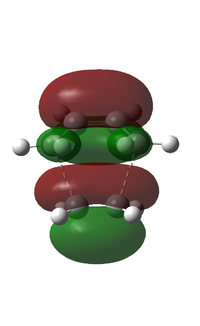 |

|
| 22 | -0.22108 | 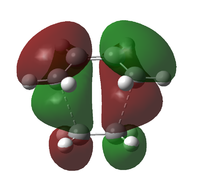 |
|
A comparison with the HOMO and LUMO of the reactants suggests that the HOMO of cis-butadiene interacts with the LUMO of ethene, resulting in the asymmetric HOMO in the transition structure. This reaction is allowed as a result of the strong HOMO-LUMO interaction arises from the small energy gap between interacting orbitals of the reactants, as well as the favourable overlap of electron density. As the MOs are very close in energy, using a different method and / or basis set for calculation might result in re-ordering of the MOs.
IRC analysis
An IRC calculation was carried out to examine the reaction pathway. It was found that the system successfully converge to a constant value in 55 steps. Inspection at the results showed that the transition structure generated in the previous section was indeed that of the Diels Alder reaction.
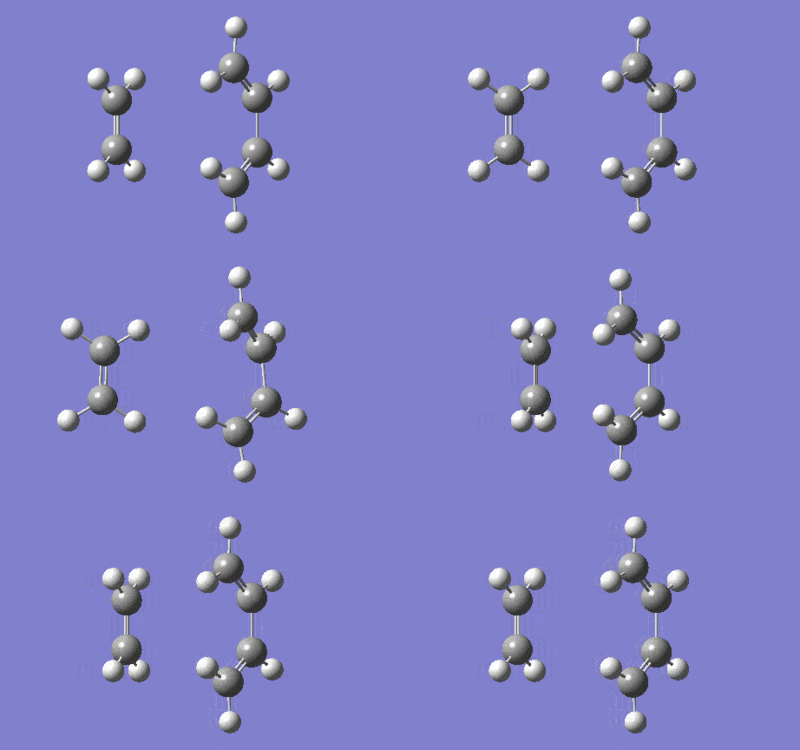


The plateau at the end of the energy plot indicated that the system has converged to a stationary point. It should be noted that Gaussian considers the forward and reverse reaction (with forward being the cycloaddition reaction) as equivalent, and has calculated the reverse reaction in this case, i.e. the animation above is an illustration of the reaction in the opposite direction.
Activation energies analysis
The activation energies of the reaction were calculated at 0.0001 K and 298.15 K. The results were presented in the table below.
| Sum of electronic and zero-point Energies / a.u. | Sum of electronic and thermal Free Energies / a.u. | |
|---|---|---|
| at 0 K | at 298.15 K | |
| Transition State | -234.403322 | -234.43289 |
| Cis-butadiene | -155.899147 | -155.92515 |
| Ethene | -78.53619 | -78.557718 |
| at 0 K | at 298.15 K | Experimental (at 0 K) | |
|---|---|---|---|
| ∆E (transition state) / kcal mol-1 | 20.1 | 31.4 | 25.1 [3] |
As expected, the activation energy increases with an increase in temperature. Comparison with literature value shows that the calculated value agrees fairly well with the literature data. Experimental value is about 5 kcal mol-1 more than the calculated energy. This suggests that either the experimental value was taken under a slightly different environment, or the accuracy of the basis set used in calculation is too low to obtain a correct value. Calculations with higher levels of theory can be used for further investigation.
Diels Alder reaction between cyclohexa-1,3-diene and maleic anhydride
The cycloaddition reaction between cyclohexa-1,3-diene and maleic anhydride is a more complex example of the Diels Alder reaction. Two possible adducts are possible depending on the face of attack of maleic anhydride. For kinetically controlled reaction, the endo- product is favoured due to the presence of secondary orbital interactions (SOIs). In this section, this Diels Alder reaction was studied. The energies and reaction pathways yielding both stereoisomers were investigated and compared.

Optimisation and HOMO-LUMO analysis of cyclohexa-1,3-diene
Cyclohexa-1,3-diene was built on GaussView and optimised with the B3LYP/6-31G* basis set. The results obtained were tabulated below.
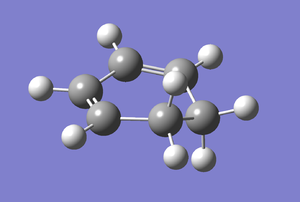
| Property | Value |
|---|---|
| File Type | .log |
| Calculation Type | FOPT |
| Calculation Method | RB3LYP |
| Basis Set | 6-31G(d) |
| E(RB3LYP) | -233.41891071 |
| RMS Gradient Norm | 0.00003451 |
| Dipole Moment | 0.378 |
| Point Group | C2 |
| Calculation Time / s | 45 |
Item Value Threshold Converged? Maximum Force 0.000030 0.000450 YES RMS Force 0.000013 0.000300 YES Maximum Displacement 0.000600 0.001800 YES RMS Displacement 0.000223 0.001200 YES Predicted change in Energy=-7.282890D-08 Optimization completed. |
|
Optmisation was completed with the system successfully converged. Frequency analysis was carried out subsequently to confirm that the structure obtained has a minimum energy. The small values of low frequencies and the absence of imaginary frequency showed that the molecule is fully optimised to its minimum.
 Low frequencies ---  -23.1391   -8.0873   -0.0006    0.0005    0.0006   18.9842
 Low frequencies ---  189.2260  300.7898  481.0051
The HOMO and the LUMO of the molecule were generated using the HF/3-21G basis set and shown below. This method and basis set showed more defined mixing of orbitals.
| HOMO | LUMO | |
|---|---|---|
| Visualised MO | 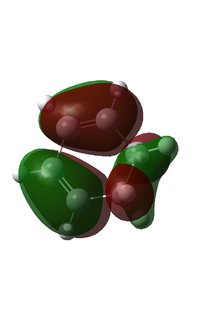 |

|
| LCAO |  |

|
| Symmetry | Asymmetric | Symmetric |
It can be seen that the HOMO is asymmetric with respect to the plane, whereas the LUMO is symmetric with respect to the same plane.
Optimisation and HOMO-LUMO analysis of maleic anhydride
Similarly, maleic anhydride was built on GaussView and optimised with the same B3LYP/6-31G* basis set. The results obtained were tabulated below.
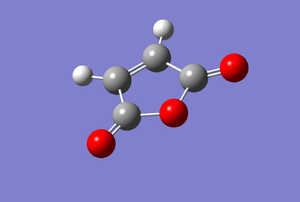
| Property | Value |
|---|---|
| File Type | .log |
| Calculation Type | FOPT |
| Calculation Method | RB3LYP |
| Basis Set | 6-31G(d) |
| Final Energy / a.u. | -379.2895445 |
| RMS Gradient Norm / a.u. | 0.00007881 |
| Dipole Moment / Debye | 4.0697 |
| Point Group | C1 |
| Calculation Time | 2 min 57.0 s |
Item Value Threshold Converged? Maximum Force 0.000102 0.000450 YES RMS Force 0.000042 0.000300 YES Maximum Displacement 0.000879 0.001800 YES RMS Displacement 0.000328 0.001200 YES Predicted change in Energy=-2.528081D-07 Optimization completed. |
|
Optmisation was completed with the system successfully converged. Again, frequency analysis was carried out subsequently to confirm that the structure obtained has a minimum energy. The small values of low frequencies and the absence of imaginary frequency showed that the molecule is fully optimised to its minimum.
 Low frequencies ---  -12.5341   -6.8160    0.0005    0.0009    0.0016   11.1266
 Low frequencies ---  167.7300  263.9757  400.3069
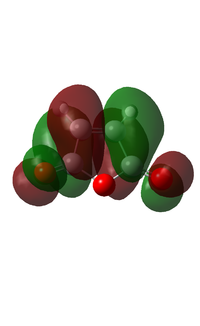
The HOMO and the LUMO of the molecule were generated using the HF/3-21G basis set and shown below. This method and basis set were chosen for the same reason as stated above.
| HOMO | LUMO | |
|---|---|---|
| Visualised MO |  |
|
| LCAO | 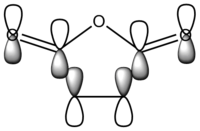 |

|
| Symmetry | Symmetric | Asymmetric |
It can be seen that the HOMO is symmetric with respect to the plane, whereas the LUMO is asymmetric with respect to the same plane.
Transition state analysis
As seen in the previous section, transition state can be calculated using two methods, i.e. the Hessian method and the frozen coordinate method. In this case, the Hessian method was used to calculate the transition state leading to the endo- product, whereas the frozen coordinate method was used for the analysis of the transition state leading to the exo- product. The results were tabulated below. Both optimisation and frequency analysis were done using the B3LYP/6-31G* basis set.
| Endo- transition state | Exo- transition state | |||||||
|---|---|---|---|---|---|---|---|---|
|
| |||||||
| File Type | .log | .log | ||||||
| Calculation Type | FREQ | FREQ | ||||||
| Calculation Method | RB3LYP | RB3LYP | ||||||
| Basis Set | 6-31G(d) | 6-31G(d) | ||||||
| Final Energy / a.u. | -612.6833968 | -612.6793109 | ||||||
| RMS Gradient Norm / a.u. | 0.00000436 | 0.00000691 | ||||||
| Dipole Moment / Debye | 6.1143 | 5.5502 | ||||||
| Point Group | C1 | C1 | ||||||
| Calculation Time | 8 min 1.0 s | 27 min 19.0 s |
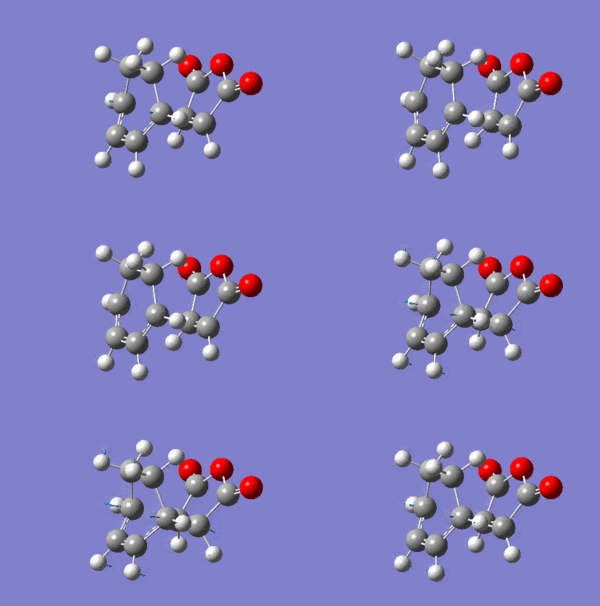
The vibrational modes corresponding to the transition states were highlighted in the table below.
| Endo- transition state | Exo- transition state | |
|---|---|---|
| Animation | 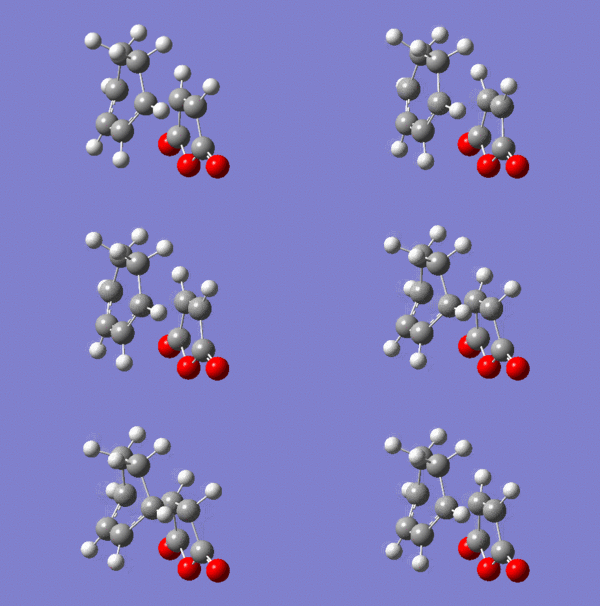 |
|
| Distance between terminal carbons / Å | 2.27 | 2.29 |
| Imaginary frequency / v cm-1 | -447 | -448 |
The presence of imaginary frequencies confirmed that the systems are at the maxima, i.e. transition states. Animating the vibrational modes at these negative frequencies showed synchronous formation of two C-C σ-bonds in each case, depicting the cycloaddition reaction.
It is noteworthy that the exo- product has a slightly lower energy than the endo- product. [4] This suggests that the exo- adduct is more stable and is therefore the thermodynamic product. However, the predominance of the endo- adduct in the reaction suggests that the cycloaddition proceeds via a kinetically controlled pathway and other reasons (which will be discussed later) dominates over this thermodynamic stability.
Observation at the two stereoisomers showed that the distance between the carbonyl carbons of the dienophile and the nearest carbon on the diene is 2.99 Å for the endo- transition state and 3.03 Å for the exo- transition state. This indicates that the exo- form suffers from steric strain due to the close proximity of the bulky groups. Furthermore, the -(C=O)-O-(C=O))- fragment in the exo- form points in the direction as the -CH2-CH2- fragment of the cyclohexa-1,3-diene ring, whereas that in the endo- form points in the direction of the diene (-CH-CH-). The extra hydrogens result in increase in steric repulsion between the groups, leading to a more strained structure in the exo- transition state. This provides the rationale behind the favourable reaction pathway via the endo- transition structure observed.
IRC analysis
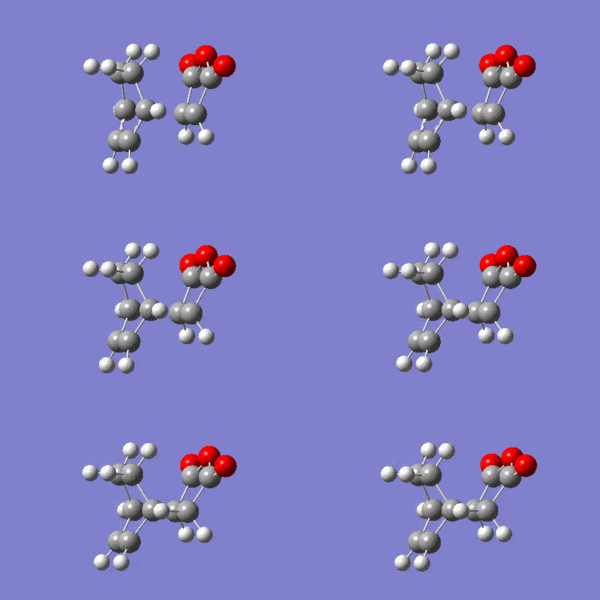
IRC calculations were carried out on both transition states and the results were presented below.
| Endo- transition state | Exo- transition state | |
|---|---|---|
| Animation |  |
|
| Energy plot |  |

|
| RMS gradient norm plot | 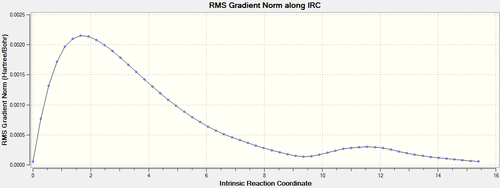 |

|
It can be seen that reactions proceed via the two transition states, yielding the exo- and endo- adducts. This further confirmed that the transition structures obtained from the previous calculations were the right ones for the Diels Alder reaction.
HOMO-LUMO analysis and secondary orbital interactions (SOIs)
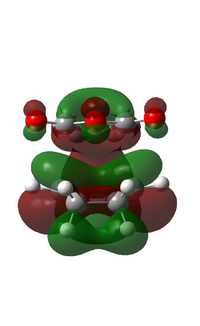
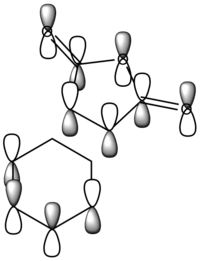
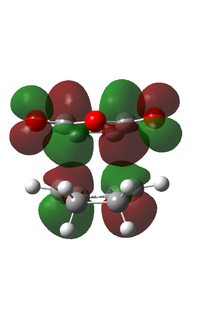
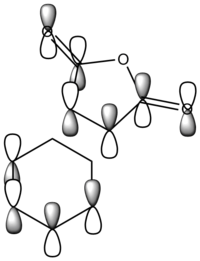
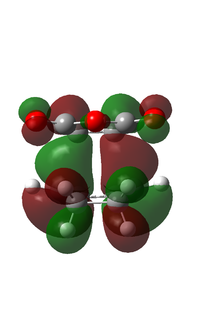
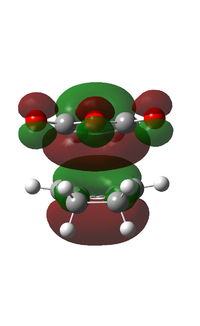
The HOMO and the LUMO of the two transition states were generated from the B3LYP/6-31G calculations. Selected transition state orbitals were shown in the table below, alongside corresponding LCAO diagrams.
| MO | Visualised MO | LCAO illustration | |
|---|---|---|---|
| Endo- transition structure | Exo- transition structure | ||
| 49 |  |
 |
|
| 48 |  |
 |
|
| 47 |  |
 |

|
| 46 |  |
 |
|
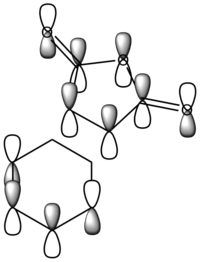
It can be observed that the MOs of endo- and exo- transition states possess the same symmetry. The HOMOs of the stereoisomers involve the LUMO of maleic anhydride and the HOMO of cyclohexa-1,3-diene and are therefore asymmetric with respect to the plane. The favourable interaction of the π systems provides the rationale behind this thermally allowed reaction.
Apart from the steric strain effect discussed above, inspection of the orbitals involved in the transition state shows that the preference of the endo- transition state can also be rationalised by the secondary orbital interactions (SOIs). SOIs were first introduced by Woodward and Hoffmann as the positive overlap of a non-active frame (bonds which are not formed / broken in the reaction) in the frontier MOs of a pericyclic reaction. [5] In this case, the π-orbitals of the C=O bond in the endo- transition state (LUMO) interacts with the HOMO of the cyclohexadiene, providing a stabilising effect. This interaction is absent in the exo- transition state. This is shown in the diagram below. Therefore, the endo- adduct is formed preferentially.

Activation energies analysis and discussion on selectivity
Activation energies of the reactions were calculated and tabulated below.
| Sum of electronic and zero-point energies / a.u. | Sum of electronic and thermal free energies / a.u. | |
|---|---|---|
| at 0 K | at 298.15 K | |
| Endo- transtion state | -612.502141 | -612.538329 |
| Exo- transition state | -612.498013 | -612.534265 |
| Cyclohexa-1,3-diene | -233.296100 | -233.323704 |
| Maleic anhydride | -379.233657 | -379.262730 |
| at 0 K | at 298.15 K | |
|---|---|---|
| ∆E (Endo- transition state) / kcal mol-1 | 17.3 | 30.2 |
| ∆E (Exo- transition state) / kcal mol-1 | 19.9 | 32.7 |
It can be observed that the activation energy of the endo- adduct is approximately 2.5 kcal mol-1 lower in energy than that of the exo- adduct, agreeing with the preference of endo- transition state. For a kinetically controlled reaction, the major product is one with a lower energy transition state and therefore forms the fastest. As discussed above, the exo- product has a lower energy and is the thermodynamic product. It is thus apparent that this reaction proceeds via a kinetic pathway with the endo- adduct predominantly formed.
Further discussion
Solvent effect
All calculations Gaussian in this report were carried out in the gas-phase on Gaussian and the effect of solvent on the transition states were neglected. It was reported that an increase in the polarity of the solvent accelerates the cycloaddition reaction. [6] Further investigation on this effect could be carried out.
Regioselectivity
The Diels Alder reactions investigated in this report involved symmetrical reactants, and thus regioselectivity was not considered. For unsymmetrical reactants, regioselectivity needs to be taken into consideration on top of stereoselectivity. [7] The HOMO/LUMO interaction, accompanied by normal/inverse electron demand, should be examined in the study.
Reference
- ↑ A. C. Cope, J. Am. Chem. Soc., 1940, '62, 441
- ↑ O. Diels and K. Alder "Synthesen in der hydroaromatischen Reihe", Justus Liebig's Annalen der Chemie, 1928, 460, 92-122 DOI:10.1002/jlac.19284600106
- ↑ D. Rowley and H. Steiner, "Kinetics of Diene Reactions at High Temperatures", Discuss. Farady Soc., 1951, 10, 198-213.DOI:10.1039/DF9511000198
- ↑ I. M. Schmart and M. E. Knot-Tso, "Endo- vs. Exo- Selectivity in Diels-Alder Reactions of Maleic Anhydride", J. Chem., 2004, 81, 1633-36
- ↑ B. Reffy, M. A. Fox, R. Cardona and N. J. Kiwiet, "Steric Effects vs. Secondary Orbital Overlap in Diels-Alder Reactions. MNDO and AM1 Studies ", J. Org. Chem., 1987, 52, 1469-1474 DOI:10.1021/jo00384a016
- ↑ M. E. Jung and J. Gervay, "gem-Dialkyl Effect in the Intramolecular Diels-Alder Reaction of 2-Furfuryl Methyl Fumarates: The Reactive Rotamer Effect, Enthalpic Basis for Acceleration, and Evidence for a Polar Transition State", J. Am. Chem. Soc, 1991, 113, 224-232 DOI:10.1021/ja00001a032
- ↑ K. Afarinkia, M. J. Bearpark, and A. Ndibwami, "Computational and Experimental Investigation of the Diels-Alder Cycloadditions of 4-Chloro-2(H)-pyran-2-one", J. Org. Chem, 2003, 68, 7158-7166 DOI:10.1021/jo0348827
