
Rep:Mod:twpinorganic
Optimisation of BH3
A BH3 molecule was drawn in GaussView 5.0.8c. The B-H bond lengths were set to 1.5 Ă. The structure was optimised using the B3LYP method and 3-21G basis set. The optimised structure had a B-H bond length of 1.19 Å (2 d.p.) and a H-B-H bond angle of 120.0° (1 d.p.). The output summary is shown below.
BH3 Optimisation
File Name = TWP_BH3_OPT
File Type = .log
Calculation Type = FOPT
Calculation Method = RB3LYP
Basis Set = 3-21G
Charge = 0
Spin = Singlet
E(RB3LYP) = -26.46226338 a.u.
RMS Gradient Norm = 0.00020672 a.u.
Imaginary Freq =
Dipole Moment = 0.0000 Debye
Point Group = D3H
Job cpu time:  0 days  0 hours  0 minutes 10.0 seconds.
Since the gradient is < 0.001, the molecule has been optimised. This can be double-checked by examining the .log file for the calculation.
         Item               Value     Threshold  Converged?
 Maximum Force            0.000413     0.000450     YES
 RMS     Force            0.000271     0.000300     YES
 Maximum Displacement     0.001610     0.001800     YES
 RMS     Displacement     0.001054     0.001200     YES
 Predicted change in Energy=-1.071764D-06
 Optimization completed.
    -- Stationary point found.
                           ----------------------------
                           !   Optimized Parameters   !
                           ! (Angstroms and Degrees)  !
 --------------------------                            --------------------------
 ! Name  Definition              Value          Derivative Info.                !
 --------------------------------------------------------------------------------
 ! R1    R(1,2)                  1.1935         -DE/DX =    0.0004              !
 ! R2    R(1,3)                  1.1935         -DE/DX =    0.0004              !
 ! R3    R(1,4)                  1.1935         -DE/DX =    0.0004              !
 ! A1    A(2,1,3)              120.0            -DE/DX =    0.0                 !
 ! A2    A(2,1,4)              120.0            -DE/DX =    0.0                 !
 ! A3    A(3,1,4)              120.0            -DE/DX =    0.0                 !
 ! D1    D(2,1,4,3)            180.0            -DE/DX =    0.0                 !
 --------------------------------------------------------------------------------
 GradGradGradGradGradGradGradGradGradGradGradGradGradGradGradGradGradGrad
This confirms that the forces have converged.
The optimisation plots show how the forces have converged at each optimisation step. When we optimise the structure, we mean that Gaussian finds the position of the atoms when they are in the lowest energy stable state, at which there is an equilibrium between the nuclear-nuclear repulsive and nuclear-electron attractive forces, i.e. they are equal and opposite. Gaussian does this by using the Schödinger equation to calculate the energy E(R) of the system at position R. It then moves the atoms from position R to R' and calculates the new energy E(R'). The atoms are then moved towards the position where the energy of the molecule is lowest. This process is repeated; the potential energy surface is traversed as the atoms are gradually moved to the lowest energy configuration. Gaussian stops changing the position of the atoms when the gradient, ΔE/ΔR, is equal to zero (where the forces are zero).
 |
The plot above shows how the total energy of the molecule varies with each optimisation step. The total energy decreases after each iteration and shows how Gaussian traverses the potential energy surface of BH3, eventually reaching the minimum energy configuration.
 |
The plot above shows how Gaussian reaches the energy minimum and how the gradient of the potential energy surface becomes smaller and smaller after each iteration. The gradient reaches zero at the minimum energy configuration.
Optimisation of BCl3
BCl3 was drawn in GaussView and its symmetry was restricted to the D3h point group with very tight (0.0001) tolerance. The structure was optimised using the DFT B3LYP method and LanL2MB basis set, which uses pseudo-potentials and a larger basis set than 3-21G. The optimised structure had a B-Cl bond length of 1.87 Å (2 d.p.) and a Cl-B-Cl bond angle of 120.0° (1 d.p.). The output summary is shown below.
BCl3 optimisation
File Name = TWP_BCL3_OPT
File Type = .log
Calculation Type = FOPT
Calculation Method = RB3LYP
Basis Set = LANL2MB
Charge = 0
Spin = Singlet
E(RB3LYP) = -69.43926345 a.u.
RMS Gradient Norm = 0.00082067 a.u.
Imaginary Freq =
Dipole Moment = 0.0000 Debye
Point Group = D3H
Job cpu time:  0 days  0 hours  0 minutes  6.0 seconds.
Since the gradient is < 0.001, the molecule has indeed been optimised. This can be double-checked by examining the .log file for the calculation.
         Item               Value     Threshold  Converged?
 Maximum Force            0.000118     0.000450     YES
 RMS     Force            0.000077     0.000300     YES
 Maximum Displacement     0.000513     0.001800     YES
 RMS     Displacement     0.000336     0.001200     YES
 Predicted change in Energy=-9.162725D-08
 Optimization completed.
    -- Stationary point found.
                           ----------------------------
                           !   Optimized Parameters   !
                           ! (Angstroms and Degrees)  !
 --------------------------                            --------------------------
 ! Name  Definition              Value          Derivative Info.                !
 --------------------------------------------------------------------------------
 ! R1    R(1,2)                  1.8659         -DE/DX =    0.0001              !
 ! R2    R(1,3)                  1.8659         -DE/DX =    0.0001              !
 ! R3    R(1,4)                  1.8659         -DE/DX =    0.0001              !
 ! A1    A(2,1,3)              120.0            -DE/DX =    0.0                 !
 ! A2    A(2,1,4)              120.0            -DE/DX =    0.0                 !
 ! A3    A(3,1,4)              120.0            -DE/DX =    0.0                 !
 ! D1    D(2,1,4,3)            180.0            -DE/DX =    0.0                 !
 --------------------------------------------------------------------------------
 GradGradGradGradGradGradGradGradGradGradGradGradGradGradGradGradGradGrad
This confirms that the forces have converged.
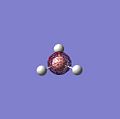
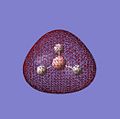
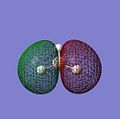
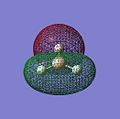
Molecular Orbitals of BH3
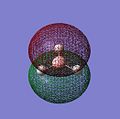
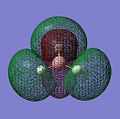
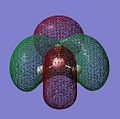
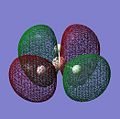
Molecular orbitals were calculated from the optimised BH3 structure using the B3LYP method and 6-31G basis set. Full natural bond order (NBO) was enabled and "pop=full" was added to the additional keywords to enable the MO analysis. This was submitted to Gaussian and MOs 1-8 are shown below.
- Molecular Orbitals 1-8 of BH<sub
-
 HOMO-3
 -
 HOMO-2
 -
 HOMO-1
 -
 HOMO
HOMO -
 LUMO
LUMO -
 LUMO+1
 -
 LUMO+2
 -
 LUMO+3


Below is a molecular orbital diagram of D3h BH3 showing the molecular orbitals obtained from the linear combination of atom orbitals (LCAO) approach and the MOs obtained from Gaussian.
 |

In this case, the LCAO method of predicting the shape of MOs is most accurate for bonding rather than anti-bonding MOs. All of the bonding LCAO MOs look very similar to the MOs calculated using Gaussian, but the anti-bonding MOs are quite different. For example, the 3a'1 LCAO suggests that the shaded/red part of the MO centred on the B atom is spherical, but in fact it is more shaped like a rounded trigonal prism that extends through the C3 axis.
LCAO MOs do not show how the MO is in fact 'smeared' across the molecule and give the illusion that the MOs have more AO character than they really do. Higher energy MOs are especially diffuse in comparison to lower energy ones. A good example is the left hand side 2e' MO: the LCAO MO has a lot of py character, whereas in the actual MO the py shaped lobes are pushed away from the y axis because of the destructive interference. Overall, it resembles a dxy orbital more than the LCAO MO.
Overall I think qualitative MO theory is still useful, but the differences described above between LCAO and actual MOs must be considered when using it.
Natural Bond Order Analysis of BH3
The Gaussian output file from the population analysis used to find the MOs of BH3 also provides information for natural bond order (NBO) analysis. From NBO analysis, boron and hydrogen atoms have a charges of +0.28 a.u. and -0.09 a.u. (2 d.p.) respectively. NBO analysis also provides other information in the output file, some of which will be discussed below.
Bond Hybridisation
       (Occupancy)   Bond orbital/ Coefficients/ Hybrids
 ---------------------------------------------------------------------------------
     1. (1.99854) BD ( 1) B   1 - H   2
                ( 45.36%)   0.6735* B   1 s( 33.33%)p 2.00( 66.67%)
                                            0.0000  0.5774  0.0000  0.0000  0.0000
                                            0.8165  0.0000  0.0000  0.0000
                ( 54.64%)   0.7392* H   2 s(100.00%)
                                            1.0000  0.0001
     2. (1.99854) BD ( 1) B   1 - H   3
                ( 45.36%)   0.6735* B   1 s( 33.33%)p 2.00( 66.67%)
                                            0.0000  0.5774  0.0000  0.7071  0.0000
                                           -0.4082  0.0000  0.0000  0.0000
                ( 54.64%)   0.7392* H   3 s(100.00%)
                                            1.0000  0.0001
     3. (1.99854) BD ( 1) B   1 - H   4
                ( 45.36%)   0.6735* B   1 s( 33.33%)p 2.00( 66.67%)
                                            0.0000  0.5774  0.0000 -0.7071  0.0000
                                           -0.4082  0.0000  0.0000  0.0000
                ( 54.64%)   0.7392* H   4 s(100.00%)
                                            1.0000  0.0001
     4. (1.99954) CR ( 1) B   1           s(100.00%)
                                            1.0000  0.0000  0.0000  0.0000  0.0000
                                            0.0000  0.0000  0.0000  0.0000
     5. (0.00000) LP*( 1) B   1           s(100.00%)
NBO analysis partitions electron density of the molecule into atomic like orbitals which are used to form 2e-2c bonds. The above tells us that all three B-H bonds in BH3 are identical and are distributed between B (45.36%) and H (54.64%). There are 3 orbitals for which B has a hybridisation of 33.33% s and 66.67% p and H is 100% s, i.e. B has 3 sp2 hybrid orbitals which interact with the 1s AO of 3 H atoms. The fourth orbital is the core B 1s AO. The fifth is B lone pair, which is 100% s.
Second Order Perturbation Theory Analysis of Fock Matrix in NBO Basis
This section outlines interactions between MOs. Only interactions with energies > 20 kcal/mol are of interest, of which there are none in this case.
 Second Order Perturbation Theory Analysis of Fock Matrix in NBO Basis

     Threshold for printing:   0.50 kcal/mol
                                                                              E(2)  E(j)-E(i) F(i,j)
         Donor NBO (i)                     Acceptor NBO (j)                 kcal/mol   a.u.    a.u.
 ===================================================================================================

 within unit  1
   4. CR (   1) B   1                / 10. RY*(   1) H   2                    0.70    7.42    0.064
   4. CR (   1) B   1                / 11. RY*(   1) H   3                    0.70    7.42    0.064
   4. CR (   1) B   1                / 12. RY*(   1) H   4                    0.70    7.42    0.064
Natural Bond Order Summary
The NBO summary records the energy and population of B-H bonds aand B lone pair. In effect, NBO analysis takes the delocalised MO picture and converts it back to the traditional 2e-2c bonding model employed in organic chemistry.
Natural Bond Orbitals (Summary):

                                                            Principal Delocalizations
           NBO                        Occupancy    Energy   (geminal,vicinal,remote)
 ====================================================================================
 Molecular unit  1  (H3B)
     1. BD (   1) B   1 - H   2          1.99854    -0.43328
     2. BD (   1) B   1 - H   3          1.99854    -0.43328
     3. BD (   1) B   1 - H   4          1.99854    -0.43328
     4. CR (   1) B   1                  1.99954    -6.68393  10(v),11(v),12(v)
     5. LP*(   1) B   1                  0.00000     0.53915
     6. RY*(   1) B   1                  0.00000     0.37512
     7. RY*(   2) B   1                  0.00000     0.37512
     8. RY*(   3) B   1                  0.00000    -0.04064
... (additional orbtials not shown)
Confirming Minima Using Vibrational Analysis
Why perform vibrational analysis?
It is necessary to perform a vibrational anaylsis in order to confirm that a minimum energy structure has been obtained from the optimisation. The first derivative of the potential energy surface is equal to zero at turning points. However, this could be a maximum or minimum. In order to distinguish between the two, the second derivative of the PES must be calculated. A frequency analysis effectively calculates this. If all frequencies are positive, then a energy minimum has been found. If one frequency is negative, then the structure is a transition state, but if more than one frequency is negative the optimisation has failed.
Methods and Basis Sets
A basis set is a set of functions that are used to create the molecular orbitals of a molecule. The larger the basis set, the more accurate the calculation. However, the calculation will take longer to perform. A balance must be found to obtain the required accuracy within a reasonable amount of time.
The same method and basis set used for the optimisation must also be used for the frequency analysis because the method and basis set used decides how the molecule is described as a wavefunction. It is not possible to use one description of the molecule and then calculate the vibrational frequencies using another.
BH3 Vibrational Analysis
A vibrational analysis was carried out in order to confirm that the minimum energy structures have been obtained. The .out file from previous BH3 optimisation was opened in GaussView. A Gaussian vibrational analysis was performed using the DFT B3YLP method and 3-21G basis set:
# freq b3lyp/3-21g geom=connectivity pop=(full,nbo)
Every molecule has 3N-6 vibrational frequencies where N is the number of atoms. All vibrations were found. These were animated in GaussView and have been tabulated below.
| No. | Form of Vibration | Frequency/cm-1 | Intensity | Symmetry D3h |
|---|---|---|---|---|
| 1 |  |
1144.15 | 92.8665 | A'' |
| 2 |  |
1204 | 12 | E' |
| 3 | .jpg) |
1204 | 12 | E' |
| 4 |  |
2598 | 0 | A' |
| 5 |  |
2737 | 104 | E' |
| 6 | .jpg) |
2737 | 104 | E' |
There are 6 vibrations but only 3 peaks in the spectrum. Vibrations 2 & 3 (1203 cm-1) and 5 & 6 (2737 cm-1) are at the same frequency so the peaks overlap; 4 vibrations appear as only 2 peaks. In order for a vibration to be IR active and therefore appear in the IR spectrum, the vibration must bring about a change in the overall dipole of the molecule. Vibration number 4 does not bring about a change in dipole and therefore does not appear in the spectrum.
 |
BCl3 Vibrational Analysis
The .out file from the previous BCl3 optimisation was opened in GaussView. The DFT B3LYP method and LanL2MB basis set was used for the optimisation and so it will be used again for the frequency analysis.
The calculation took 14.0 seconds. The vibrational frequencies calculated are tabualated below. All frequencies are positive and therefore a minimum energy structure has been found.
| No. | Form of Vibration | Frequency/cm-1 | Intensity | Symmetry D3h |
|---|---|---|---|---|
| 1 |  |
214 | 4 | E' |
| 2 | .jpg) |
214 | 4 | E' |
| 3 |  |
377 | 44 | A2'' |
| 4 |  |
417 | 0 | A1' |
| 5 |  |
939 | 259 | E' |
| 6 | .jpg) |
939 | 259 | E' |
There are only three peaks in the vibrational spectrum. Vibrations 1 & 2 (214 cm-1) and 5 & 6 (939 cm-1) are at the same frequency so the peaks overlap; 4 vibrations appear as only 2 peaks. Vibration 4 does not bring about a change in the dipole of the molecule, so it is not IR active and does not appear in the spectrum.
 |
| Measurement | Calculated | Lit.[1] |
|---|---|---|
| B-Cl Bond Length (2 d.p.) | 1.87 Å | 1.72 Å |
| Cl-B-Cl Bond Angle | 120.0° (1 d.p.) | 120° ‡ |
‡ Lit.[1] does not specifically give numerical angle, but lists the D3h point group instead. Therefore the bond angle is 120°.
The calculated bond length is slightly larger than the literature value. The ground state symmetry and the symmetry used by Gaussview was D3h.
Chemical Bonds
GaussView draws bonds between atoms based on distance criteria. If a bond is not shown, it does not mean there is no bond, but that the distance between the atoms exceeds a pre-defined value. Then what does define a bond? Pauling thought that
"...there is a chemical bond between two atoms or groups of atoms in case that the forces acting betwen them are such as to lead to the formation of an aggregate with sufficient stability to make it convenient for the chemist to consider it as an independent molecular species."[2]
This definition includes ionic, covalent and metallic bonding, but excludes weaker interactions like Van der Waals forces.
Mo Complexes
Structure Optimisation
In the second year synthesis laboratory, Mo(CO)4(PPh3)2 is prepared and its vibrational spectrum is recorded. Performing calculations on the full molecule is too expensive in terms of computing resources, so PPh3 is replaced with PCl3. PCl3 has the advantage of being less computationally intensive but behaves similarly to PPh3.

The cis and trans isomers of Mo(CO)4(PCl3)2 were drawn in GaussView. The structure was optimised using Gaussian with the B3LYP method, LANL2MB basis set and loose convergance criteria. LANL2MB is a low level and pseudo-potential basis set; a higher level basis set was unnecessary as only the rough geometry was desired.
# b3lyp/lanl2mb geom=connectivity opt=loose
Optimisations at this level provide good bond lengths and angles. However, dihedral angles are not that good, particularly for PCl3 groups. Consequently, the dihedral angles were changed using GaussView so that for the trans isomer both PCl3 groups were eclipsed with one Cl parallel to the Mo-C bond. The cis isomer was modified so that one Cl in one PCl3 group points up parallel to the axial bond and one Cl in the other PCl3 group points down parallel to the axial bond.
These structures with the new geometries were then optimised using the B3LYP method and LANL2DZ psuedo-potential basis set, which is a higher basis set than LANL2MB. Tighter convergence criterea were used by adding "int=ultrafine scf=conver=9" to the additional keywords.
# opt b3lyp/lanl2dz geom=connectivity int=ultrafine scf=conver=9
The results for the trans and cis isomers are available at DOI:10042/to-3011 and DOI:10042/to-3012 respectively.
Frequency Analysis

A vibrational frequency analysis was performed on both isomers using the B3LYP method and LAN2DZ pseudo-potential basis set (which was also used for the optimisation). Tighter convergence criterea were used to prevent negative vibrational frequencies.
# freq b3lyp/lanl2dz geom=connectivity int=ultrafine scf=conver=9
The vibrational analysis results for the trans and cis isomers are available at DOI:10042/to-3016 and DOI:10042/to-3017 respectively. All vibrational frequencies were positive, so a minimum energy structure was found for both compounds.
There are some very low vibrational frequencies present in both vibrational spectra that correspond to the rotation of the trichlorophosphine ligands. These are shown below. Since they are such low energy 'vibrations' they will occur at room temperature.
 |
 |
The CO vibrational frequency changes depending on whether the complex is cis or trans. CO stretches are generally around 2000 cm-1, but the intensity of the vibrations depends on the symmetry because vibrations are only IR-active if there is a change in dipole.
| Isomer | Frequency | Intensity |
|---|---|---|
| Cis | 1945 | 762 |
| 1949 | 1499 | |
| 1958 | 633 | |
| 2023 | 598 | |
| Trans | 1950 | 1475 |
| 1951 | 1467 | |
| 1977 | 1 | |
| 2031 | 4 |
The table above shows that for the cis isomer, four CO stretching frequencies are observed but for the trans isomer, two stretches are observed but the other two are extremely weak because the change in dipole is very small, due to the symmetry of the complex. This behaviour agrees with literature.[3]
Structural Comparison
The calculated energy of the cis and trans isomers were -623.577 and -623.576 Hartrees (3 d.p.) respectively, so the cis isomer is more stable by about 3 kJ mol-1. However, since calculated energies have an error of about 10 kJ mol-1 this difference is negligible.

| Bond lengths | Measured/Å | Lit./Å[4] |
|---|---|---|
| Mo-C(2) | 2.06 | 2.059 |
| Mo-C(4) | 2.06 | 2.022 |
| Mo-C(5) | 2.01 | 1.972 |
| Mo-C(3) | 2.01 | 1.973 |
| Mo-P(10) | 2.51 | 2.577 |
| Mo-P(11) | 2.51 | 2.576 |
| Bond Angle | Measured/° | Lit./°[4] |
|---|---|---|
| C(2)-Mo-C(5) | 89.7 | 87.0 |
| C(5)-Mo-C(4) | 89.1 | 90.1 |
| C(4)-Mo-P(11) | 89.2 | 90.3 |
| P-(11)-Mo-C(2) | 91.9 | 94.0 |
| C(2)-Mo-P(10) | 89.2 | 90.6 |
| P(10)-Mo-C(4) | 91.9 | 84.4 |
| C(4)-Mo-C(3) | 89.7 | 91.3 |
| C(3)-Mo-C(2) | 89.1 | 93.4 |
| P(10)-Mo-P(11) | 94.2 | 104.6 |
| P(11)-Mo-C(3) | 89.4 | 80.6 |
| C(3)-Mo-C(5) | 87.1 | 83.0 |
| C(5)-Mo-P(10) | 89.4 | 91.7 |
| Bond | Measured/Å | Lit./Å[5] |
|---|---|---|
| Mo-C(3/5) | 2.06 | 2.016 |
| Mo-C(4/2) | 2.06 | 2.005 |
| Mo-P(10/11) | 2.44 | 2.500 |
| Bond Angle | Measured/° | Lit./°[5] |
|---|---|---|
| P-Mo-P | 177.4 | 180.0 |
| C(2)-Mo-C(4) | 180.0 | 180.0 |
| C(3)-Mo-C(5) | 179.0 | 180.0 |
Mini-Project: Back-Bonding in Metal-Alkene Coordination Compounds
Introduction
In the Dewar-Chatt-Duncanson model there are two components for metal-alkene bonding, σ and π. The σ-component arises from overlap of the alkene occupied πC=C orbital into empty metal d orbitals, whereas the π-component arises from overlap of the occupied metal d orbital into the empty ligand π*C=C orbital. The key difference between the two is that in the σ-component electron density is donated from the ligand to the metal, but in the π-component the donation is reversed and electron density is donated from the metal to the ligand. This is commonly referred to as back-bonding.

|
Back-bonding affects the nature of the alkene in two key ways. Firstly, back-bonding results in a decrease in C=C bond length and vibrational frequency, as donation of electron density into the anti-bonding π*C=C orbital weakens the C=C bond. Secondly, the extent of any back-bonding changes the hybridisation of the alkene carbon atoms. Back-bonding causes the C=C bond to become more C-C, i.e. sp2 character decreases and sp3 character increases, and the metal-alkene ligand transitions from η2-coordination from the alkene to 2 η1-coordination from each carbon individually. This illustrates how a chemical bonds are not entirely single, double or triple bonds, but somewhere inbetween.
In this mini-project, firstly the effect of changing the metal centre on bonding in group 10 ethene bis(trichlorophosphine) coordination compounds: [MCl3(C2H4)]-1 where M = Ni, Pd and Pt. Secondly, the effect of changing ethene substituents subsitutents on bonding will be investigated: [Pt(PCl3)2(C2R4)] where R = H, Cl and CN. These aims will be achieved by investigation of molecular orbitals, vibrational and natural bond order analysis.
Changing the metal centre
Method
All compounds were drawn in GaussView with sensible conformations. These were then roughly optimized using the DFT B3LYP method and LANL2MB basis set. LANL2MB is a medium level basis set which uses D95V on first row atoms and Los Alamos ECP pseudo-potentials on heavier elements. A higher level basis set is not required for the first optimisation, as the aim is to not find the lowest energy geometry but to obtain good bond lengths and angles.
# b3lyp/lanl2mb geom=connectivity opt=(loose,maxcycle=50)
These geometries were then optimised using the DFT B3LYP method and LANL2DZ basis set with high convergance criterea. This is a higher level basis set and pseudo-potential and gives more accurate results than LANL2MB. This is to obtain an accurate geometry which can be used for further analysis. All compounds converged successfully.
# b3lyp/lanl2dz geom=connectivity opt=(maxcycle=50) int=ultrafine scf=conver=9
Vibrational analysis was performed on the optimised structures using the same method and basis set as for the fine optimisation, DFT B3LYP and LANL2DZ.
# freq b3lyp/lanl2dz geom=connectivity opt=maxcycle=50
All vibrational frequencies for the three coordination compounds were positive and so the lowest energy structures were found.
Molecular orbital and natural bond analysis was then peformed on the final structures using an energy optimisation. As with the vibrational analysis, the same DFT B3LYP method and LANL2DZ basis set used for the optimisation was used for this analysis.
# b3lyp/lanl2dz pop=(nbo,full) geom=connectivity
Results
| No. | Compound | Loose Optimisation | Tight Optimisation | Frequency Analysis | MO and NBO Analysis |
|---|---|---|---|---|---|
| 1 | [NiCl3(C2H4)]-1 | DOI:10042/to-3247 | DOI:10042/to-3253 | DOI:10042/to-3254 | DOI:10042/to-3263 |
| 2 | [PdCl3(C2H4)]-1 | DOI:10042/to-3249 | DOI:10042/to-3252 | DOI:10042/to-3255 | DOI:10042/to-3264 |
| 3 | [PtCl3(C2H4)]-1 | DOI:10042/to-3250 | DOI:10042/to-3251 | DOI:10042/to-3256 | DOI:10042/to-3265 |
| No. | Compound | C-C Bond Length/Å | C-C Vibrational Frequency/cm-1 | HCCH Dihedral Angle/° |
|---|---|---|---|---|
| 1 | [NiCl3(C2H4)]-1 | 1.38 | 1578 | 172.8 |
| 2 | [PdCl3(C2H4)]-1 | 1.40 | 1560 | 168.9 |
| 3 | [PtCl3(C2H4)]-1 | 1.42 | 1533 | 161.1 |
| No. | Compound | Selected Data |
|---|---|---|
| 1 | [NiCl3(C2H4)]-1 | 6. (1.99578) BD ( 1) C 5 - C 8
( 50.00%) 0.7071* C 5 s( 34.47%)p 1.90( 65.53%)
-0.0003 0.5867 0.0229 0.0000 0.0000
-0.2118 0.0342 0.7798 -0.0329
( 50.00%) 0.7071* C 8 s( 34.47%)p 1.90( 65.53%)
-0.0003 0.5867 0.0229 0.0000 0.0000
-0.2118 0.0342 -0.7799 0.0329
7. (1.76564) BD ( 2) C 5 - C 8
( 50.00%) 0.7071* C 5 s( 2.79%)p34.89( 97.21%)
-0.0009 0.1647 -0.0273 0.0000 0.0000
0.9747 0.0495 0.1397 0.0065
( 50.00%) 0.7071* C 8 s( 2.79%)p34.90( 97.21%)
-0.0009 0.1647 -0.0273 0.0000 0.0000
0.9747 0.0495 -0.1397 -0.0065
|
| 2 | [PdCl3(C2H4)]-1 | 6. (1.99719) BD ( 1) C 5 - C 8
( 50.00%) 0.7071* C 5 s( 33.74%)p 1.96( 66.26%)
-0.0002 0.5804 0.0228 0.0000 0.0000
-0.2081 0.0309 0.7857 -0.0328
( 50.00%) 0.7071* C 8 s( 33.74%)p 1.96( 66.26%)
-0.0002 0.5804 0.0228 0.0000 0.0000
-0.2094 0.0310 -0.7853 0.0328
7. (1.70924) BD ( 2) C 5 - C 8
( 50.01%) 0.7071* C 5 s( 3.19%)p30.34( 96.81%)
-0.0009 0.1766 -0.0270 -0.0001 0.0000
0.9743 0.0518 0.1266 0.0055
( 49.99%) 0.7071* C 8 s( 3.19%)p30.34( 96.81%)
-0.0009 0.1766 -0.0270 -0.0001 0.0000
0.9741 0.0518 -0.1282 -0.0056
|
| 3 | [PtCl3(C2H4)]-1 | 6. (1.99690) BD ( 1) C 5 - C 8
( 50.00%) 0.7071* C 5 s( 30.87%)p 2.24( 69.13%)
-0.0002 0.5553 0.0198 0.0000 0.0000
-0.2484 0.0314 0.7923 -0.0290
( 50.00%) 0.7071* C 8 s( 30.87%)p 2.24( 69.13%)
-0.0002 0.5553 0.0198 0.0000 0.0000
-0.2497 0.0315 -0.7919 0.0289
7. (1.62242) BD ( 2) C 5 - C 8
( 50.01%) 0.7072* C 5 s( 5.37%)p17.64( 94.63%)
-0.0014 0.2301 -0.0261 -0.0001 0.0000
0.9615 0.0492 0.1392 0.0081
( 49.99%) 0.7070* C 8 s( 5.36%)p17.64( 94.64%)
-0.0014 0.2301 -0.0261 -0.0001 0.0000
0.9613 0.0492 -0.1408 -0.0082
|
Analysis
Bond Strengths and Dihedral Angles
The results show that the C-C bond length increases and the vibrational frequency decreases as group 10 is descended. Therefore, the ethene C-C bond weakens down the group.
This is caused by back-bonding, where electron density from metal d orbitals is donated into the π*C=C orbital, which weakens the bond. The MOs that correspond to this π-component are shown below.
 |
 |
 |
The extent of the back-bonding increases as the group is descended. Since the size of atomic orbitals increases down the group, this could be explained by the fact that the valence d orbital overlaps with the π*C=C orbital better for metals at the bottom of the group than those at the top, as they are similarly sized to the accepting orbital.
The HCCH dihedral angle also decreases down the group. This shows that there is increasing sp3 character to the ethene carbons as the group is descended. So, as the group is descended the ethene-metal bond is less η2-like and more like two single bonds. The MOs that correspond to this σ-component are shown below.
 |
 |
 |
This arises because of the donation of electron density from the occupied πC=C orbital into the empty metal d orbitals. This gradual change in alkene-metal bonding is illustrated below.

|
NBO Analysis
The table below summarises the key information
| No. | Compound | Lower energy C-C bond | Higher energy C-C bond | |||||||
| Occupancy | % s Character | % p Character | Hybridisation | Occupancy | % s Character | % p Character | Hybridisation | |||
| 1 | [NiCl3(C2H4)]-1 | 1.99578 | 34.47 | 65.53 | sp1.90 | 1.76564 | 2.79 | 97.21 | sp34.89 | |
| 2 | [PdCl3(C2H4)]-1 | 1.99719 | 33.74 | 66.26 | sp1.96 | 1.70924 | 3.19 | 96.81 | sp30.34 | |
| 3 | [PtCl3(C2H4)]-1 | 1.9969 | 30.87 | 69.13 | sp2.24 | 1.62242 | 5.37 | 94.63 | sp17.64 | |
In all three compounds the lower energy C-C bond is occupied by two electrons. As the group is descended, the carbon hybridisation gradually increases from just under sp2 to slighty over sp2, i.e. the carbon atoms develop more sp3 character. The carbon atoms in free ethene would be sp2 hybridised. This supports the argument so far that the bonding between the ligand and metal centre gradually changes as the group is descended from a single bond η2-coordination (no sp3 character) to two single bonds between each carbon and metal centre (increased sp3 character).
The occupancy of the higher energy C-C bond decreases as the group is descended. Non-integer occupancies mean that the electrons are not localised exclusively between the two carbon atoms, but the electron density is distributed across the C-C bond and metal centre. This trend also supports the argument so far that the bonding between the ligand and metal centre gradually changes as the group is descended from a single bond η2-coordination (no sp3 character) to two single bonds between each carbon and metal centre (increased sp3 character), because of the shift in electron density down the group.
Conclusion
- Carbon-Carbon bond weakens down the group, because of the increase in back-donation of electron density from the occupied metal d orbitals into the unoccupied π*C=C orbital - the π-component of the metal-ligand bond - which is caused by better orbital overlap down the group.
- HCCH dihedral angle decreases down the group, i.e. the H atoms deflect away from the metal centre. This is because the carbon atoms develop more sp3 character down the group, caused by better donation from the ligand πC=C orbital into the empty metal d orbitals.
- Thus as the group is descended, the alkene-metal bonding shifts from a η2-coordinated single bond to two single carbon-metal bonds.
- NBO analysis supports this conclusion through the change in calculated carbon hybridisation and the bond occupancies.
- MO analysis also supports this conclusion as the change in molecular orbital was illustrated above.
Changing Alkene Substituents
Method
The same DFT B3LYP method and LANL2MB used above was used for the loose optimsiation of [Pt(PCl3)2(C2R4)] where L = H, Cl and CN. However, none converged within 50 cycles.
In [Pt(PCl3)2(C2H4)], the PCl3 groups were rotated so that for one group one Cl atom was pointing up and for the other group one Cl was pointing down, however this also failed. The same angles were applied to [Pt(PCl3)2(C2Cl4)] and this was successfully optimised. The output from this optimisation was then changed to give the other two coordination compounds and these were then successfully optimised to obtain loose optimisations of all three compounds.
These geometries were then used to perform tight optimisation using the DFT B3LYP method and LANL2DZ basis set.
# opt=(maxcycle=50) b3lyp/lanl2dz geom=connectivity int=ultrafine scf=conver=9
The output was then used to perform a vibrational analysis with the same method and basis set as the tight optimisation, DFT B3LYP and LANL2DZ.
# freq b3lyp/lanl2dz geom=connectivity int=ultrafine opt=maxcycle=50 scf=conver=9
[Pt(PCl3)2(C2R4)] where L = CN and Cl has no negative frequencies and therefore the lowest energy geometries were obtained. However, L = H had a vibrational frequency at -5.44 cm-1. This frequency was visualised in GaussView and it corresponded to a rotation of the PCl3 groups. This is a very low energy vibration with a shallow potential energy surface. Consequently, elimination of this low frequency vibration would require the use of a higher level basis set. If this was a larger project it would be worth performing the calculation, but since it is not and time is restricted, a higher level basis set calculation was not performed.
Results
| No. | Compound | Loose Optimisation | Tight Optimisation | Frequency Analysis | MO and NBO Analysis |
|---|---|---|---|---|---|
| 1 | [Pt(PCl3)2(C2H4)] | DOI:10042/to-3326 | DOI:10042/to-3469 | DOI:10042/to-3330 | DOI:10042/to-3382 |
| 2 | [Pt(PCl3)2(C2Cl4)] | DOI:10042/to-3328 | DOI:10042/to-3470 | DOI:10042/to-3327 | DOI:10042/to-3468 |
| 3 | [Pt(PCl3)2(C2(CN)4)] | DOI:10042/to-3329 | DOI:10042/to-3471 | DOI:10042/to-3327 | DOI:10042/to-3381 |
† Repeatedly gives error saying unable to publish to D-Space when publishing from SCAN job list.
| No. | Compound | C-C Bond Length/Å | C-C Vibrational Frequency/cm-1 | RCCR Dihedral Angle/° |
|---|---|---|---|---|
| 1 | [Pt(PCl3)2(C2H4)] | 1.43 | 1541 | 159.0 |
| 2 | [Pt(PCl3)2(C2Cl4)] | 1.47 | 1246 | 143.5 |
| 3 | [Pt(PCl3)2(C2(CN)4)] | 1.49 | 1303 | 150.5 |
| No. | Compound | Selected Data |
|---|---|---|
| 1 | [Pt(PCl3)2(C2H4)] | 7. (1.99489) BD ( 1) C 10 - C 11
( 50.00%) 0.7071* C 10 s( 32.85%)p 2.04( 67.15%)
-0.0001 0.5728 0.0189 0.7980 -0.0277
0.1790 -0.0332 -0.0291 0.0013
( 50.00%) 0.7071* C 11 s( 32.85%)p 2.04( 67.15%)
-0.0001 0.5728 0.0189 -0.7979 0.0277
0.1793 -0.0333 0.0291 -0.0013
8. (1.69860) BD ( 2) C 10 - C 11
( 50.00%) 0.7071* C 10 s( 3.64%)p26.49( 96.36%)
0.0015 -0.1885 0.0288 -0.0830 -0.0152
0.9770 0.0445 0.0049 0.0003
( 50.00%) 0.7071* C 11 s( 3.64%)p26.49( 96.36%)
0.0015 -0.1885 0.0288 0.0834 0.0152
0.9770 0.0445 -0.0050 -0.0003
|
| 2 | [Pt(PCl3)2(C2Cl4)] | 7. (1.99200) BD ( 1) C 10 - C 11
( 50.00%) 0.7071* C 10 s( 33.06%)p 2.02( 66.94%)
-0.0002 0.5742 0.0300 -0.2877 -0.0448
0.7619 0.0222 -0.0604 -0.0022
( 50.00%) 0.7071* C 11 s( 33.06%)p 2.02( 66.94%)
-0.0002 0.5742 0.0300 -0.2864 -0.0448
-0.7624 -0.0222 0.0604 0.0022
8. (1.74459) BD ( 2) C 10 - C 11
( 50.00%) 0.7071* C 10 s( 13.42%)p 6.45( 86.58%)
-0.0031 0.3657 -0.0201 0.9258 -0.0190
0.0745 -0.0522 -0.0079 0.0039
( 50.00%) 0.7071* C 11 s( 13.42%)p 6.45( 86.58%)
-0.0031 0.3658 -0.0201 0.9259 -0.0191
-0.0730 0.0522 0.0076 -0.0039
|
| 3 | [Pt(PCl3)2(C2(CN)4)] | 7. (1.93933) BD ( 1) C 10 - C 11
( 50.00%) 0.7071* C 10 s( 32.28%)p 2.10( 67.72%)
-0.0006 0.5681 -0.0029 0.8151 -0.0011
0.0850 -0.0356 -0.0663 0.0003
( 50.00%) 0.7071* C 11 s( 32.28%)p 2.10( 67.72%)
-0.0006 0.5681 -0.0029 -0.8151 0.0011
0.0850 -0.0356 0.0663 -0.0003
8. (1.65348) BD ( 2) C 10 - C 11
( 50.00%) 0.7071* C 10 s( 3.96%)p24.28( 96.04%)
0.0022 -0.1955 0.0367 0.0347 -0.0370
0.9786 0.0127 -0.0011 0.0031
( 50.00%) 0.7071* C 11 s( 3.96%)p24.28( 96.04%)
0.0022 -0.1955 0.0367 -0.0347 0.0370
0.9786 0.0127 0.0012 -0.0031
|
Analysis
Bond Strengths and Dihedral Angles
The CN-substituted alkene has the longest C-C bond length and the H-substituted alkene has the shortest bond length. The CN-substituted alkene has the lowest energy vibrational frequency and the H-substituted alkene has the highest. Both these results show that the C-C bond is strongest in [Pt(PCl3)2(C2H4)] and weakest in [Pt(PCl3)2(C2(CN)4)]. The weakening of the C-C bond is caused by back-bonding; occupied Pt orbitals donate electron density into the π*C=C orbital thus weakening the carbon-carbon bond. The MOs for this interaction are shown below.
 |
 |
 |
Looking at the MOs there is little difference between the three compounds; NBO analysis is more appropriate for analysis of this bonding component.
The H-subsituted alkene has the largest dihedral angle and the CN-subsitututed alkene has the smallest dihedral angle. This shows that the H- and CN-substituted alkene carbon atoms have the smallest and largest sp3 character, in comparison to sp2 in free alkenes. This shows that in the CN-subsituted complex the ligand bond to the metal bond is more like two single bonds, with C-C character, in contrast to the H-substituted complex where there is single η2-coordination, with C=C character.
 |
 |
 |
This is supported by the MOs above. In the Cl- and CN-subsituted alkenes, there is no electron density between the centre of the alkene bond and the Pt centre and the MO looks like two single bonds, whereas in the H-substituted alkene there is electron density between the centre of the alkene bond and Pt centre, which is like η2-coordination.
NBO Analysis
| No. | Compound | Lower energy C-C bond | Higher energy C-C bond | |||||||
| Occupancy | % s Character | % p Character | Hybridisation | Occupancy | % s Character | % p Character | Hybridisation | |||
| 1 | [Pt(PCl3)2(C2H4)] | 1.99489 | 32.85 | 67.15 | sp2.04 | 1.69860 | 3.64 | 96.36 | sp26.49 | |
| 2 | [Pt(PCl3)2(C2Cl4)] | 1.99200 | 33.06 | 66.94 | sp2.02 | 1.74459 | 13.42 | 86.58 | sp6.45 | |
| 3 | [Pt(PCl3)2(C2(CN)4)] | 1.93933 | 33.28 | 67.72 | sp2.10 | 1.65348 | 3.96 | 96.04 | sp24.28 | |
In all three compounds the lower energy C-C bond is occupied by two electrons. The H-substituted alkene has the greatest sp2 character, sp2.04, and this agrees with the dihedral angles, bond strengths and MO diagrams so far in supporting the argument that the alkene-metal bonding in this complex is η2-coordination.
The alkene carbons in the CN-substituted complex are sp2.10 hybridised and have the most sp3 character of the three complexes. This also agrees with the previous results that there is little η2-coordination and the bonding is more like two single bonds from the carbont to Pt.
The alkene carbons in the Cl-substituted complex are sp2.02, c.f. sp2.04 for H-substituted. This lower than expected p character conflicts with the ClCCCl dihedral angle, which is smaller than the angle for (CN)CC(CN) even though the CN-substituted complex has greater sp3 character. The smaller ClCCCl dihedral angle could be caused by electrostatic repulsion of the substituted Cl atoms away from the PCl3 groups. This small angle in conjunction with the high electronegativity of the chlorine atoms could be the cause of this smaller p character.
The higher energy carbon-carbon bond has the highest occupancy for the Cl-substituted alkene. The electronegative chlorine atmos withdrawn electron density back into the alkene ligand rather than donate it to the Pt centre. This decreases the level of η2-coordination.
The higher energy carbon-carbon bond has the lowest occupancy for the CN-substituted alkene, so this complex has the least C=C character of the three complexes. This is in agreement with the data so far that the CN-substituted complex has the least η2-coordination and the ligand is bonded mostly through two single bonds from the carbons to Pt centre.
Conclusion
- The CN- and H-substitued alkene ligands have the weakest and strongest carbon-carbon bonds respectively.
- The H- and CN-substituted alkene ligand have the largest and smallest dihedral angle respectively, suggesting that the CN-substituted ligand has the greatest sp3 character.
- This suggests that the CN-substituted ligand has the least η2-coordination character and the H-subsituted ligand has the greatest.
- MOs showing the σ-component agree with this although it is not entirely clear whether the CN- or Cl- substituted ligand has the least η2-coordination character.
- However, NBO analysis found that the Cl-subsituted ligand has less sp3 character and a more occupied higher energy carbon-carbon bond than expected. This could be explained by the electronegative Cl-substitutents inductively withdrawing electron density from the metal-alkene bond.
- Dihedral angles and bond strengths suggest that the CN-substituted ligand has the least η2-coordination character, Cl-substituted ligand has greater η2-coordination character and the H-substituted ligand has the greatest.
- NBO analysis supports the argument that the CN-subsituted ligand has the least η2-coordination character. However, it does not support the argument that the Cl-substituted ligand has greater η2-coordination character and the H-substituted ligand has the greatest.
- This is because the Cl-substituted ligand has too lower sp hybridisation and too greater higher energy carbon-carbon bond occupancy, although this could be due to electron withdrawing effects of the electronegative chlorine atoms.
References
- ↑ 1.0 1.1 D. R. Lide (ed.), W. M. Haynes (ed.), G. Baysinger (ed.), L. I. Berger (ed.), M. Frenkel (ed.) and R. N. Goldberg (ed.), CRC Handbook of Chemistry & Physics, 90th edn., 2009, section 9, p. 21.
- ↑ L. Pauling, The Nature of the Chemical Bond and the Structure of Molecules and Crystals: An Introduction to Modern Structural Chemistry, Cornell University Press, 3rd edn., 1960, p. 6.
- ↑ M. Y. Darensbourg and D. J. Darensbourg, J. Chem. Ed., 1970, 47, 1, 33-35.
- ↑ 4.0 4.1 F. A. Cotton, D. J. Darensbourg, S. Klein and B. W. S. Kolthammer, Inorg. Chem., 1982, 21, 294-9
- ↑ 5.0 5.1 G. Hogarth and T. Norman, Inorg. Chim. A., 1997, 254, 167-71