Rep:Mod:ts3210m2
Computational Chemistry lab Module 2
Using, creating and optimising molecules is gaussview 5
The gaussview 5 program can be used to create molecules and find their most energetically favorable state by using quantum mechanical equations. The programs allows users to simply make the desired molecule and then run QM calculations with a variety of opinions and settings. We can depenstrate this my making a molecule and running claculations on it to find its most optimised state and compare these results with caluclations done with different setting.
The first thing we done was create the molecule and optimise its energy, this is done by simply making the desired molecule with the element fragment tool, for the optisimation calculation we use the calculation type FOPT, method B3LYP and the basis set 3-21G. For a graphic of this click this link: Optimised BH3 Molecule, for the log file click here.For the optimisation file click here. The results of this optisimation are found in the .log file but they have been tabled here to be easier understood and compared
         Item               Value     Threshold  Converged?
 Maximum Force            0.000413     0.000450     YES
 RMS     Force            0.000271     0.000300     YES
 Maximum Displacement     0.001610     0.001800     YES
 RMS     Displacement     0.001054     0.001200     YES
 Predicted change in Energy=-1.071764D-06
 Optimization completed.
We can make a more defined and accurate model of the system if we higher level basis set, this is changed in the opinions for each calculation, a larger basis set usually gives a more accurate answer but normally takes longer for the optimisation to run. We will run the same optimisation again but this time using 6-31G(d,p) basis set, when we change the basis set we need to remember to but d,p in the options next to the 6-31G tab and add the Nosymm keyword, all the other settings are kept the same. The image is here graphic for larger basis set. For the log file click here. For the optimisation file click here. The results for this optimisation is also tabulated.
| Field | Results |
|---|---|
| B-H bond distance | 1.19347A |
| H-B-H bond angle | 119.998 |
| Final energy | -26.42 a.u |
| Gradient | 0.0002067 a.u. |
| Dipole moment | 0D |
| Point group | D3H |
| Calculation time | 5 minutes |
   Item               Value     Threshold  Converged?
 Maximum Force            0.000012     0.000450     YES
 RMS     Force            0.000008     0.000300     YES
 Maximum Displacement     0.000049     0.001800     YES
 RMS     Displacement     0.000032     0.001200     YES
 Predicted change in Energy=-8.912306D-10
 Optimization completed.
These calculations are very short and not complex calculation, for larger ones we have to run it off Imperial College London's SCAN system. To show this we created a TlBr3 molecule and forced the molecule to keep its D3H symmetry and with a tolerance of 0.0001. We ran the optisimation with settings DFT, B3LYP and with the basis set LanL2DZ, which uses two different basis set one for the heavy molecules one for everything else. This molecule should keep its D3h symmetry, we should also be able to tell how good the simulation of the TlBr3 molecule is by comparing its Tl-Br bond length with literature Values. Graphic for TlBr3. For the log file click here. For the optimisation file click here. The results for this optimisation is also tabulated.
| Field | Results |
|---|---|
| B-H bond distance | 1.19332 A |
| H-B-H bond angle | 120.000 |
| Final energy | -26.61 a.u. |
| Gradient | 0.00000624 a.u. |
| Dipole moment | 0D |
| Point group | D3H |
| Calculation time | 1.5 minutes |
Item               Value     Threshold  Converged?
 Maximum Force            0.000002     0.000450     YES
 RMS     Force            0.000001     0.000300     YES
 Maximum Displacement     0.000022     0.001800     YES
 RMS     Displacement     0.000014     0.001200     YES
 Predicted change in Energy=-6.084031D-11
 Optimization completed.
Our value of Tl-Br bond distance is 2.65095A, the literature value we could find puts the bond length at 2.521A [1] . While there are some differences in these values, they are quite close especially for a medium accuracy model. If we wanted a better value we could a different basis set to get a more accurate value but the value we have seems good enough for this level of accuracy.
We can make different atoms in the same molecule use different methods of calculation. For example in BBr3 we have three heavy Br atoms that should be treated with a pseudo potential as a full basis set will take too much calculation and the boron atom which requires a full basis set or it doesn't have enough accuracy. In this calculation we will use calculation for the 6-31G BH3 as a base, and change the H atoms to Br our calculation type will be FOPT, RB3LYP. For the heavy bromide atoms we will use the LanL2DZ pseudo potential and for the boron we will use 6-31g(d,P).Graphic for BBr3. For the log file click here. For the optimisation file click here. The results for this optimisation is also tabulated.
| Field | Results |
|---|---|
| Tl-Br bond distance | 2.65095 A |
| Br-Tl-Br bond angle | 120.000 |
| Final energy | -91.22 a.u. |
| Gradient | 0.00000009 a.u. |
| Dipole moment | 0D |
| Point group | D3H |
| Calculation time | 0.5 Minutes (run on SCAN) |
        Item               Value     Threshold  Converged?
 Maximum Force            0.000008     0.000450     YES
 RMS     Force            0.000005     0.000300     YES
 Maximum Displacement     0.000036     0.001800     YES
 RMS     Displacement     0.000023     0.001200     YES
 Predicted change in Energy=-4.027223D-10
| Field | Results |
|---|---|
| B-Br bond distance | 1.933 A |
| Br-B-Br bond angle | 120.000 |
| Final energy | -64.44 a.u. |
| Gradient | 0.00000382 a.u. |
| Dipole moment | 0.0002D |
| Point group | D3H |
| Calculation time | 2 Minutes |
Frequency Analysis
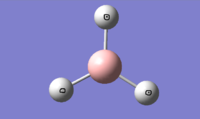
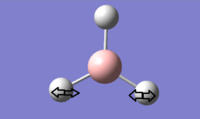
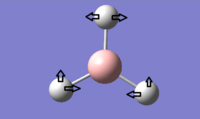
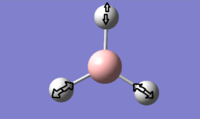
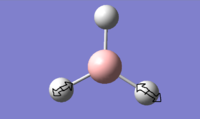
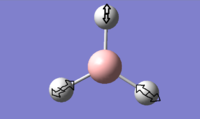
To confirm that we have have found the structure with the lowest energy we carry out frequency analysis, this tells us if we have the lowest energy set-up of this molecules, also with this information we can make animations of these molecules, also from this we can work out spectral data and compare against literature values for this molecule this tells us if the model is correct. We carry out frequency analysis by changing the settings in the gaussian calculations, instead of doing an optimisation of the molecules the setting is changed to frequency. For a demonstration of this we used the BH3 6-31G optimised log file and changed the calculation setting as above. For the log file click here. For the optimisation file click here.
| Molecule | Bond Length |
|---|---|
| BH3 | 1.193 A |
| BBr3 | 1.933 A |
| TlBr3 | 2.651 A |
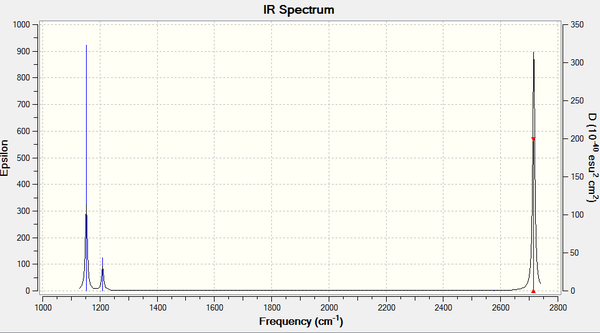
 Low frequencies ---  -10.1828   -5.7670   -5.4933   -0.0045    0.0917    1.7554
 Low frequencies --- 1152.4687 1209.4476 1209.4499
| Field | Results |
|---|---|
| B-Br bond distance | 1.933 A |
| Br-B-Br bond angle | 120.000 |
| Final energy | -26.61 a.u. |
| Gradient | 0.00000624 a.u. |
| Dipole moment | 0.0002D |
| Point group | D3H |
| Calculation time | 2 Minutes |
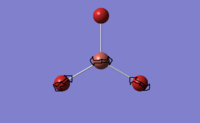
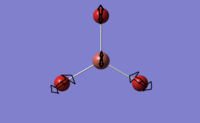
We can also use vibrtaional analysis in the same way to take a look at TlBr3, we will compare the results of this to the values of Bh3 frequency analysis. We will use the same optimised file as was created for the TlBr3 optimisation above and change the calculations as before to be frequency. All the other settings for the calculation are kept the same, for more details on these see above.For the log file click here. For the optimisation file click here.
Low frequencies ---   -3.7412   -0.0028   -0.0004    0.0014    3.6276    3.6276
Low frequencies ---   46.4049   46.4051   52.1083
| Field | Results |
|---|---|
| B-Br bond distance | 2.651 A |
| Br-B-Br bond angle | 120.000 |
| Final energy | -91.22 a.u. |
| Gradient | 0.00001821 a.u. |
| Dipole moment | 0D |
| Point group | D3H |
| Calculation time | 2 Minutes |

The same optimisation and frequency must be used both optimisation and frequency because anything that is a different basis set or method will give dramatically different values and these are not comparable to each other, hence we cannot compare to results with different basis sets. If you start a frequency on a optimised molecule but was optimised with a different basis set the values will be different than for the basis set that we are know running, hence the molecule will not be fully optimised and we will get a wrong value at the end.
We carry out frequency analysis as this gives us additional information on the molecule such as how the bonds moves and so we can compare against known IR spectrums and see if the simulations we have run are comparable to real situations. The Low frequencies are the 3N-6 vibrational frequencies and are just the motion of the central atom and the ones it is bonded to.
MO Analysis
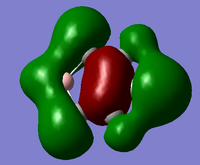
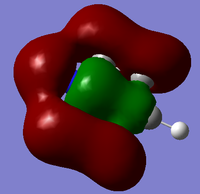
Another useful analytical tool that we can use from gaussian is being able to create and see in 3D the molecular orbital. This is also useful in comparing these calculated MOs to the ones from LCAO. We found the MOs by loading the .chk from the BH3 optimisation, we used this and changing the settings in the calculation to full NBO. When the calculation was run we looked at the first 8 MOs, the first MO was the 1s orbitial but the other seven had their pictures taken and compared against the LCAO orbitial. For the .chk file click here.

NBO Analysis
Natural bond analysis is a useful tool also from gaussian to test and show its function we will set one up for a NH3 molecule, however first of all we must go through all the steps we have already done for the molecules above for NH3. We will create the molecule and run an optimisation with the 6-31G basis set, then run a frequency analysis and a population analysis. The .chk file for the optimisation here and the .log file here. The .chk file for the frequceny analysis here and the .log file here. The .chk file for the MO analysis here and the .log file here.
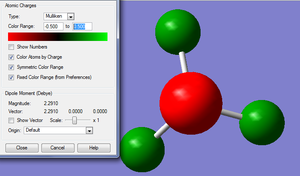
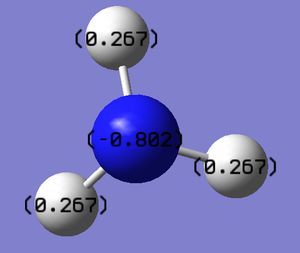
In this example the frequency analysis step has not yielded the ideal range of frequencies, we would usally expect the values for the low frequency to be within +/- 20, in this case they are reasonably close to this range but not exactly inside it, so there is a small doubt over their accuracy but since this exmaple is mainly going to be used as a demonstrastion pf NBO it is fine for its purpose. The usefulness of the NBO analysis is seeing the difference in electron charge across the molecule, this has been demonstrated by the graphs below.
Item               Value     Threshold  Converged?
 Maximum Force            0.000056     0.000450     YES
 RMS     Force            0.000037     0.000300     YES
 Maximum Displacement     0.000144     0.001800     YES
 RMS     Displacement     0.000095     0.001200     YES
 Predicted change in Energy=-1.108753D-08
 Optimization completed.
  Low frequencies ---  -11.6313  -11.5960   -0.0028    0.0243    0.1402   25.5608
 Low frequencies --- 1089.6620 1694.1733 1694.1736

Association energies
We can calculate using gaussian the association energy of a molecules, we can do this by finding the combined starting energies of the reactant and comparing this against the energy of the product. For this example we will use as the product the compound NH3BH3 not only because we have already done the calculations for both the BH3 and the NH3 molecule with the same method and basis set, but also because NH3BH3 is a interesting molecule with possible uses in a fuel system.
Since we will be directly comparing values of energies from these calculations we have to make sure that they are run all in the same basis set and using the same method as each other or the values for the energies will not be comparable. Since we have already run the BH3 and NH3 optimisations with the 6-31G(d,p) basis set and the methods: DFT, B3LYP it is logical to suggest running the NH3BH3 optimisation with these same setting to reduce the necessary amount of calculations required. As with most of the other examples we have done we will run a frequecny anaqlsysis to make sure the optimisation is at a minimum. The .chk file for the optimisation here and the .log file here. The .chk file for the frequceny analysis here and the .log file here.
Item               Value     Threshold  Converged?
 Maximum Force            0.000132     0.000450     YES
 RMS     Force            0.000037     0.000300     YES
 Maximum Displacement     0.001220     0.001800     YES
 RMS     Displacement     0.000543     0.001200     YES
 Predicted change in Energy=-1.180827D-07
 Optimization completed.
 Low frequencies ---    0.0008    0.0009    0.0015    5.7428   14.9757   20.2781
 Low frequencies ---  263.3588  631.3097  638.0752
The association energy will be the energy of the product minus the energy of the reactants, 1 a.u ≈ 2626 KJ/mol. If we calculate the ΔE or association energy it gives us 420 KJ/mol which is roughly in the range for quite a strong bond as we would expect from this particular molecule. So we can say that gaussian can be used effectively to estimate values for bonds and therefore could be used well in analysis of particular unknown molecules.
Investigation into aromaticity
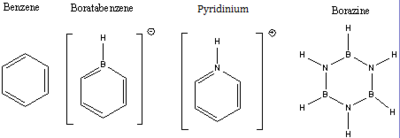
To fully utilise the gaussian program will we take a much in depth look than previous at aromaticity in benzene and benzene like structures. The benzene like structures we will be looking at are benzene, Boratabenzne, pyridinium and borazene. For each one we will optimise with a 6-31G basis set and method of B3LYP, then a frequency analysis ,a population analysis then a NBO analysis, all of these calculations will be done using the same method and settings for the calculation apart from changing the main point of that particular calculation, for example we will change from optimisation to energy when doing the population analysis, if you want anymore information for how these are run look above for the more detailed emxplaes. All of these calculations will be done on the imperial HPC SCAN system and will have links to the calculation results in the Dspace.
Benzene
For the .fchk file for the optimisation here and the .out file here and for the published data on Dspace click here. For the .fchk file for the frequency analysis here and the .out file here and for the published data on Dspace click here. For the .fchk file for the MO analysis here and the .out file here and for the published data on Dspace click here.
Item               Value     Threshold  Converged?
 Maximum Force            0.000204     0.000450     YES
 RMS     Force            0.000084     0.000300     YES
 Maximum Displacement     0.000870     0.001800     YES
 RMS     Displacement     0.000313     0.001200     YES
 Predicted change in Energy=-4.983462D-07
 Optimization completed.
Low frequencies ---  -14.2262   -2.7299   -0.0008   -0.0006    0.0004   10.0025
 Low frequencies ---  413.7271  414.5532  621.0441
| Molecule | Energy (AU) | Energy (KJ/mol} |
|---|---|---|
| BH3 | -26.61 | |
| NH3 | -56.56 | |
| NH3BH3 | -83.22 | |
| ΔE | -0.16 | 420 |
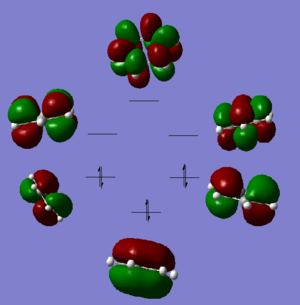
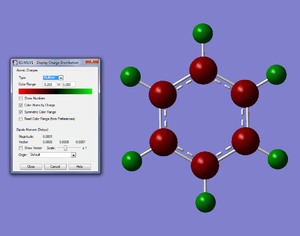
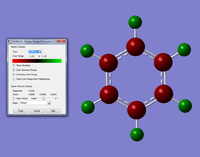
We know the optimisation has worked as it has converged and that the low frequencys are within +/- 15, from this we can say that our virtual molecule is a decent representation of the real thing. If we then take a look at the pi orbitals we can see what we would expect from benzene and these pi orbitals generally agree with the LCAO MOs, this gives further evidence to the reliability of our molecule. Finally the charge distribution is also what we expected with all the carbon atoms being the same charge and all the hydrogens being the same charge with the electrons being more electropositive than the carbon atoms. All these calculations seem to be strong agreement with data from 'real' benzene.
Boratabenzene
Item               Value     Threshold  Converged?
 Maximum Force            0.000159     0.000450     YES
 RMS     Force            0.000069     0.000300     YES
 Maximum Displacement     0.000894     0.001800     YES
 RMS     Displacement     0.000328     0.001200     YES
 Predicted change in Energy=-6.589668D-07
 Optimization completed.
 Low frequencies ---  -14.0387   -0.0008   -0.0007    0.0003    9.5455   14.6725
 Low frequencies ---  371.0132  404.6531  565.1753
For the .fchk file for the optimisation here and the .out file here and for the published data on Dspace click here. For the .fchk file for the frequency analysis here and the .out file here and for the published data on Dspace click here. For the .fchk file for the MO analysis here and the .out file here and for the published data on Dspace click here.
| Field | Results |
|---|---|
| C-C bond length | 1.40A |
| C-H bond length | 1.09A |
| C-C-C bond angle | 120 degrees |
| H-C-C bond angle | 124 degrees |
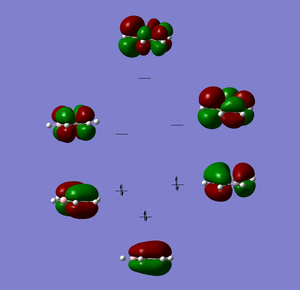
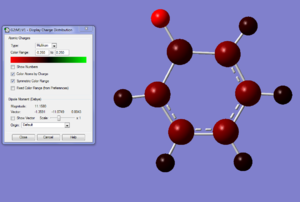
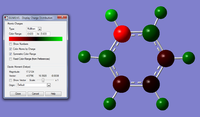
We know the optimisation has worked as it has converged and that the low frequencys are within +/- 15, from this we can say that our virtual molecule is a decent representation of the real thing. If we then take a look at the pi orbitals we can see what we can start to see the effect of adding in the bromine atom, the antibonding MOs have a lot more electron density around the boron atom and vice versa for the bonding MOs. The hydrogen that is connected to the boron is a lot more electronegative than the rest of the hydrogens. In the boratabenzene it appears as though there is no B-C double bonds, the picture looks like this because gaussian says its a double bond when the bond length is below a certain value, in this case it hasnt reached the value need for this to happen, but given the negative charge on the molecule we know there is aromoticity in the molecule and isoelectron to benzene so it is still directly comparable and this lack of a 'double bond' does not reflect on the nature of the molecule.
Pyridinium
Item               Value     Threshold  Converged?
 Maximum Force            0.000056     0.000450     YES
 RMS     Force            0.000020     0.000300     YES
 Maximum Displacement     0.000527     0.001800     YES
 RMS     Displacement     0.000129     0.001200     YES
 Predicted change in Energy=-4.638162D-08
 Optimization completed.
Low frequencies ---   -3.1827   -0.0004    0.0008    0.0009   11.3844   13.8823
 Low frequencies ---  401.5804  413.7095  640.1249
For the .fchk file for the optimisation here and the .out file here and for the published data on Dspace click here. For the .fchk file for the frequency analysis here and the .out file here and for the published data on Dspace click here. For the .fchk file for the MO analysis here and the .out file here and for the published data on Dspace click here.
| Field | Results |
|---|---|
| C-C bond length | 1.41A |
| C-H bond length | 1.10A |
| C-B bond length | 1.51A |
| H-B bond length | 1.22A |
| C-B-C bond angle | 115 degrees |
| C-C-C bond angle | 122 degrees |
| H-C-C bond angle | 120 degrees |

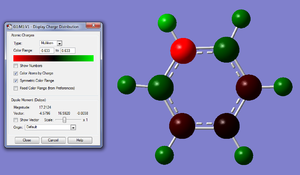
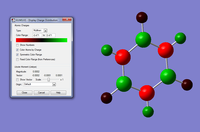
The optimisiation converged and the frequency analysis gave values between +/- 15. The Pi orbitals make sense and seem to be a good representation of the real pi system, we conclude by looking at the way the electronegativity affects bonding and anti bonding orbitals i.e. the most electronegative molecule should have the largest bonding orbitial and smallest anti bonding orbitial which looking at the first Pi orbital we can see that this is true. The charge distribution also seems to repersent what we know of the pyridium molecule, i.e. the electronegativity of nitrogen is having a noticeable effect on the charge of surrounding atoms. All of this goes to suggest that the pyridium calculations are a good representation of the real molecule and that they have a fairly high degree of accuracy.
Borazine
Item               Value     Threshold  Converged?
 Maximum Force            0.000223     0.000450     YES
 RMS     Force            0.000051     0.000300     YES
 Maximum Displacement     0.000492     0.001800     YES
 RMS     Displacement     0.000158     0.001200     YES
 Predicted change in Energy=-1.190510D-07
 Optimization completed.
Low frequencies --- -119.0275  -65.6674  -50.5158   -0.0010   -0.0005   -0.0004
 Low frequencies ---  238.8689  244.7092  443.3174
For the .fchk file for the optimisation here and the .out file here and for the published data on Dspace click here. For the .fchk file for the frequceny analysis here and the .out file here and for the published data on Dspace click here. For the .fchk file for the MO analysis here and the .out file here and for the published data on Dspace click here.
| Field | Results |
|---|---|
| C-C bond length | 1.39A |
| C-H bond length | 1.08A |
| C-N bond length | 1.36A |
| H-N bond length | 1.02A |
| C-N-C bond angle | 123 degrees |
| C-C-C bond angle | 119 degrees |
| H-C-C bond angle | 119 degrees |
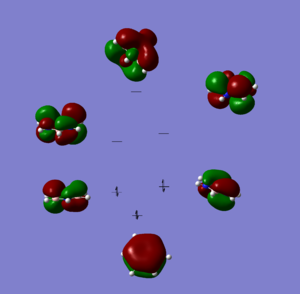
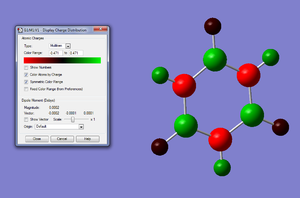
The optimisation for the borazine molecule has converged but the frequency analysis is very far out from what we expected, normally we would throw this result out and run the calculations again however this is the second attempt and the first got roughly the same result. If we take a look at the MOs and the charge distribution graph we can see that they are as we would expect for this molecule, there is nothing in those graphs to tell us that the simulation of this molecule has gone horribly wrong. Given the apparently realistic representation that the data gives and certain time constraints we have decided to continue using the results from this analysis however in this case we will look on any extreme behavior with a degree of skepticism and have a clear idea going into the analysis what degree of accuracy we are dealing with, to borrow a commonly used phase: we will take the results with a pinch of salt.
Charge Distribution
| Field | Results |
|---|---|
| N-H bond length | 1.01A |
| B-H bond length | 1.19A |
| B-N bond length | 1.43A |
| B-N-B bond angle | 123 degrees |
| N-B-N bond angle | 117 degrees |
| H-N-B bond angle | 119 degrees |
| H-B-N bond angle | 121 degrees |
MO Comparisons
Substitutional effects
We can now take a more qualitative look at the effects of substitutions and the effect of heteroatoms in aromatic systems. The observations we make have all come from the data collected in this work either directly or indirectly.
The LCAO contributions to the MOs
The LCAO for benzene is very simple due to the few types of atoms in the molecule, this means the LCAO are stronger and better for benzene than for any of the other molecules. As we start to introduce heteroatoms and atoms of different electronegativity we start to get a disruption in LCAO. This is due to the electronegativity difference in the molecules making the orbital overlaps less strong and hence reducing the LCAO contributions to the MOs, so the stabilisation effect of the bonds is reduced the more substitutionss we make to the aromatic system.
The energy of the MOs
The overall energy of any these molecule will be determined by the orbital overlap, if one molecule has really strong orbital overlap then it will be much lower energy than one in which the orbital overlap isn't strong or if there a strong anti bonding character. If we look first an benzene we can see very strong orbital overlap mainly due to the regular orbital size and the symmtery of the molecule, however looking at the fully bonding p orbital above boratabenzene has much less overlap between bonding orbitals than benzene, this is mostly due as mentioned to the electrostatic effect of adding heteroatoms to the aromtaic molecules. The same is also true for pyridinium where the orbital overlap is not as strong as for benzene due to the larger hole in one side but isn't as bad as boratabenzene. Generally then adding heteroatoms to the aromatic molecules reducing the orbital overlap by disrupting the orbitals therefore reducing the energy. For borazine the picture is different there is a increase in the energies of the MOs caused by less stabilisation by the bonding orbital this is due to the difference in electronegativty between nitrogen and boron compared to carbon-carbon bonds.
The degeneracy of the MOs
Benzene has many degenerate orbitals because all the atoms in the ring have the same energy and electronegativity so none of the molecular orbitals are being warped by heteroatoms, also all the carbons atoms in benzene are the same so the different orbitals levels all meet up nicely and are degenerate. When heteroatoms are added to this it not only disrupts the symmetry of the molecule making two orbitals that were degenerate no longer degenerate but also the energy of the orbital for each atom is lightly different due to the imbalance caused by the introduction of a heteroatom hence there is a break down of degeneracy. Borazine does not come under this category and its a completely different molecule with several axis of symmetry meaning that even though borazine is made up of as many different types of atoms as pyridinium or boratabenzene it will have more degeneracy as it is arranged more symmetric and hence more degenerate energy levels, however it will still have less than benzene as benzene has a lot more symmetry and less different types of atoms and hence less electronegativity difference.
References
- ↑ Julius Glaser and Georg Johansson, Acta Chemica Scandinavica A, 1982, 36, pp 125-135 DOI:10.3891/acta.chem.scand.36a-0125
| [C6H6] | [BC5H6]- | [NC5H6]+ | [B3N3H6] |
|---|---|---|---|
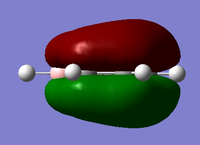
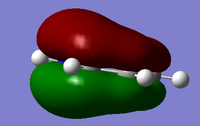
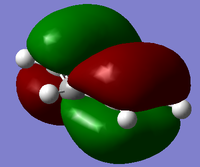
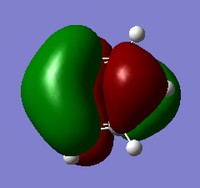
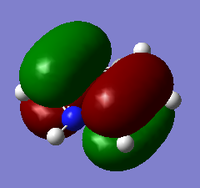
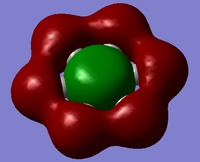
| Since we have looked at two pi system orbitals it makes sense to look at a sigma orbital, by far the easiest orbital to identify is the fully bonding orbital for an image of this file click here. This orbital was the 12th orbital so far lower in energy than the other too mainly due to the very good orbital overlap as seen in the diagram. | |||
 |
 |
 |

|
| Benzene is the perfect 3D representation of the LCAO from the diagram above, clearly having six orbitals all coming from one of the carbon atoms with a very strong bonding profile inside and outside the ring, the overlap of the orbitals that are inside the ring especially strong. However if we look at the boratabenzene where they isn't complete symmetry we start to get distributions to the large bonding ring, we know from the charge distribution graph that the carbon atoms bonded to the boron are more electronegative so we would expect them to have a larger orbital which they do, however we can also see the carbon para to the boron has a much larger electroneagtivity than both of these, this is mainly due to the reasonce forms of benzene so the negative charge can pass to different carbons and resides mostly on the para position, this all leads mostly to the disruption of the outer bonding ring of the orbital leading to less bonding outside the ring but more on the inside of the ring. We would expect a similar thing to happen to the pyridinium orbital expect the nitrogen will have a much larger orbital than the carbons, this much is represented in the MO diagram. However in this orbital all the carbons apart from the para position have a similar orbital sizes making the outer bonding ring much stronger than in boratabenzene and more benzene like, but the carbon in the para position has almost no orbital this could be put down to the lack of charge density at that atom as seen in the charge distribution graph. By far the most different from benzene borazine has a very strange orbital, this again is due to the electronegativity differences in the substituent atoms which is much more dramatic in borazine than any of the other molecules, this leads to very uneven bonding across the molecule and a very strange orbital shape. If we look at the orbital we can see that the nitrogen atoms seem to have small orbital while the boron atoms seem to have very large orbital this is the opposite of what else we have seen in this set of orbital, it almost appears to have some antibonding character in the orbital but it could just look that way due to the very strange orbital and the effect of electronegatvity. | |||

