Rep:Mod:trm08inorganic
Computational Chemistry Module 2: Bonding (Ab initio and density functional molecular orbital)
By Teddy Middlebrook 07/12/10
Part 1 – Optimising structures, frequency analysis, IR spectra and MO calculations
Aim: to optimise the ground state structure of TlBr3 when the point group of the molecule is set to D3h and to confirm that this structure is a minimum by frequency analysis.
Gaussian DFT calculations were used in the following examples. The calculation method used for both the optimisation and frequency calculations was B3LYP. The basis set used was LanL2DZ which uses a medium level basis set, D95V, for the first row atoms and a pseudo potential basis set, Los Alamos ECP, on heavier atoms so for the TlBr3 molecule the only basis set used was Los Alamos ECP. The method determines the approximations used in the calculation and the basis set determines the accuracy. Both the OPT and the FREQ calculations were carried out using the same method and basis set because for the optimised molecule structure obtained to be used in the frequency analysis the same approximations must be made in the frequency calculations as were made in the optimisation calculations otherwise the results would not mean anything. Also if different methods were used the frequency analysis would not be for the optimised structure it would be for a different one.
A frequency analysis can be carried out. The reason for doing this is to make sure that the optimised structure obtained is the lowest energy minimum rather than a maximum corresponding to a transition state. The way to check this is to look at the log file obtained for the calculation; if any of the frequency values are negative it shows that the actual minimum has not been reached and the molecule needs to be optimised again. This is because the frequency values given are the second derivative of the potential energy against bond length curve. To optimise the structures initially the structure was altered until the first derivative of that curve was equal to zero, however, this only tells us that a stationary point has been found but not whether that point is a maximum or a minimum.
With the TlBr3 molecule before the log file was examined a preliminary check to see if the optimised structure was the same one used for the frequency analysis was done by making sure that the energies given in the summary for both calculations are the same. In the case of TlBr3 this energy is -91.21812851 Hartree the program has been recorded the energies to more decimal places than are accurate, energy values obtained from this method are typically accurate to 10kJ/mol which is 0.0004 Hartree so it is better practice to record the energy values given by the program to 3d.p.
The low frequencies are reported in the log file as follows:
Low frequencies --- -3.4213 -0.0026 -0.0004  0.0015  3.936   3.9367
Low frequencies ---   46.4289   46.4292   52.1449
The first line of low frequencies are the motions of the centre of mass of the molecule, these should be close to zero compared to the ‘real’ frequencies listed on the line below which they are. The lowest ‘real’ normal mode is 46 cm-1. None of the values for the real frequencies are negative which shows that the structure is in fact the ground state rather than a transition state. The ‘real’ normal mode has a low frequency as expected because TlBr3 is a large, soft molecule the bonds are relatively weak. Especially when compared with the BH3 molecule later on which has a much higher lowest ‘real’ frequency of 1144 cm-1 this clearly shows the difference in bond strength. The ‘zero’ frequencies for TlBr3 are also much closer in magnitude to the TlBr3 ‘real’ frequencies this means that for softer molecules than TlBr3 it may become difficult to distinguish between the ‘zero’ and the ‘real’ frequencies of the vibrations, as the groups attached to the central atom get larger they interact with each other more so the central atom can vibrate more freely decreasing the distance between the ‘zero’ and ‘real’ frequencies.
Now that the optimised structure has been confirmed the properties of the molecule can be examined. Firstly the Tl-Br bond length was calculated to be 2.65 Å the literature value for this bond length is reported as between 2.46-2.68 Å[1] .This is for a coordinated TlBr4- crystal which may explain the slight difference in bond lengths, however, the values were compared to those obtained experimentally to see whether the calculations gave results of the right sort of value rather than for a quantitative comparison. Other properties measured included the bond angle which was 120° exactly which is as expected because the symmetry of the molecule was fixed as D3h.
The published opt file can be found here DOI:10042/to-6030
When the bond lengths of the molecule are altered manually or if a vibration is shown Gaussview does not draw the bonds that are expected, this is not because there is not a bond present but because the new bond length is longer than a set value that the program defines as a bond. This should be more flexible particularly for large, soft molecules. A chemical bond is an attractive interaction between two orbitals of the same symmetry which when brought within an optimum distance interact creating build up of charge density between the nuclei of two atoms. The electrons in these orbitals are now attracted to two nuclei rather than one. Due to the diffusivity of the orbitals the nuclei do not come close enough for the repulsion between them to overcome the stabilisation gained from the new molecular orbital formed.
References [1] Z. He, M. Zhub, G Ma, Acta Cryst., 2002, 58, pp647-649
Aim: to optimise the ground state structure of BH3, to confirm that this structure is a minimum by frequency analysis and from this to determine the vibrational spectrum and compare it to the literature spectrum. Once this is complete to draw the MO diagram complete with diagrams of the calculated molecular orbitals to see how accurate qualitative MO theory is.
The calculation method used was a Gaussian DFT B3LYP and a simple 3-21G basis set was used firstly to optimise the geometry of the molecule and then to do a frequency analysis. The energy for both the optimised structure and the molecule after the frequency analysis had the same value of -26.462 Hartree which meant that the same structure was analysed, the frequency analysis gave the following results:
Low frequencies --- -66.761 -66.3592 -66.3589 -0.0020 0.0031 0.2123
Low frequencies --- 1144.1483  1203.6414  1203.6425
The lowest ‘real’ frequency is 1144 cm-1 which shows that the optimisation of the molecule was successful as it is positive. These frequencies were then analysed more closely and their symmetry worked out.
The Calculated IR Spectrum of BH3
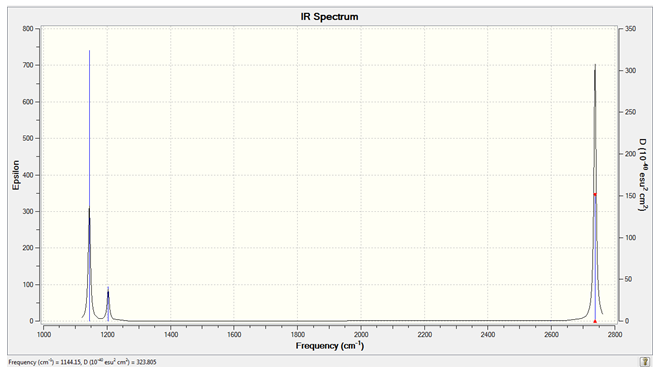
Only three peaks are visible despite there being 6 clear vibrations because the peaks at both 1203 and 2737 cm-1 are degenerate so they are seen as a single peak. The peak expected due to the vibration at 2598 cm-1 is not seen because it has an IR intensity of zero. This is because the stretch is totally symmetric in the D3h point group and in order for a peak to be seen in the IR spectrum a change in dipole moment must be observed, there is no such change because of the symmetry of the stretch so the vibration is said to be non IR-active.
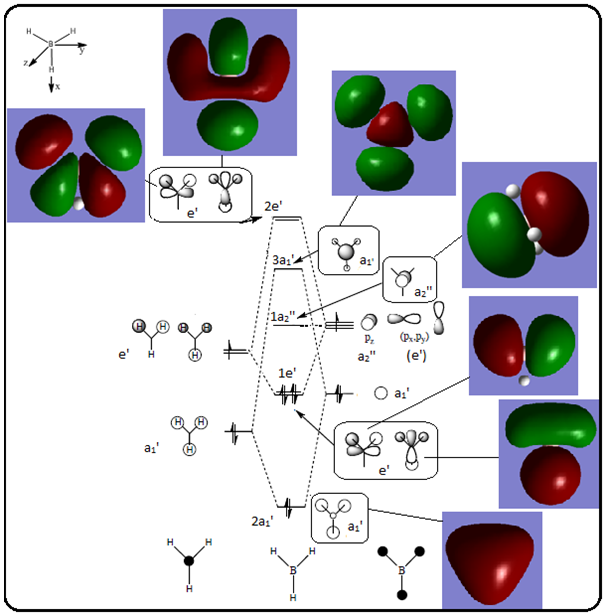
The Qualitative MO Diagram of BH3 complete with calculated orbital diagrams
 [1]
[1]
The significant differences between the real calculated MO’s and the LCAO qualitative MO’s are mainly with the highest energy molecular orbitals, for example the 2e’ MO made up from the py orbital is much more distorted than the LCAO predicts, the py contribution rather than having the lobes at 180° from each other has the lobes at an angle closer to 100°. The other 2e’ calculated MO has slightly differently shaped orbitals too. The relative contributions of the fragment orbitals in the a1’ calculated MO’s are different from those predicted; the lobe centred on B is smaller than in the predicted MO. It is not a coincidence that the calculated MO’s do not agree with the predicted ones as well for the higher energy orbitals, in fact it is because one of the key limitations with using the DFT method for calculating MO’s is that the method uses a self-consistency loop. This means a value for the charge density is calculated this is put into the Schrodinger equation which generates a wavefunction this wavefunction can then be used to calculate the charge density, this new charge density is then fed back into the Schrodinger equation where a new wavefunction is generated and the process continues. This method is very good at predicting the MO’s for occupied orbitals, however, when the orbitals are unoccupied there is no charge density so it does not work.
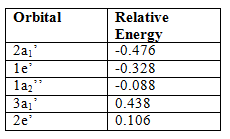
This shows that the qualitative LCAO approach predicts the calculated MO’s very well, however, one of the major limitations of this approach is that the relative energies of the molecular orbitals have to be predicted as well and that is not a trivial matter, using computational methods predicts these relative energies so that the MO’s can be placed in the right order at the right relative heights on the diagram. The relative energies of the calculated orbitals are as follows:
Computational methods are also useful in determining the exact contributions from the fragment orbitals.
References [1]http://www.huntresearchgroup.org.uk/teaching/teaching_MOs_year2/L3_Tut_MO_diagram_BH3.pdf
Part 2 – Looking at an Organometallic Complex: the isomers of Mo(CO)4L2
Aim: Use computational methods to predict the relative stabilities of the two isomers and to analyse their vibrational modes so that the experimental IR spectra can be explained.
To start with the two Mo(CO)4(PCl3)2 isomers were optimised using the DFT B3YLP method and the simple basis set and pseudo potential LANL2MB and the keywords “opt=loose” were added so that the calculation converged despite the low level basis set and assumptions used.
The job came back with no Mo-P bonds or P-Cl bonds, this is because as explained above Gaussian has a predefined set of values for the maximum and minimum bond lengths, these are usually accurate for organic molecules but less so for inorganic complexes. The bonds are still there they just do not show us as lines between atoms. The bond lengths of 2.53 and 2.48 for the cis and trans isomers respectively were the same as those obtained by one of my peers, however, my log file said that the calculation did not converge. The gradient obtained was 0.00028 which is less than 0.001 which means that it is close enough to zero. This is likely to be because of the starting orientation of the molecule, despite this the molecule has been optimised enough to go onto the next step and use a better basis set.
This basis set LANL2MB is good enough to determine reasonably accurate bond lengths and bond angles but the dihedrals calculated are not accurate so the basis set will be changed from LANL2MB to the more complex LANL2DZ where the convergence is much tighter so “opt=loose” can be replaced with “int=ultrafine scf=conver=9”. The only problem with this new basis set is that if the orientation of the molecule is not quite right when the optimisation calculation is run a different minimum may be found. A predetermined orientation that has been given (it was found using the rotational profile of both isomers) will therefore be used to determine the starting orientation of the molecule.
The links to the outputs for the optimised isomers for both basis sets are given below: LANL2MB Cis isomer: DOI:10042/to-5719 Trans isomer: DOI:10042/to-5720
LANL2DZ Cis isomer: DOI:10042/to-5736 Trans isomer: DOI:10042/to-5722
Frequency analysis was then carried out for the isomers optimised using LANL2DZ. The following results were produced:
For the cis isomer
Low frequencies--- -1.8970 -0.0007  -0.0003  0.0001  1.0582  1.4881
Low frequencies---  10.8139   17.6510   42.0401
For the trans isomer
Low frequencies--- -2.2125  -1.6008  0.0001  0.0004  0.0006  3.0968
Low frequencies---   5.1562    6.2164   37.2050
The output files for the frequency analysis are given in the links below: Cis isomer: DOI:10042/to-5735 Trans isomer: DOI:10042/to-5718
The frequencies for both isomers show that a minimum has been reached as there are no negative frequencies below -5 cm-1. Now that the optimisation has been confirmed the geometries of the molecule can be compared with the literature.
For the cis isomer the P-Mo-P angle is 94.66° (lit. 94.78°)[1], the Mo-P bond length is 2.527 Å (lit. 2.529 Å)[1] the literature values were obtained using X-ray crystallography. N.B. the literature values are for -PMe2Ph instead of PCl3 which may account for the slight difference between the values but otherwise the values are extremely close.
The Mo-P bond length is longer for the cis molecule which you might expect as ligands trans to each other may undergo a slight Jahn-Teller distortion which stabilises the molecular orbitals of the molecule. The Mo-P bond length for the trans molecule is 2.44 Å and the P-Mo-P bond length is 177°.
The trans molecule has the slightly shorter Mo-P bond lengths of 2.44 Å and four Mo-C bonds all of equal length of 2.06 Å. The cis molecule, however, has two Mo-P bond lengths of 2.53 Å the Mo-C bonds situated equatorially around the central metal atom have bond lengths of 2.06 Å but the two Mo-C bonds in the axial position have a bond length of 2.10 Å, this could also be due to the Jahn-Teller effect but a lengthening rather than a shortening.
The isomers are of differing energies, the cis isomer has an energy of -623.577 Hartree and the trans isomer has an energy of -623.576 Hartree. This means that the cis isomer is more stable than the trans isomer, this is the opposite to what I would expect. Usually the largest groups in this case PCl3 are ideally as far away from each other as possible to minimise steric hindrance and unfavourable electronic interactions, high symmetry is also usually favoured and the trans isomer is more symmetric, also when the two PCl3 groups are cis to each other the octahedral geometry is distorted slightly so that the two axial CO groups are pushed towards the other CO atoms and I would expect this distortion to require a lot of energy therefore I cannot rationalise why the cis isomer is more stable than the trans. If the energies of the isomers are converted into kJ/mol the energy difference between the isomers is 2.79 kJ/mol which is a relatively small amount.
A relatively straightforward way to alter the relative stabilities of the isomers and therefore alter the reactive ordering is to use phosphorus ligands which can form a cyclic and therefore bidentate ligand by making R1,2 =Me, Me and R3= H for one phosphorus atom and R1,2=Me,Me and R3= CH2=CH2 for example:
Or simply start with a bidentate phosphorus ligand, if the P atoms were now trans there would be a lot of strain in the ring destabilising the trans isomer by a large amount. If the molecule has a more stable cis conformation then a way to make the trans isomer the more stable one would be to make the R group very large e.g. use PtBu3 calculations will not be run on this molecule as it is too large and would take too much time.
There are a few differences between the cis and the trans isomer the key difference can be seen in the peaks at around 2000cm-1. The more symmetric the molecule the fewer IR active bands there are, so for the complex being studied more bands are expected to be seen for the cis isomer specifically the CO bands between 1750-2100 cm-1, which is indeed the case. For the cis isomer there are four bands at 1945, 1948, 1958 and 2023 cm-1 (lit. 1897, 1908, 1927 and 2023 cm-1)[3] which is consistent with the literature (the literature values shown are actually for Mo(CO)4(PPh3)2 so the stretches will be slightly different, the main point is that there are the same number of bands). The trans isomer has two bands at 1950 and 1951 cm-1 (lit. 1891 cm-1) the stretch is slightly different from the literature value because it is also for Mo(CO)4(PPh3)2 rather than for Mo(CO)4(PCl3)2 the key difference is that the literature reports one stretch and there are two present on the calculated spectrum.
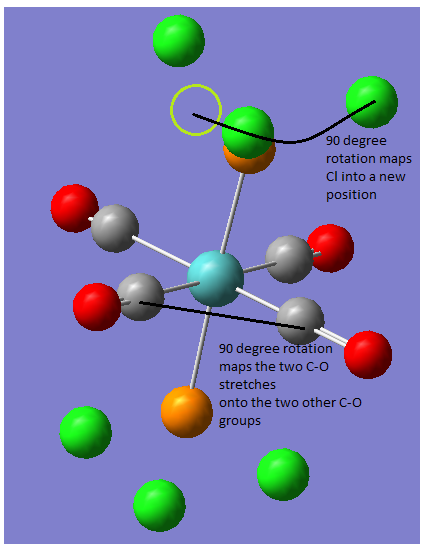
From looking at the animated stretches it is clear that they are the same stretch but on two different pairs of atoms they occur at two different frequencies due to the symmetry of the molecule. One mode of vibration cannot be mapped onto the other because both a 90° rotation or an improper rotation map the carbonyls onto each other but the chlorine atoms are not mapped onto each other i.e. there are two different modes of vibration. This means that two peaks are expected for the molecule, they are at such close frequencies because the positions of the chlorine atoms have a very minor effect on the energy of the vibration.
So it is possible that the peak reported in the literature is actually two slightly broad peaks that are very close together, the broadening could be due to excess polar solvent being present as polar solvents broaden CO peaks. [5]
It is ok to compare the complex calculated when R=Cl with R=PPh3 because they have a similar electronic contribution to the bonding in the complex and are both sterically quite big. R=PPh3 was the molecule that was to be investigated but R=Cl was used because of the similarities above and because it is more simple it requires a lot less computation. The low frequency vibrations are now going to be examined.
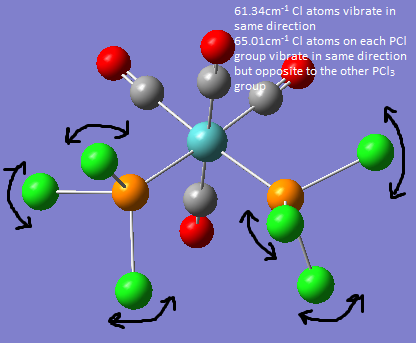
If a vibration has a very low frequency and therefore a very low energy it is likely to be vibrating at room temperature. The low frequency vibrations are shown in the picture below.
The vibrations from the trans molecule are much lower in energy than the corresponding vibrations of the cis molecule this is because the cis vibrations cause the rest of the molecule to vibrate much more i.e. the metal atom and the CO groups are all displaced more with the vibration.
References
[1] F. Cotton, D. Darensbourg, S. Klein, B. Kolthammer, Inorg. Chem., 1982, 21, pp294-299
[2] P. Treichel, W. Wong, Inorganica Chimica Acta., 1979, 338, pp171-175
[3] D. J. Darensbourg and R. L. Kemp, Inorg. Chem. 1978, 17, 2680
[4] G. Hogarth. T. Norman, Inorganica Chiraica Acta, 254, 1997, p 167-171
[5] M. Y. Darensbourg and D. J. Darensbourg, J. Chem. Ed. 1970, 47, 33
MINI PROJECT
Aim: To investigate the inert pair effect as you go down group 13 and see how the sp character of the bonds change quantitatively, how the MO’s change and how the geometries change.
Firstly the following molecules will be optimised BCl3, AlCl3, GaCl3, InCl3, TlCl3 and BCl, AlCl, GaCl, InCl, TlCl the optimised geometries and the sp character of the bonds in all of these cases will be examined.
The method used for both BCl3 and AlCl3 was DFT B3LYP and the basis set was 6-311G(d,p) the frequencies calculated for these molecules after optimisation are as follows: (note the links published by each molecule are in the order optimisation files, frequency files, NBO files).
BCl3 DOI:10042/to-6031 DOI:10042/to-6032 DOI:10042/to-6061
Low frequencies--- -0.0549 -0.0214 -0.0045  4.1820  4.1820 12.5033
Low frequencies--- 258.6659  258.6669  449.9294
Sum of electronic and thermal Free Energies= -1405.673101
AlCl3 (with 6-311G(d,p))DOI:10042/to-6033 DOI:10042/to-6034 DOI:10042/to-6062
Low frequencies --- -8.1134 -7.4303 -7.4303 -0.0056  0.0278  0.0350
Low frequencies --- 143.8593  143.8620  196.7112
Sum of electronic and thermal Free Energies= -1623.363167
A pseudo potential must be used on the heavier atoms I will also use it on AlCl3 and AlCl to see the difference between using a pseudo potential and not using one to determine whether comparisons between results obtained using the two different methods can be compared. Energies cannot be compared as using PP removes electrons.
AlCl3 (with GEN with the keywords “pseudo=cards gfinput” manually edited so that LanL2DZ is run on the group 13 atom and 6-311G(d,p) is run on Cl)DOI:10042/to-6056 DOI:10042/to-6058 DOI:10042/to-6067
Low frequencies ---   -3.7315   -3.7315   -2.6485    0.0030    0.0053    0.0343
Low frequencies ---  135.7731  135.7744  186.3322
Sum of electronic and thermal Free Energies= -1382.860977
GaCl3 DOI:10042/to-6037 DOI:10042/to-6038 DOI:10042/to-6064
Low frequencies --- -3.0417 -3.0417 -0.0407  0.0052  0.0087  3.1913
Low frequencies --- 123.3622  123.3630  130.6877
Sum of electronic and thermal Free Energies= -1382.908508
InCl3 DOI:10042/to-6039 DOI:10042/to-6040 DOI:10042/to-6070
Low frequencies --- -4.4665 -4.4665 -2.9168 -0.0042  0.0066  0.0305
Low frequencies ---  93.9668   93.9676  100.1146
Sum of electronic and thermal Free Energies= -1382.733472
TlCl3 DOI:10042/to-6041 DOI:10042/to-6042
Low frequencies- -36.1917 -23.5464 -11.1086 -0.0031 -0.0029 -0.0027
Low frequencies ---   65.6706   65.7309   69.3593
Sum of electronic and thermal Free Energies= -1432.407356
The monovalent results are listed below:
BCl DOI:10042/to-6043 DOI:10042/to-6044 DOI:10042/to-6065
Low frequencies ---   -0.0054   -0.0054    0.0021   12.3337   12.3337  815.4082
Sum of electronic and thermal Free Energies= -485.033804
AlCl (with 6-311G(d,p)) DOI:10042/to-6045 DOI:10042/to-6046 DOI:10042/to-6066
Low frequencies ---  -17.2730  -17.2730   -0.0044   -0.0044   -0.0040  449.1702
Sum of electronic and thermal Free Energies= -702.756453
AlCl (with pp) DOI:10042/to-6059 DOI:10042/to-6060 DOI:10042/to-6069
Low frequencies ---  -14.8247  -14.8247   -0.0018   -0.0018    0.0018  400.6377
Sum of electronic and thermal Free Energies= -462.289765
GaCl DOI:10042/to-6048 DOI:10042/to-6068 DOI:10042/to-6072
Low frequencies ---    0.0031    0.0031    0.0038    2.1408    2.1408  314.9695
Sum of electronic and thermal Free Energies= -462.365696
InCl DOI:10042/to-6051 DOI:10042/to-6052
Low frequencies ---   -7.9585   -7.9585    0.0015    0.0016    0.0016  276.9402
Sum of electronic and thermal Free Energies= -462.201232
TlCl DOI:10042/to-6053 DOI:10042/to-6054
Low frequencies ---   -0.0020   -0.0012   -0.0012   51.9831   51.9831  252.2932
Sum of electronic and thermal Free Energies= -511.947575
Some of the frequencies calculated are below -5 if the molecule was more complex then it would be likely that a transition state has been formed rather than the actual optimised structure, however, there are no transition states for the simple planar molecules that are being examined so I am assuming that the optimised structures have been found.
Now that all of the structures have been optimised and frequency calculations run to make sure that they are indeed the optimised structures the s and p character of the orbitals can be analysed for each molecule by calculating the NBO’s using the same methods as above. N.B. there is a small amount of d-character in almost all of the bonds listed below it is only mentioned when it contributes a significant amount.
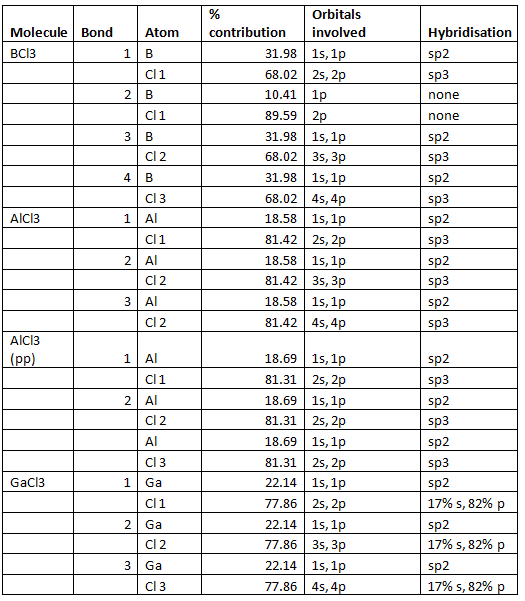
The output from BCl3 was analysed and the following results were obtained. The first bond between B and Cl, B orbitals contribute 31.98% and they are sp2 hybridised and 68.02% comes from the Cl orbitals which have 27.24% 2s character and 72.46% 2p character which shows sp3 hybridisation.
In the second bond between B and Cl the B 1p-orbitals contribute 10.41% and the Cl 2p-orbitals contribute 89.59%. In the third bond the B sp3 orbitals contribute 31.98% and the Cl orbitals which have 27.24% s character and 72.46% p character contribute 68.02% in the same way as the first bond. The fourth bond is the same as the first and third bond but with the 4s and 4p electrons.
The results for the rest of the molecules are summarised in the table below.
Values were not obtained for the heavy atoms In and Tl because their atomic numbers are to high to use the 6-311G(d,p) basis set to do the NBO analysis, CEP-31G was used instead, however, the error message
There are 50 occupied orbitals but only 31 basis functions!
was in the output file. The file was then edited to contain the command '# b3lyp/cep-31G pop=(nbo,full) geom=connectivity' and run again but there were still problems with the basis set a new error message came up:
Subroutine NAOANL could not find a S-type valence orbital on atom In 1.
Despite these difficulties the trends between the other atoms of the group can be still be analysed without In and Tl the NBO analysis file with the job that failed is published next to InCl3 with the optimisation and frequency files above.
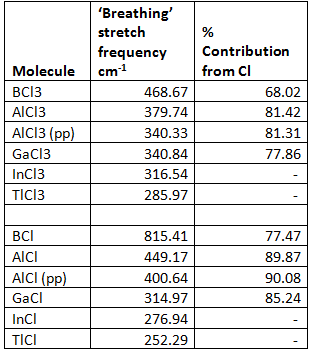
If the ‘breathing’ stretches of the molecules are examined (where the length of the all of the M-Cl bonds stretch in a concerted way) the strength of the bonds can be examined and a relationship between the relative contributions to the bond from the Cl and B atoms can be determined.
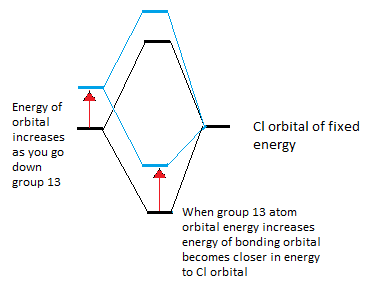
So far as you go down group 13 the contribution from the Cl atom to the bond has increased, this is because the energy of the group 13 atom will increase so the separation between the orbital from this atom and the Cl orbitals will increase, the bonding orbital will increase in energy slightly and will therefore get closer to the Cl energy so it resembles the Cl orbital and there will be a greater contribution into the bonding orbital from the Cl. This is shown in the diagram below.
The ‘breathing’ stretch and contribution from Cl was analysed for both the trivalent and monovalent compounds. The results are below:
From this you can see that as you go from BCl3 to AlCl3 the energy of the stretch does indeed decrease as the contribution to the bond from Cl increases because the orbital from Al is higher in energy than the B orbital.
Using pp does not have a huge effect on the Al molecule but there are slight differences, however, it is close enough that general trends can be seen. The GaCl3 molecule does not quite fit, the percentage contribution from Cl is too high this could be due to the fact that pp was used instead of 6-311G(d,p).
There is no clear trend between the linear molecules percentage contribution from Cl and the ‘breathing’ stretch frequency as you go down the group. I did not expect this to be a simple relationship as there is a balance between the size of the group 13 atom and the inert pair effect. As the size of the group 13 atom increases, as with the trivalent species, the bond is likely to weaken as the orbital overlap is not as good, this can be seen going from BCl to AlCl. However, the inert pair effect must be taken into account, as you go down group 13 the separation of the s and p orbitals increases which means that the energy required to promote electrons from the s2px1 to s1px1py1 increases so the lower +1 oxidation state is more stable than the +3 for the very large atoms. This is not the whole story as if this effect depends solely on the stability of the s orbitals relative to the p orbitals then the ionisation potentials for the different atoms would support this which is not the case Ga in fact has more stabilised s orbitals than Tl[1] but d-block contraction has been used to explain this where Ga3+ is actually closer in size to Al3+.
Another way to explain this observation is that the bonds become less covalent as the oxidation state goes from +3 to +1 they go from being sp2 to a situation in which just the p electrons are involved in bonding. This is shown clearly in the table above the contribution from the s orbital decreases from 33% in the sp2 trivalent compounds to around 12% in the monovalent compounds.
References
[1] R. S. Drago, J. Phys. Chem., 1958, 62, pp353–357


