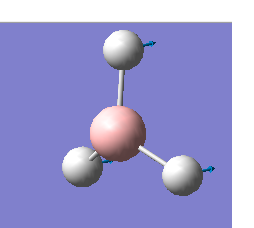
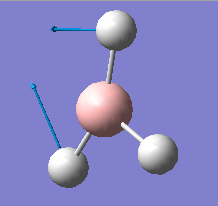
Rep:Mod:tb122
Module 2 - Stephanie Martinez
BH3
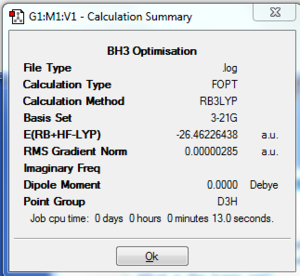
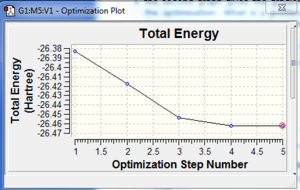
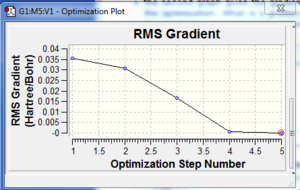
A molecule of BH3 was drawn using Gaussview 3 and optimised using the B3LYP method. The B-H bond length was found to be 1.19 Å, and the H-B-H bond angle to be 120.0°. The RMS gradient norm was found to be considerably under 0.001, indicating that the optimisation process was successful. This has been confirmed by viewing the log file, which shows the forces to be converged. The optimisation graphs resulting from the optimisation process are also displayed. They show how the total energy of the molecule and the RMS gradient decrease as the optimisation proceeds, until a minimum point is reached. Looking at the molecule at each step in the optimisation process, the bond angle has decreased with each step (from a maximum of 1.50 Å), while the bond angle has remained constant at 120.0°. The bonds were not drawn in by Gaussview until the fourth step (the optimisation took five steps in total).

A quantitative MO analysis was performed on the optimised molecule, to give graphical results depicting each molecular orbital present. The calculations were run on the HPC servers[1]. The MOs are depicted in the MO diagram on the right[2]. The MO analysis shows a remarkable similarity to the MOs generated using MO theory manually. This would appear to show that MO theory can be useful for predicting the MOs of simple inorganic molecules.

With this complete, the log file was used to perform a natural bond orbital (NBO) analysis.

Gaussview has the ability to view the charge distribution on a molecule that has had a population analysis run on it. Colour-coding the charge showed the boron atom to be green, while the hydrogen atoms were red. Green is indicative of a positive charge, while red corresponds to a negative charge. The boron in this molecule is electron deficient, which agrees with the green colour seen. It is also possible to view numbers for the charge. The three hydrogen atoms all have a charge number of -0.11; for boron it is 0.33. More detail can be seen in the log file:
Summary of Natural Population Analysis:
                                      Natural Population
               Natural  -----------------------------------------------
   Atom  No    Charge         Core      Valence    Rydberg      Total
-----------------------------------------------------------------------
     B    1    0.33127      1.99904     2.66969    0.00000     4.66873
     H    2   -0.11042      0.00000     1.11010    0.00032     1.11042
     H    3   -0.11042      0.00000     1.11010    0.00032     1.11042
     H    4   -0.11042      0.00000     1.11010    0.00032     1.11042
=======================================================================
  * Total *    0.00000      1.99904     6.00000    0.00097     8.00000
(Occupancy) Bond orbital/ Coefficients/ Hybrids
---------------------------------------------------------------------------------
    1. (1.99851) BD ( 1) B   1 - H   2
               ( 44.49%)   0.6670* B   1 s( 33.33%)p 2.00( 66.67%)
                                           0.0000  0.5774  0.0000  0.0000  0.0000
                                           0.8165  0.0000  0.0000  0.0000
               ( 55.51%)   0.7451* H   2 s(100.00%)
                                           1.0000  0.0000
    2. (1.99851) BD ( 1) B   1 - H   3
               ( 44.49%)   0.6670* B   1 s( 33.33%)p 2.00( 66.67%)
                                           0.0000  0.5774  0.0000 -0.7071  0.0000
                                          -0.4082  0.0000  0.0000  0.0000
               ( 55.51%)   0.7451* H   3 s(100.00%)
                                           1.0000  0.0000
    3. (1.99851) BD ( 1) B   1 - H   4
               ( 44.49%)   0.6670* B   1 s( 33.33%)p 2.00( 66.67%)
                                           0.0000  0.5774  0.0000  0.7071  0.0000
                                          -0.4082  0.0000  0.0000  0.0000
               ( 55.51%)   0.7451* H   4 s(100.00%)
                                           1.0000  0.0000
    4. (1.99904) CR ( 1) B   1           s(100.00%)
                                           1.0000  0.0000  0.0000  0.0000  0.0000
                                           0.0000  0.0000  0.0000  0.0000
    5. (0.00000) LP*( 1) B   1           s(100.00%)
Second Order Perturbation Theory Analysis of Fock Matrix in NBO Basis
    Threshold for printing:   0.50 kcal/mol
                                                                             E(2)  E(j)-E(i) F(i,j)
        Donor NBO (i)                     Acceptor NBO (j)                 kcal/mol   a.u.    a.u.
===================================================================================================
within unit  1
  4. CR (   1) B   1                / 10. RY*(   1) H   2                    1.51    7.55    0.095
  4. CR (   1) B   1                / 11. RY*(   1) H   3                    1.51    7.55    0.095
  4. CR (   1) B   1                / 12. RY*(   1) H   4                    1.51    7.55    0.095
Natural Bond Orbitals (Summary):
                                                           Principal Delocalizations
          NBO                        Occupancy    Energy   (geminal,vicinal,remote)
====================================================================================
Molecular unit  1  (H3B)
    1. BD (   1) B   1 - H   2          1.99851    -0.43697
    2. BD (   1) B   1 - H   3          1.99851    -0.43697
    3. BD (   1) B   1 - H   4          1.99851    -0.43697
    4. CR (   1) B   1                  1.99904    -6.64515  10(v),11(v),12(v)
    5. LP*(   1) B   1                  0.00000     0.67699
    6. RY*(   1) B   1                  0.00000     0.37186
    7. RY*(   2) B   1                  0.00000     0.37186
    8. RY*(   3) B   1                  0.00000    -0.04544
    9. RY*(   4) B   1                  0.00000     0.43447
   10. RY*(   1) H   2                  0.00032     0.90032
   11. RY*(   1) H   3                  0.00032     0.90032
   12. RY*(   1) H   4                  0.00032     0.90032
   13. BD*(   1) B   1 - H   2          0.00149     0.41092
   14. BD*(   1) B   1 - H   3          0.00149     0.41092
   15. BD*(   1) B   1 - H   4          0.00149     0.41092
      -------------------------------
             Total Lewis    7.99457  ( 99.9321%)
       Valence non-Lewis    0.00447  (  0.0559%)
       Rydberg non-Lewis    0.00097  (  0.0121%)
      -------------------------------
           Total unit  1    8.00000  (100.0000%)
          Charge unit  1    0.00000

Following on from this, a vibrational analysis was performed on the optimised BH3 molecule. The objective of this was to confirm whether the structure is a minimum, or a transition state (and whether the optimisation was fully completed). The energy as noted in the summary was the same as in the summary for the optimisation process (to at least 8 decimal places), confirming that the analysis was successfully applied to the fully optimised molecule.
Full mass-weighted force constant matrix:
Low frequencies ---   -0.6560   -0.0171   -0.0021   20.1987   21.4875   21.4975
Low frequencies --- 1145.7148 1204.6589 1204.6599
Diagonal vibrational polarizability:
       0.6041804       0.6041102       1.9004460
Harmonic frequencies (cm**-1), IR intensities (KM/Mole), Raman scattering
activities (A**4/AMU), depolarization ratios for plane and unpolarized
incident light, reduced masses (AMU), force constants (mDyne/A),
and normal coordinates:
                    1                      2                      3
                   A"                     E'                     E'
Frequencies --  1145.7148              1204.6589              1204.6599
Red. masses --     1.2531                 1.1085                 1.1085
Frc consts  --     0.9691                 0.9478                 0.9478
IR Inten    --    92.6991                12.3789                12.3814
Atom AN      X      Y      Z        X      Y      Z        X      Y      Z
  1   5     0.00   0.00   0.16     0.00   0.10   0.00    -0.10   0.00   0.00
  2   1     0.00   0.00  -0.57     0.00   0.08   0.00     0.81   0.00   0.00
  3   1     0.00   0.00  -0.57    -0.38  -0.59   0.00     0.14   0.38   0.00
  4   1     0.00   0.00  -0.57     0.38  -0.59   0.00     0.14  -0.38   0.00
The six values in the first 'low frequencies' row are the motions of the centre of mass of the molecule. The highest (21.50 cm-1) is an order of magnitude smaller than the lowest of the vibrational frequencies (1145.71 cm-1) which shows a high level of accuracy given that the calculation method employed was not very accurate. In a perfectly accurate method, all six low frequencies would be zero.
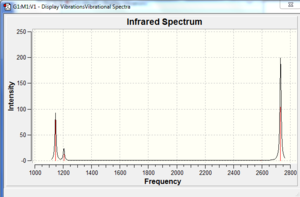
The resultant IR spectrum is displayed to the right. Although there are six vibrations, they are not all seen in the spectrum because two are doubly degenerate.
TlBr3

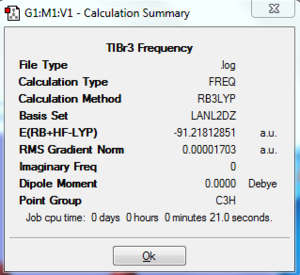
A molecule of TlBr3 was created and optimised using the B3LYP DFT method[3]. A medium level basis set was used (LanL2DZ), and the symmetry restricted to the D3h point group. The optimised Tl-Br bond length was found as 2.65 Å, and the Br-Tl-Br bond angle as 120.0°. Frequency analysis was then performed to confirm that this is the optimised structure. The same calculation method and basis set as before were used, otherwise comparison between the two would not be valid. The energy seen in both calculation summaries are the same, therefore the analysis was performed on the correct optimised file. As seen in the log file, all of the frequencies are positive, and are of an order of magnitude higher than the low frequencies (~46 cm-1 compared to ~4 cm-1).
Low frequencies ---   -3.4226   -0.0026   -0.0004    0.0015    3.9361    3.9361
Low frequencies ---   46.4288   46.4291   52.1449
Diagonal vibrational polarizability:
      61.4731283      61.4708056      57.8641693
Harmonic frequencies (cm**-1), IR intensities (KM/Mole), Raman scattering
activities (A**4/AMU), depolarization ratios for plane and unpolarized
incident light, reduced masses (AMU), force constants (mDyne/A),
and normal coordinates:
                    1                      2                      3
                   E'                     E'                     A"
Frequencies --    46.4288                46.4291                52.1449
Red. masses --    88.4613                88.4613               117.7209
Frc consts  --     0.1124                 0.1124                 0.1886
IR Inten    --     3.6867                 3.6867                 5.8466
Atom AN      X      Y      Z        X      Y      Z        X      Y      Z
  1  81     0.00   0.28   0.00    -0.28   0.00   0.00     0.00   0.00   0.55
  2  35     0.00   0.26   0.00     0.74   0.00   0.00     0.00   0.00  -0.48
  3  35    -0.43  -0.49   0.00    -0.01   0.43   0.00     0.00   0.00  -0.48
  4  35     0.43  -0.49   0.00    -0.01  -0.43   0.00     0.00   0.00  -0.48
                    4                      5                      6
                   A'                     E'                     E'
Frequencies --   165.2685               210.6948               210.6949
Red. masses --    78.9183               101.4032               101.4032
Frc consts  --     1.2700                 2.6522                 2.6522
IR Inten    --     0.0000                25.4830                25.4797
Atom AN      X      Y      Z        X      Y      Z        X      Y      Z
  1  81     0.00   0.00   0.00     0.42   0.00   0.00     0.00   0.42   0.00
  2  35     0.00   0.58   0.00     0.01   0.00   0.00     0.00  -0.74   0.00
  3  35     0.50  -0.29   0.00    -0.55   0.32   0.00     0.32  -0.18   0.00
  4  35    -0.50  -0.29   0.00    -0.55  -0.32   0.00    -0.32  -0.18   0.00
Isomers of Mo(CO)4(PCl3)2
Compounds of the form Mo(CO)4L2 have the ability to form either a cis- or a trans- complex (with regards to the placement of the L ligands). Both such isomers of Mo(CO)4(PCl3)2 have been created in Gaussview and optimised using a DFT 3BLYP method, with a LANL2MB basis set[4][5]. The additional keyword of 'opt=loose' was also used. PCl3 ligands were used instead of the more familiar PPh3 ligands in order to reduce the number of atoms in the molecule and to therefore reduce the time needed for calculations. This works because Cl is of a similar size and has similar electronic properties to PPh3.
This initial optimisation yielded the following data:
| Trans- | Cis- | |
|---|---|---|
| Mo-P Bond Length /Å | 2.48 | 2.53 |
| Mo-C Bond Length (trans) /Å | 2.11 | 2.11 |
| Mo-C Bond Length (cis) /Å | - | 2.06 |
| P-Cl Bond Length /Å | 2.40 | 2.40 |
In both molecules, the program did not draw in the P-Cl bonds. Gaussview will only draw in bonds if they are under the pre-programmed distance that has been defined as a bond; in this case, 2.40 Å must be greater than the distance allowed for a P-Cl bond. Inorganic bonds are often longer than organic bonds, and Gaussview does not seem as ready to deal with them. The lack of a bond in the program does not mean that a bond is not present in reality. A bond is a sharing of electron density that creates an attractive force between two atoms/molecules, thereby holding together a structure.
Both outputs gave very small RMS gradient norms (the highest, the cis isomer, was in the order of 0.0002 a.u.). This would indicate that optimisation was complete. However, there was still room for improvement. The process did not optimise the dihedral angles in the PCl3 group, therefore this is something that could be altered manually, and the molecule re-optimised.
For the second optimisation, the same method was used except a medium level basis set was used (LANL2DZ) and the following keywords were added: 'scf(conver=9) int=ultrafine'[6][7]. This was to improve the accuracy of the optimisation process. This time, the RMS gradient norms were lower (for the trans isomer, 0.00002 a.u.). These fully optimised structures had the following bond lengths:
| Trans- | Cis- | |
|---|---|---|
| Mo-P Bond Length /Å | 2.44 | 2.51 |
| Mo-C Bond Length (trans) /Å | 2.06 | 2.06 |
| Mo-C Bond Length (cis) /Å | - | 2.01 |
| P-Cl Bond Length /Å | 2.40 | 2.24 |
The bond lengths have clearly decreased compared to the first optimisation. However, the P-Cl bonds were still not drawn in. The relative energies are the same for both isomers: -623.58 a.u.. This would mean that it is very difficult to tell which is the more stable isomer from this computational analysis alone. According to literature, the cis-isomer is more stable (when L = PPh3)[8], which means that there must be an effect that Gaussview has been unable to take into account. Although greater steric hindrance would be expected in the cis isomer, elcetronic stabilisation outweighs this.
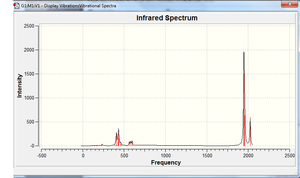
Having checked all the log files to ensure the optimisation was complete, it was possible to perform a frequency analysis on both isomers. The analysis was performed using the same calculation method and basis set as before[9][10]. The log files of these processes can be analysed in turn to determine if a true minimum has been found. All the frequencies for both compounds are positive, therefore a true minimum has been found.
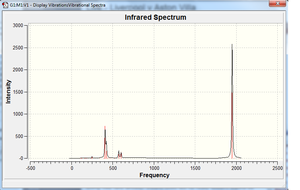
The calculated IR spectra are shown on the right. The usual IR absorption range for carbonyls bonded to metal centres is 2170-1790 cm-1[11]. In both spectra, peaks can clearly be seen in this region. In the cis- compound, two peaks are present; in the trans- compound, only one can be seen. The differences in the spectra can be explained with group theory[12]. The isomers have different point groups (cis: C2v; trans: D4h), and will therefore be broken down into different irreducible representations. For the cis isomer, there are four contributing species that are all infrared active (2A1, B1, B2) - this leads to four theoretical peaks. For the trans isomer, only one component is infrared active - Eu (the inactive components are A1g and B1g). This leads to only one C=O peak being seen in the spectrum. The peaks in the region 300-700 cm-1 can be attributed to the metal-carbon stretches and metal-C=O bends.
Closer inspection of the frequency data for both compounds reveals that there are actually four peaks (which are too close together to be distinguished on the spectrum). For the cis compound, these are as follows (/cm-1): 1945, 1949, 1958, 2023.
Mini-Project: Isomers of Cyclic Thiolated Gold Clusters
Thiolated cyclic gold clusters are a precursor molecule in the formation of some gold nanoparticles[13]. The form of such compounds is not entirely known, but crystallographic studies have shown that it is likely they take the form of a ring. Many different sizes of rings have been theorised, although ring tetramers with the form: (RSAu)4 are one real possibility. Studies of various sizes of cyclic gold thiolates have been performed using a methyl group as 'R'[14]. This 'R' group has been chosen to make the calculations simpler. One question that has arisen during the modelling of these rings is the stereochemistry of the methyl groups in relation to the plane of the ring. In order to compare the output energies of models in Gaussview, only systems with the same molecular formula can be compared. Therefore, three different configurations will be considered: two molecules of cis-(MeSAu)2(1), two molecules of trans-(MeSAu)2(2), and the tetramer (MeSAu)4(3).

The three groups have been drawn in Gaussview and optimised under the following conditions: B3LYP method, LANL2MB basis set (medium level)[15][16][17]. The basis set was chosen with consideration of the size of the molecule - for a larger molecule, a lower level basis set would have been used.
Upon optimisation, all three groups assumed a planar ring system - the only differences being in the stereochemistry of the methyl groups. In 1, the methyl groups were all pointing up, in the same direction; in 2, two adjacent groups pointed up while the other two pointed down; in 3, the groups alternated up and down. Bond lengths and bond angles in the ring were the same for all three. It is therefore assumed that forming a ring tetramer is more stable than separate dimers. The resulting structures were all optimised according to the log file, and had the following energies:
| Group | Energy /a.u. |
|---|---|
| 1 | -740.19 |
| 2 | -740.20 |
| 3 | -740.20 |
The energies vary very slightly between the isomers. The effect of the stereochemistry of the methyl groups has very little effect on the overall stability of the isomer. This could be partly due to the small size of the R group - bulkier groups (e.g. PPh3) would have a steric effect on the molecule and could lead to distortion of the ring.
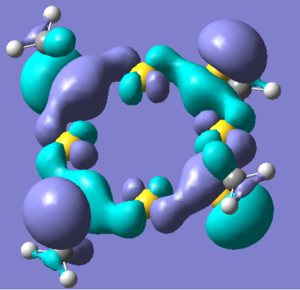


A MO analysis of Conformation3 has been performed. In big inorganic molecules containing atoms with many electrons, there are a lot of energy levels, therefore only the HOMO-LUMO region has been looked at. The HOMO shows electron density spread evenly around the ring between the S and Au atoms. The LUMO shows the presence of many nodes, between each atom in the ring, and clearly looks to be higher in energy than the HOMO. The charge distribution across the molecule has also been considered. The gold atoms have a positive charge, while the sulfur atoms have a negative charge, which is to be expected considering their relative positions in the periodic table.

Vibrational analysis was also carried out on all three configurations[18][19][20]. All three resultant spectra show the same pattern: eight main peaks in this region.
This analysis has shown that the cyclic tetramer is the preferred configuration for compounds of the form: (MeSAu)4, as shown by the optimisation process. The fact that the IR spectra, energies and bond lengths are the same for all three studied optimised configurations would appear to show that they are in fact the same molecule, and that there is rotation around the sulfur bond (not present in dimeric units[14].
References and Citations
- ↑ D-Space SPECTRa Chemical Repository: BH3 Population Analysis http://hdl.handle.net/10042/to-5771
- ↑ Diagram: P. Hunt, Molecular Orbitals in Organic Chemistry, Lecture 3 Model Answers, http://www.huntresearchgroup.org.uk/teaching/teaching_MOs_year2/L3_Tut_MO_diagram_BH3.pdf, accessed 7/12/10
- ↑ Log File for Optimisation of TlBr3: File:SamTLBR3OPT.LOG
- ↑ D-Space SPECTRa Chemical Repository: Initial Optimisation of Cis-Mo(CO)4(PCl3)2 http://hdl.handle.net/10042/to-5843
- ↑ D-Space SPECTRa Chemical Repository: Initial Optimisation of Trans-Mo(CO)4(PCl3)2 http://hdl.handle.net/10042/to-5844
- ↑ D-Space SPECTRa Chemical Repository: Second Optimisation of Cis-Mo(CO)4(PCl3)2 http://hdl.handle.net/10042/to-5882
- ↑ D-Space SPECTRa Chemical Repository: Second Optimisation of Trans-Mo(CO)4(PCl3)2 http://hdl.handle.net/10042/to-5890
- ↑ D. J.Darensbourg, R.L. Kemp, Inorg. Chem. 1978, 17, 2680DOI:10.1021/ic50187a062
- ↑ D-Space SPECTRa Chemical Repository: Frequency Analysis of Cis-Mo(CO)4(PCl3)2 http://hdl.handle.net/10042/to-5948
- ↑ D-Space SPECTRa Chemical Repository: Frequency Analysis of Trans-Mo(CO)4(PCl3)2 http://hdl.handle.net/10042/to-5949
- ↑ G. Socrates, Infrared and Raman Characteristic Group Frequencies: Tables and Charts, 2004, p.315
- ↑ M. Y. Darensbourg, D. J. Darensbourg, J. Chem. Ed.,1970, 47, 33 DOI:10.1021/ed047p33
- ↑ C.A. Simpson, C.L. Farrow, P. Tian, S.J.L. Billinge, B.J. Huffman, K.M. Harkness, D.E. Cliffel, Inorg. Chem, 2010, 49, 10858-10866 DOI:10.1021/ic101146e
- ↑ 14.0 14.1 H. Gronbeck, M. Walter, H. Hakkinen; J. Am. Chem. Soc., 2006, 128, 10268-10275 DOI:10.1021/ja062584w
- ↑ D-Space SPECTRa Chemical Repository: Optimisation of 1: http://hdl.handle.net/10042/to-5929
- ↑ D-Space SPECTRa Chemical Repository: Optimisation of 2: http://hdl.handle.net/10042/to-5930
- ↑ D-Space SPECTRa Chemical Repository: Optimisation of 3: http://hdl.handle.net/10042/to-5935
- ↑ D-Space SPECTRa Chemical Repository: Frequency Analysis of 1: http://hdl.handle.net/10042/to-6089
- ↑ D-Space SPECTRa Chemical Repository: Frequency Analysis of 2: http://hdl.handle.net/10042/to-6091
- ↑ D-Space SPECTRa Chemical Repository: Frequency Analysis of 3: http://hdl.handle.net/10042/to-6093

